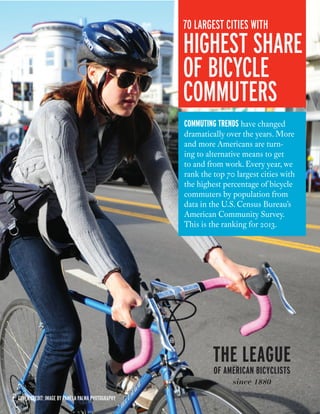
SlideShare a Scribd company logo
1 of 3
Download to read offline
cover credit: Image by Pamela Palma Photography 
70 largest cities with 
highest share 
of bicycle 
commuters 
commuting trends have changed 
dramatically over the years. More 
and more Americans are turn-ing 
to alternative means to get 
to and from work. Every year, we 
rank the top 70 largest cities with 
the highest percentage of bicycle 
commuters by population from 
data in the U.S. Census Bureau’s 
American Community Survey. 
This is the ranking for 2013.
City rank 
% of bike 
commuters population 
% growth from 
1990 to 2013 
% Growth from 
2000 to 2013 
Portland, OR 1 5.9% 611134 408.2% 234.0% 
Washington, DC 2 4.5% 649495 498.5% 290.3% 
San Francisco, CA 3 3.8% 837442 300.8% 93.9% 
Minneapolis, MN 4 3.7% 400079 129.6% 97.2% 
New Orleans, LA 5 3.6% 378715 292.3% 208.7% 
Seattle, WA 6 3.5% 652429 128.8% 84.8% 
Tucson, AZ 7 3.4% 526141 20.6% 52.5% 
Oakland, CA 8 3.0% 406228 167.4% 142.7% 
Honolulu, HI 9 2.4% 347907 92.0% 91.8% 
Philadelphia, PA 10 2.3% 1553165 296.5% 162.8% 
Pittsburgh, PA 11 2.2% 305838 440.1% 408.8% 
Sacramento, CA 12 2.2% 479671 16.4% 63.6% 
Denver, CO 13 2.0% 646449 129.7% 108.3% 
Boston, MA 14 1.9% 644710 122.3% 100.7% 
Santa Ana, CA 15 1.8% 334241 62.2% 62.8% 
St. Paul, MN 16 1.8% 294873 258.3% 179.6% 
Albuquerque, NM 17 1.7% 556489 42.9% 49.9% 
Buffalo, NY 18 1.6% 258945 360.0% 268.1% 
Austin, TX 19 1.4% 885415 76.8% 48.0% 
Chicago, IL 20 1.4% 2718789 389.2% 174.8% 
Long Beach, CA 21 1.2% 469384 26.0% 68.2% 
Los Angeles, CA 22 1.2% 3884340 105.9% 101.8% 
New York City, NY 23 1.2% 8405837 297.5% 156.6% 
Tampa, FL 24 1.2% 352981 31.5% 33.0% 
Anchorage, AK 25 1.2% 300950 155.8% 130.5% 
Milwaukee, WI 26 1.1% 599168 237.6% 240.6% 
Lexington-Fayette 
27 1.1% 308428 218.5% 93.7% 
county, KY 
Fresno, CA 28 1.1% 509965 8.5% 37.2% 
Columbus, OH 29 1.0% 822762 165.0% 199.0% 
Miami, FL 30 1.0% 417670 62.6% 78.9% 
San Jose, CA 31 1.0% 998514 54.9% 56.8% 
Mesa, AZ 32 1.0% 457595 -33.5% -22.5% 
Stockton, CA 33 0.9% 298115 -6.1% 8.6% 
Houston, TX 34 0.8% 2197374 139.3% 83.4% 
San Diego, CA 35 0.8% 1355885 -25.5% 13.0% 
St. Louis, MO 36 0.7% 318416 169.3% 107.4% 
Atlanta, GA 37 0.7% 447848 152.5% 128.3%
City rank 
% of bike 
commuters population 
% growth from 
1990 to 2013 
% Growth from 
2000 to 2013 
Colorado Springs, CO 38 0.7% 439858 44.7% 36.4% 
Anaheim, CA 39 0.7% 345015 -39.0% -41.3% 
Baltimore, MD 40 0.7% 622104 181.6% 111.3% 
Riverside, CA 41 0.7% 316613 -43.8% -19.3% 
Phoenix, AZ 42 0.6% 1513350 -44.1% -28.2% 
Virginia Beach, VA 43 0.6% 448479 39.9% 85.9% 
Detroit, MI 44 0.6% 688740 438.3% 255.1% 
Cincinnati, OH 45 0.5% 297498 126.3% 146.3% 
Louisville/Jefferson 
46 0.5% 609908 149.3% 5.3% 
County metro, KY 
Newark, NJ 47 0.5% 278436 103.2% 112.1% 
Las Vegas, NV 48 0.4% 603525 -36.9% 12.8% 
Wichita, KS 49 0.4% 386558 65.9% 146.0% 
Indianapolis, IN 50 0.4% 838425 150.0% 96.5% 
Bakersfield, CA 51 0.4% 363630 -26.7% -25.3% 
Memphis, TN 52 0.4% 653450 189.0% 249.9% 
Jacksonville, FL 53 0.4% 842588 -40.9% -17.0% 
Cleveland, OH 54 0.3% 390106 168.9% 62.1% 
Nashville-Davidson 
55 0.3% 634465 138.0% 144.0% 
metro, TN 
San Antonio, TX 56 0.3% 1409000 114.1% 100.4% 
Oklahoma City, OK 57 0.3% 610617 126.0% 176.6% 
Dallas, TX 58 0.3% 1257676 84.2% 111.9% 
Charlotte, NC 59 0.3% 792849 78.1% 88.2% 
Aurora, CO 60 0.3% 345814 23.9% 54.9% 
Toledo, OH 61 0.2% 282313 94.3% 12.5% 
Omaha, NE 62 0.2% 434353 69.5% 81.3% 
Tulsa, OK 63 0.2% 398724 11.9% 11.6% 
Fort Worth, TX 64 0.2% 794189 -0.134 25.9% 
Raleigh, NC 65 0.2% 431897 -0.657 -54.7% 
Kansas City, MO 66 0.2% 467082 0.346 22.1% 
El Paso, TX 67 0.1% 674438 -0.589 16.4% 
Arlington, TX 68 0.1% 379565 -0.192 -23.1% 
Plano, TX 69 0.1% 273519 -0.674 -36.3% 
Corpus Christi, TX 70 0.0% 316389 -0.807 -81.5%

More Related Content

Similar to ACS 2013: 70 Largest Cities with the Highest Bicycle Commute Rates

States Sorted by High School Grad
States Sorted by High School GradStates Sorted by High School Grad
States Sorted by High School Grad
Honolulu Civil Beat
 
NCHLP Tax Reform Poll Summary
NCHLP Tax Reform Poll SummaryNCHLP Tax Reform Poll Summary
NCHLP Tax Reform Poll Summary
ccpnc
 
CityDewpoint (°F)Current weatherBarometric PressurePress.docx
CityDewpoint (°F)Current weatherBarometric PressurePress.docxCityDewpoint (°F)Current weatherBarometric PressurePress.docx
CityDewpoint (°F)Current weatherBarometric PressurePress.docx
clarebernice
 
Open2012 fertility-entrepreneurship-ecosystem-down
Open2012 fertility-entrepreneurship-ecosystem-downOpen2012 fertility-entrepreneurship-ecosystem-down
Open2012 fertility-entrepreneurship-ecosystem-down
the nciia
 
AIER_2015_CDI_brochure
AIER_2015_CDI_brochureAIER_2015_CDI_brochure
AIER_2015_CDI_brochure
Todd Hoffman
 

Similar to ACS 2013: 70 Largest Cities with the Highest Bicycle Commute Rates (20)

Obesity Correlation Study and Linear Classifier Performance Analysis with oth...
Obesity Correlation Study and Linear Classifier Performance Analysis with oth...Obesity Correlation Study and Linear Classifier Performance Analysis with oth...
Obesity Correlation Study and Linear Classifier Performance Analysis with oth...
 
Citizenship entry
Citizenship entryCitizenship entry
Citizenship entry
 
2022-Q4-Ridership-APTA.pdf
2022-Q4-Ridership-APTA.pdf2022-Q4-Ridership-APTA.pdf
2022-Q4-Ridership-APTA.pdf
 
Walkable Neighborhoods Vacancy Rates Excel
Walkable Neighborhoods Vacancy Rates ExcelWalkable Neighborhoods Vacancy Rates Excel
Walkable Neighborhoods Vacancy Rates Excel
 
U.S. Presidential Election 2016 Popular Vote Statistics
U.S. Presidential Election 2016 Popular Vote StatisticsU.S. Presidential Election 2016 Popular Vote Statistics
U.S. Presidential Election 2016 Popular Vote Statistics
 
States Sorted by High School Grad
States Sorted by High School GradStates Sorted by High School Grad
States Sorted by High School Grad
 
shs2006
shs2006shs2006
shs2006
 
U.S. States Median Rent
U.S. States Median RentU.S. States Median Rent
U.S. States Median Rent
 
CDC Obesity
CDC Obesity CDC Obesity
CDC Obesity
 
2010 Best Cities for Job Creation
2010 Best Cities for Job Creation2010 Best Cities for Job Creation
2010 Best Cities for Job Creation
 
GDP Growth in 2014 by Metropolitan Area - Detailed Tables
GDP Growth in 2014 by Metropolitan Area - Detailed TablesGDP Growth in 2014 by Metropolitan Area - Detailed Tables
GDP Growth in 2014 by Metropolitan Area - Detailed Tables
 
State bridge rankings
State bridge rankingsState bridge rankings
State bridge rankings
 
New Jersey tourism revenue report for 2013
New Jersey tourism revenue report for 2013New Jersey tourism revenue report for 2013
New Jersey tourism revenue report for 2013
 
Departure Time State Rankings
Departure Time State RankingsDeparture Time State Rankings
Departure Time State Rankings
 
June 2015 - General Overview
June 2015 - General Overview June 2015 - General Overview
June 2015 - General Overview
 
NCHLP Tax Reform Poll Summary
NCHLP Tax Reform Poll SummaryNCHLP Tax Reform Poll Summary
NCHLP Tax Reform Poll Summary
 
Turkish consulate
Turkish consulateTurkish consulate
Turkish consulate
 
CityDewpoint (°F)Current weatherBarometric PressurePress.docx
CityDewpoint (°F)Current weatherBarometric PressurePress.docxCityDewpoint (°F)Current weatherBarometric PressurePress.docx
CityDewpoint (°F)Current weatherBarometric PressurePress.docx
 
Open2012 fertility-entrepreneurship-ecosystem-down
Open2012 fertility-entrepreneurship-ecosystem-downOpen2012 fertility-entrepreneurship-ecosystem-down
Open2012 fertility-entrepreneurship-ecosystem-down
 
AIER_2015_CDI_brochure
AIER_2015_CDI_brochureAIER_2015_CDI_brochure
AIER_2015_CDI_brochure
 

More from carolynbike

Surgeon General's Call to Action to Promote Walking & Walkable Communities
Surgeon General's Call to Action to Promote Walking & Walkable CommunitiesSurgeon General's Call to Action to Promote Walking & Walkable Communities
Surgeon General's Call to Action to Promote Walking & Walkable Communities
carolynbike
 
20 Speakers You Can't Miss at the Bike Summit & Women's Forum
20 Speakers You Can't Miss at the Bike Summit & Women's Forum20 Speakers You Can't Miss at the Bike Summit & Women's Forum
20 Speakers You Can't Miss at the Bike Summit & Women's Forum
carolynbike
 

More from carolynbike (10)

The State of the Movement
The State of the MovementThe State of the Movement
The State of the Movement
 
Alliance 2016 Sponsorship Invitation
Alliance 2016 Sponsorship InvitationAlliance 2016 Sponsorship Invitation
Alliance 2016 Sponsorship Invitation
 
Surgeon General's Call to Action to Promote Walking & Walkable Communities
Surgeon General's Call to Action to Promote Walking & Walkable CommunitiesSurgeon General's Call to Action to Promote Walking & Walkable Communities
Surgeon General's Call to Action to Promote Walking & Walkable Communities
 
Vision Zero resolution
Vision Zero resolutionVision Zero resolution
Vision Zero resolution
 
League of American Bicyclists: Seeing & Believing
League of American Bicyclists: Seeing & BelievingLeague of American Bicyclists: Seeing & Believing
League of American Bicyclists: Seeing & Believing
 
Future Bike Speakers!
Future Bike Speakers!Future Bike Speakers!
Future Bike Speakers!
 
20 Speakers You Can't Miss at the Bike Summit & Women's Forum
20 Speakers You Can't Miss at the Bike Summit & Women's Forum20 Speakers You Can't Miss at the Bike Summit & Women's Forum
20 Speakers You Can't Miss at the Bike Summit & Women's Forum
 
Dispelling the Myths; Marketing Bicycling to Women
Dispelling the Myths; Marketing Bicycling to Women Dispelling the Myths; Marketing Bicycling to Women
Dispelling the Myths; Marketing Bicycling to Women
 
National Women's Bicycling Forum Agenda
National Women's Bicycling Forum AgendaNational Women's Bicycling Forum Agenda
National Women's Bicycling Forum Agenda
 
Infographic: League of American Bicyclists 2013 Highlights
Infographic: League of American Bicyclists 2013 HighlightsInfographic: League of American Bicyclists 2013 Highlights
Infographic: League of American Bicyclists 2013 Highlights
 

Recently uploaded

Competitive Advantage slide deck___.pptx
Competitive Advantage slide deck___.pptxCompetitive Advantage slide deck___.pptx
Competitive Advantage slide deck___.pptx
ScottMeyers35
 
2024 asthma jkdjkfjsdklfjsdlkfjskldfgdsgerg
2024 asthma jkdjkfjsdklfjsdlkfjskldfgdsgerg2024 asthma jkdjkfjsdklfjsdlkfjskldfgdsgerg
2024 asthma jkdjkfjsdklfjsdlkfjskldfgdsgerg
MadhuKothuru
 
Cara Gugurkan Pembuahan Secara Alami Dan Cepat ABORSI KANDUNGAN 087776558899
Cara Gugurkan Pembuahan Secara Alami Dan Cepat ABORSI KANDUNGAN 087776558899Cara Gugurkan Pembuahan Secara Alami Dan Cepat ABORSI KANDUNGAN 087776558899
Cara Gugurkan Pembuahan Secara Alami Dan Cepat ABORSI KANDUNGAN 087776558899
Cara Menggugurkan Kandungan 087776558899
 
Nagerbazar @ Independent Call Girls Kolkata - 450+ Call Girl Cash Payment 800...
Nagerbazar @ Independent Call Girls Kolkata - 450+ Call Girl Cash Payment 800...Nagerbazar @ Independent Call Girls Kolkata - 450+ Call Girl Cash Payment 800...
Nagerbazar @ Independent Call Girls Kolkata - 450+ Call Girl Cash Payment 800...
HyderabadDolls
 

Recently uploaded (20)

Competitive Advantage slide deck___.pptx
Competitive Advantage slide deck___.pptxCompetitive Advantage slide deck___.pptx
Competitive Advantage slide deck___.pptx
 
2024 asthma jkdjkfjsdklfjsdlkfjskldfgdsgerg
2024 asthma jkdjkfjsdklfjsdlkfjskldfgdsgerg2024 asthma jkdjkfjsdklfjsdlkfjskldfgdsgerg
2024 asthma jkdjkfjsdklfjsdlkfjskldfgdsgerg
 
Cara Gugurkan Pembuahan Secara Alami Dan Cepat ABORSI KANDUNGAN 087776558899
Cara Gugurkan Pembuahan Secara Alami Dan Cepat ABORSI KANDUNGAN 087776558899Cara Gugurkan Pembuahan Secara Alami Dan Cepat ABORSI KANDUNGAN 087776558899
Cara Gugurkan Pembuahan Secara Alami Dan Cepat ABORSI KANDUNGAN 087776558899
 
Call Girl Service in Korba 9332606886 High Profile Call Girls You Can Get ...
Call Girl Service in Korba   9332606886  High Profile Call Girls You Can Get ...Call Girl Service in Korba   9332606886  High Profile Call Girls You Can Get ...
Call Girl Service in Korba 9332606886 High Profile Call Girls You Can Get ...
 
Vasai Call Girls In 07506202331, Nalasopara Call Girls In Mumbai
Vasai Call Girls In 07506202331, Nalasopara Call Girls In MumbaiVasai Call Girls In 07506202331, Nalasopara Call Girls In Mumbai
Vasai Call Girls In 07506202331, Nalasopara Call Girls In Mumbai
 
The NAP process & South-South peer learning
The NAP process & South-South peer learningThe NAP process & South-South peer learning
The NAP process & South-South peer learning
 
Coastal Protection Measures in Hulhumale'
Coastal Protection Measures in Hulhumale'Coastal Protection Measures in Hulhumale'
Coastal Protection Measures in Hulhumale'
 
Dating Call Girls inBaloda Bazar Bhatapara 9332606886Call Girls Advance Cash...
Dating Call Girls inBaloda Bazar Bhatapara  9332606886Call Girls Advance Cash...Dating Call Girls inBaloda Bazar Bhatapara  9332606886Call Girls Advance Cash...
Dating Call Girls inBaloda Bazar Bhatapara 9332606886Call Girls Advance Cash...
 
Peace-Conflict-and-National-Adaptation-Plan-NAP-Processes-.pdf
Peace-Conflict-and-National-Adaptation-Plan-NAP-Processes-.pdfPeace-Conflict-and-National-Adaptation-Plan-NAP-Processes-.pdf
Peace-Conflict-and-National-Adaptation-Plan-NAP-Processes-.pdf
 
Finance strategies for adaptation. Presentation for CANCC
Finance strategies for adaptation. Presentation for CANCCFinance strategies for adaptation. Presentation for CANCC
Finance strategies for adaptation. Presentation for CANCC
 
Nagerbazar @ Independent Call Girls Kolkata - 450+ Call Girl Cash Payment 800...
Nagerbazar @ Independent Call Girls Kolkata - 450+ Call Girl Cash Payment 800...Nagerbazar @ Independent Call Girls Kolkata - 450+ Call Girl Cash Payment 800...
Nagerbazar @ Independent Call Girls Kolkata - 450+ Call Girl Cash Payment 800...
 
Call Girls Koregaon Park - 8250092165 Our call girls are sure to provide you ...
Call Girls Koregaon Park - 8250092165 Our call girls are sure to provide you ...Call Girls Koregaon Park - 8250092165 Our call girls are sure to provide you ...
Call Girls Koregaon Park - 8250092165 Our call girls are sure to provide you ...
 
2024: The FAR, Federal Acquisition Regulations, Part 32
2024: The FAR, Federal Acquisition Regulations, Part 322024: The FAR, Federal Acquisition Regulations, Part 32
2024: The FAR, Federal Acquisition Regulations, Part 32
 
Call Girls Mehsana / 8250092165 Genuine Call girls with real Photos and Number
Call Girls Mehsana / 8250092165 Genuine Call girls with real Photos and NumberCall Girls Mehsana / 8250092165 Genuine Call girls with real Photos and Number
Call Girls Mehsana / 8250092165 Genuine Call girls with real Photos and Number
 
Bhubaneswar Call Girls Bhubaneswar 👉👉 9777949614 Top Class Call Girl Service ...
Bhubaneswar Call Girls Bhubaneswar 👉👉 9777949614 Top Class Call Girl Service ...Bhubaneswar Call Girls Bhubaneswar 👉👉 9777949614 Top Class Call Girl Service ...
Bhubaneswar Call Girls Bhubaneswar 👉👉 9777949614 Top Class Call Girl Service ...
 
Contributi dei parlamentari del PD - Contributi L. 3/2019
Contributi dei parlamentari del PD - Contributi L. 3/2019Contributi dei parlamentari del PD - Contributi L. 3/2019
Contributi dei parlamentari del PD - Contributi L. 3/2019
 
Pakistani Call girls in Sharjah 0505086370 Sharjah Call girls
Pakistani Call girls in Sharjah 0505086370 Sharjah Call girlsPakistani Call girls in Sharjah 0505086370 Sharjah Call girls
Pakistani Call girls in Sharjah 0505086370 Sharjah Call girls
 
Election 2024 Presiding Duty Keypoints_01.pdf
Election 2024 Presiding Duty Keypoints_01.pdfElection 2024 Presiding Duty Keypoints_01.pdf
Election 2024 Presiding Duty Keypoints_01.pdf
 
tOld settlement register shouldnotaffect BTR
tOld settlement register shouldnotaffect BTRtOld settlement register shouldnotaffect BTR
tOld settlement register shouldnotaffect BTR
 
Financing strategies for adaptation. Presentation for CANCC
Financing strategies for adaptation. Presentation for CANCCFinancing strategies for adaptation. Presentation for CANCC
Financing strategies for adaptation. Presentation for CANCC
 

ACS 2013: 70 Largest Cities with the Highest Bicycle Commute Rates

  • 1. cover credit: Image by Pamela Palma Photography 70 largest cities with highest share of bicycle commuters commuting trends have changed dramatically over the years. More and more Americans are turn-ing to alternative means to get to and from work. Every year, we rank the top 70 largest cities with the highest percentage of bicycle commuters by population from data in the U.S. Census Bureau’s American Community Survey. This is the ranking for 2013.
  • 2. City rank % of bike commuters population % growth from 1990 to 2013 % Growth from 2000 to 2013 Portland, OR 1 5.9% 611134 408.2% 234.0% Washington, DC 2 4.5% 649495 498.5% 290.3% San Francisco, CA 3 3.8% 837442 300.8% 93.9% Minneapolis, MN 4 3.7% 400079 129.6% 97.2% New Orleans, LA 5 3.6% 378715 292.3% 208.7% Seattle, WA 6 3.5% 652429 128.8% 84.8% Tucson, AZ 7 3.4% 526141 20.6% 52.5% Oakland, CA 8 3.0% 406228 167.4% 142.7% Honolulu, HI 9 2.4% 347907 92.0% 91.8% Philadelphia, PA 10 2.3% 1553165 296.5% 162.8% Pittsburgh, PA 11 2.2% 305838 440.1% 408.8% Sacramento, CA 12 2.2% 479671 16.4% 63.6% Denver, CO 13 2.0% 646449 129.7% 108.3% Boston, MA 14 1.9% 644710 122.3% 100.7% Santa Ana, CA 15 1.8% 334241 62.2% 62.8% St. Paul, MN 16 1.8% 294873 258.3% 179.6% Albuquerque, NM 17 1.7% 556489 42.9% 49.9% Buffalo, NY 18 1.6% 258945 360.0% 268.1% Austin, TX 19 1.4% 885415 76.8% 48.0% Chicago, IL 20 1.4% 2718789 389.2% 174.8% Long Beach, CA 21 1.2% 469384 26.0% 68.2% Los Angeles, CA 22 1.2% 3884340 105.9% 101.8% New York City, NY 23 1.2% 8405837 297.5% 156.6% Tampa, FL 24 1.2% 352981 31.5% 33.0% Anchorage, AK 25 1.2% 300950 155.8% 130.5% Milwaukee, WI 26 1.1% 599168 237.6% 240.6% Lexington-Fayette 27 1.1% 308428 218.5% 93.7% county, KY Fresno, CA 28 1.1% 509965 8.5% 37.2% Columbus, OH 29 1.0% 822762 165.0% 199.0% Miami, FL 30 1.0% 417670 62.6% 78.9% San Jose, CA 31 1.0% 998514 54.9% 56.8% Mesa, AZ 32 1.0% 457595 -33.5% -22.5% Stockton, CA 33 0.9% 298115 -6.1% 8.6% Houston, TX 34 0.8% 2197374 139.3% 83.4% San Diego, CA 35 0.8% 1355885 -25.5% 13.0% St. Louis, MO 36 0.7% 318416 169.3% 107.4% Atlanta, GA 37 0.7% 447848 152.5% 128.3%
  • 3. City rank % of bike commuters population % growth from 1990 to 2013 % Growth from 2000 to 2013 Colorado Springs, CO 38 0.7% 439858 44.7% 36.4% Anaheim, CA 39 0.7% 345015 -39.0% -41.3% Baltimore, MD 40 0.7% 622104 181.6% 111.3% Riverside, CA 41 0.7% 316613 -43.8% -19.3% Phoenix, AZ 42 0.6% 1513350 -44.1% -28.2% Virginia Beach, VA 43 0.6% 448479 39.9% 85.9% Detroit, MI 44 0.6% 688740 438.3% 255.1% Cincinnati, OH 45 0.5% 297498 126.3% 146.3% Louisville/Jefferson 46 0.5% 609908 149.3% 5.3% County metro, KY Newark, NJ 47 0.5% 278436 103.2% 112.1% Las Vegas, NV 48 0.4% 603525 -36.9% 12.8% Wichita, KS 49 0.4% 386558 65.9% 146.0% Indianapolis, IN 50 0.4% 838425 150.0% 96.5% Bakersfield, CA 51 0.4% 363630 -26.7% -25.3% Memphis, TN 52 0.4% 653450 189.0% 249.9% Jacksonville, FL 53 0.4% 842588 -40.9% -17.0% Cleveland, OH 54 0.3% 390106 168.9% 62.1% Nashville-Davidson 55 0.3% 634465 138.0% 144.0% metro, TN San Antonio, TX 56 0.3% 1409000 114.1% 100.4% Oklahoma City, OK 57 0.3% 610617 126.0% 176.6% Dallas, TX 58 0.3% 1257676 84.2% 111.9% Charlotte, NC 59 0.3% 792849 78.1% 88.2% Aurora, CO 60 0.3% 345814 23.9% 54.9% Toledo, OH 61 0.2% 282313 94.3% 12.5% Omaha, NE 62 0.2% 434353 69.5% 81.3% Tulsa, OK 63 0.2% 398724 11.9% 11.6% Fort Worth, TX 64 0.2% 794189 -0.134 25.9% Raleigh, NC 65 0.2% 431897 -0.657 -54.7% Kansas City, MO 66 0.2% 467082 0.346 22.1% El Paso, TX 67 0.1% 674438 -0.589 16.4% Arlington, TX 68 0.1% 379565 -0.192 -23.1% Plano, TX 69 0.1% 273519 -0.674 -36.3% Corpus Christi, TX 70 0.0% 316389 -0.807 -81.5%