SlideShare a Scribd company logo
1 of 15
Download to read offline
Correlation Study and Linear Classifier Performance Analysis for
Obesity from CDC and Census Data Merge for Urban Population
Copyright © 2017 Soumyendu Sarkar. All Rights Reserved. 1
Soumyendu Sarkar
States with Lowest and Highest Obesity in Cities
Copyright © 2017 Soumyendu Sarkar. All Rights Reserved. 2
Rank State State BMI
1 DE Delaware 32.0
2 MS Mississippi 31.7
3 OH Ohio 31.1
4 MI Michigan 29.6
5 AL Alabama 29.3
6 LA Louisiana 29.2
7 MD Maryland 28.8
8 WI Wisconsin 28.4
9 IN Indiana 27.9
10 PA Pennsylvania 27.5
11 WV West Virginia 27.5
12 MO Missouri 27.4
13 TN Tennessee 27.0
14 GA Georgia 26.6
15 IA Iowa 26.5
16 NJ New Jersey 26.4
17 AR Arkansas 26.3
18 ND North Dakota 26.3
19 KS Kansas 26.3
20 TX Texas 26.2
21 KY Kentucky 26.2
22 VA Virginia 25.9
23 SC South Carolina 25.7
24 OK Oklahoma 25.5
25 IL Illinois 25.2
Rank State State BMI
1 CO Colorado 17.7
2 HI Hawaii 17.7
3 VT Vermont 18.5
4 CA California 19.6
5 NM New Mexico 20.2
6 MT Montana 21.6
7 OR Oregon 21.6
8 ME Maine 21.8
9 NY New York 21.8
10 WA Washington 21.9
11 NV Nevada 22.0
12 AK Alaska 22.3
13 MN Minnesota 22.3
14 ID Idaho 22.3
15 UT Utah 22.6
16 AZ Arizona 22.7
17 FL Florida 22.8
18 MA Massachusetts 22.8
19 RI Rhode Island 23.5
20 WY Wyoming 23.7
21 NE Nebraska 23.9
22 SD South Dakota 24.0
23 NH New Hampshire 24.5
24 NC North Carolina 24.5
25 CT Connecticut 25.0
Healthy Cities with Least Obesity
Rank City State BMI
1 Milpitas CA 12.2
2 Fremont CA 12.9
3 Irvine CA 13.4
4 Union City CA 13.6
5 Daly City CA 13.9
6 Westminster CA 13.9
7 Alhambra CA 14.2
8 Boulder CO 14.3
9 Longmont CO 14.3
10 Sunnyvale CA 14.5
11 Torrance CA 14.5
12 Pleasanton CA 14.8
13 Garden Grove CA 15
14 Chino Hills CA 15.1
15 Santa Clara CA 15.1
16 Mission Viejo CA 15.5
17 Newport Beach CA 15.5
18 San Francisco CA 15.5
19 Alameda CA 15.6
20 Lake Forest CA 15.6
Rank City State BMI
21 Lake Forest CA 15.6
22 Santa Fe NM 15.6
23 Huntington Beach CA 15.8
24 Loveland CO 15.8
25 Arvada CO 15.9
26 Buena Park CA 15.9
27 Denver CO 15.9
28 Mountain View CA 16
29 Bellevue WA 16.3
30 Centennial CO 16.3
31 Fullerton CA 16.3
32 Tustin CA 16.3
33 San Jose CA 16.4
34 Fort Collins CO 16.5
35 Redondo Beach CA 16.5
36 Johns Creek GA 16.6
37 Lakewood CO 16.6
38 San Leandro CA 16.7
39 Livermore CA 16.9
40 San Ramon CA 16.9
Rank City State BMI
41 Thousand Oaks CA 16.9
42 Carlsbad CA 17
43 Orange CA 17
44 Simi Valley CA 17
45 Sparks NV 17.3
46 West Covina CA 17.3
47 Boca Raton FL 17.4
48 San Mateo CA 17.4
49 Schaumburg IL 17.4
50 Lakewood CA 17.5
51 Burbank CA 17.7
52 Costa Mesa CA 17.7
53 Honolulu HI 17.7
54 Sugar Land TX 17.7
55 Westminster CO 17.7
56 Quincy MA 17.8
57 Reno NV 17.8
58 Santa Monica CA 17.8
59 Anaheim CA 17.9
60 Elk Grove CA 17.9
Rank City State BMI
61 Folsom CA 17.9
62 Plymouth MN 17.9
63 Glendale CA 18
64 San Diego CA 18
65 Santa Clarita CA 18
66 Arlington Heights IL 18.1
67 Newton MA 18.2
68 Roseville CA 18.2
69 Santa Rosa CA 18.2
70 Cary NC 18.3
71 Rancho Cucamonga CA 18.3
72 Berkeley CA 18.4
73 Hayward CA 18.4
74 Burlington VT 18.5
75 Chula Vista CA 18.6
76 Clovis CA 18.6
77 San Marcos CA 18.6
78 Colorado Springs CO 18.7
79 Redlands CA 18.7
80 San Buenaventura CA 18.7
Copyright © 2017 Soumyendu Sarkar. All Rights Reserved. 3
Cities with Highest Obesity
Rank City State BMI
1 Dayton OH 38.8
2 Gary IN 38.2
3 Detroit MI 36.4
4 Youngstown OH 35.1
5 Macon GA 34.7
6 Kalamazoo MI 34.5
7 Flint MI 34.1
8 Cleveland OH 33.8
9 Jackson MS 33.3
10 Toledo OH 33.2
11 Camden NJ 33.1
12 Reading PA 32.6
13 Albany GA 32.4
14 Wilmington DE 32
15 Tuscaloosa AL 31.8
16 Birmingham AL 31.7
17 Milwaukee WI 31.6
18 Brownsville TX 31.5
19 Rochester NY 31.3
20 Portsmouth VA 31.1
Rank City State BMI
21 Pharr TX 30.9
22 Mobile AL 30.8
23 Southfield MI 30.8
24 Hampton VA 30.7
25 Trenton NJ 30.7
26 Canton OH 30.6
27 Hartford CT 30.4
28 St. Louis MO 30.4
29 Baton Rouge LA 30.3
30 Kansas City KS 30.3
31 Laredo TX 30.3
32 Beaumont TX 30.2
33 Montgomery AL 30.2
34 Rockford IL 30.1
35 South Bend IN 30.1
36 Akron OH 30
37 Cincinnati OH 30
38 Shreveport LA 30
39 Corpus Christi TX 29.9
40 Lake Charles LA 29.7
Rank City State BMI
41 Hammond IN 29.5
42 Kenner LA 29.5
43 Newark NJ 29.5
44 Buffalo NY 29.4
45 Racine WI 29.4
46 Lansing MI 29.3
47 Memphis TN 29.3
48 Muncie IN 29.3
49 Edinburg TX 29.2
50 Savannah GA 29.1
51 Springfield MO 29.1
52 Paterson NJ 29
53 Waco TX 29
54 Allentown PA 28.8
55 Augusta GA 28.8
56 Baltimore MD 28.8
57 Columbus OH 28.8
58 New Haven CT 28.8
59 Erie PA 28.7
60 Grand Rapids MI 28.7
Rank City State BMI
61 McAllen TX 28.6
62 Winston-Salem NC 28.6
63 Columbia SC 28.5
64 Kansas City MO 28.5
65 Longview TX 28.5
66 Brockton MA 28.4
67 Chattanooga TN 28.4
68 Mission TX 28.4
69 Fort Smith AR 28.3
70 Indianapolis IN 28.3
71 Kenosha WI 28.3
72 Lawton OK 28.3
73 New Orleans LA 28.3
74 Topeka KS 28.3
75 Decatur IL 28.2
76 El Paso TX 28.2
77 North Charleston SC 28.2
78 Sioux City IA 28.2
79 Tyler TX 28.2
80 Fayetteville NC 28.1
Copyright © 2017 Soumyendu Sarkar. All Rights Reserved. 4
Linear Classifier for Obesity Classification
Methods
Merge Census Tract County data with CDC 500 cities data with population weights to augment
feature set
Correlation Analysis of Features from Census data with Obesity and include Top 30 Features
for classification
Obtain 400 Training & 100 Test Feature vectors with shuffling from 500 cities database to
remove bias
Implement Linear Classifier with Squared and Cubed Non-Linear terms to enhanced accuracy
and use data normalization to optimize performance
Implement Principal Component Analysis for Obesity Classification
BMI Class Definition:
Healthy : BMI < 20
Average : 20 >= BMI < 27
Obese : BMI >= 27
Linear Classifier with Normalized SQUARED Terms with 30 features
Training Testing
Accuracy 0.88 0.84
Highest PPV 0.95 1.00
Lowest PPV 0.86 0.77
PPV for Healthy Classification 0.95 0.89
PPV for Average Classification 0.86 0.77
PPV for Obese Classification 0.87 1.00
Linear Classifier with Normalized CUBED and Squared Terms with 30
features
Training Testing
Accuracy 0.91 0.80
Highest PPV 1.00 1.00
Lowest PPV 0.88 0.73
PPV for Healthy Classification 0.97 0.85
PPV for Average Classification 0.88 0.73
PPV for Obese Classification 0.90 1.00
Over-Fitting ?
Objective
Use Linear Classification and Principal Component Analysis to implement a
Machine Learning Model to Classify Obesity from CDC data for 500 cities
and Census Tract & County data
Research on Variation of Classification Performance with variation of
feature set
Research on Classification Performance with additional non-linear terms in
Linear Classification
Copyright © 2017 Soumyendu Sarkar. All Rights Reserved. 5
CDC & Census Data Correlation Analysis with Obesity
Copyright © 2017 Soumyendu Sarkar. All Rights Reserved. 6
Feature Correlation with Obesity
Rank FEATURE CORRELATION
1 Teeth Loss 0.8136687437263442
2 Smoking 0.7782953004281681
3 Low Physical Activity 0.7088155129076699
4 Stroke 0.6884054217581411
5 COPD 0.6520786256266082
6 Dental Visit -0.651864343360142
7 High Blood Pressure 0.6514067957254205
8 Asthma 0.6476837471816237
9 Diabetes 0.6450348353789633
10 Poor Mental Health 0.6341907564608653
11 Poor Physical Health 0.6029283356020563
12 Adults % with high school diploma 0.5760699676500974
13 Less Sleep 0.5680532130394792
14 Asian female population -0.5633977183347055
15 Asian male population -0.5517973396661352
16 Arthritis 0.5202128697892304
17 Coronary Heart Disease 0.5150142669268579
18 No Health Insurance 0.5044810771017083
19 Median_Household_income_2015 -0.49924542549151063
20 Chronic Kidney Disease 0.49136753647522907
21 Taking BP Medication 0.4835522676520599
22 Pap Smear Test -0.40802112000662577
23 Colorectal Cancer Screening -0.40387566366546335
24 African American male population 0.3782030479176095
Rank FEATURE CORRELATION
25 Adults % bachelor's degree or higher -0.37409617528765426
26 African American female population 0.37191965521328857
27 Percent of people in poverty 0.3375526128971053
28 Cholesterol Screening -0.3372678541648043
29 Total population -0.3245786518713684
30 Annual Checkup 0.29761058387099665
31 Mammography -0.2854508003727619
32 % of People in poverty -0.2701119883267754
33 High Cholesterol 0.25805175528402285
34 Pacific Islander Female population -0.25486328530053304
35 Pacific Islander Male population -0.2475011132522548
36 Binge Drinking -0.2354599926965364
37 Total male population -0.22279697497623033
38 Total female population 0.2227969749762296
39 Preventive services for older women -0.217631636493823
40 American Indian and Alaskan Male
population
-0.1733907182844397
41 American Indian and Alaskan Female
population
-0.16113420140074838
42 Cancer (except skin) -0.1259704222265354
43 Adults % with college or associate's
degree
0.11066137961902359
44 Unemployment_rate_2014 0.0722820170201452
45 Preventive services for older men -0.03667305959706792
46 adults % with NO high school diploma 0.0029059468315383538
47 White female population 0.002221613640036274
48 White male population -0.0015587877326375108
Copyright © 2017 Soumyendu Sarkar. All Rights Reserved. 7
Linear Classifier (Training)
The number of features were varied from 2 to 30 for the Classifier
Both Square and Cube Non-Linear functions were added in addition to feature terms
Observations
Accuracy and PPV goes up with inclusions of more
FEATURES
Accuracy and PPV goes up with inclusions of non-
linear SQUARED terms of Feature values
Accuracy and PPV goes up FURTHER with
inclusions of non-linear CUBED and SQUARED terms of
Feature values
Normalization of features improves performance
when non-linear functions specially Cubes and also
Squares are included in Linear Classifier
How TRAINING Accuracy and PPV varies with ?
Number of Features
Non-Linear Functions
Copyright © 2017 Soumyendu Sarkar. All Rights Reserved. 8
Linear Classifier (Testing)
The number of features were varied from 2 to 30 for the Classifier
Both Square and Cube Non-Linear functions were added in addition to feature terms
Observations
Accuracy and PPV goes up with
inclusions of more FEATURES
Accuracy and PPV goes up with
inclusions of non-linear SQUARED terms
of Feature values
Accuracy and PPV goes up FURTHER
with inclusions of non-linear CUBED
and SQUARED terms with lower
number of Features, but then goes
lower than that of LC with SQUARED
terms with inclusion of more features.
This is likely due to OVER-FITTING
Normalization of features improves
performance when non-linear
functions specially Cubes and also
Squares are included in Linear Classifier
How TESTING Accuracy and PPV varies
with ?
Number of Features
Non-Linear Functions
Copyright © 2017 Soumyendu Sarkar. All Rights Reserved. 9
Linear Classifier
Testing VS Training Classification Performance
Accuracy of classification of Testing is less than that of Training but mostly within 5% for all three classifiers for the range of number of
features
Obesity classification PPV is more for Testing than that of Training and reaches 100% when more number of features are included
specially with non-linear Squared and Cubed terms
Average BMI classification PPV is less for Testing than that of Training
Even though classification performance for test data is significantly better with non-linear Squared terms in the Linear Classifier,
inclusion of Cubed terms does not significantly help classification with Test data performance
Copyright © 2017 Soumyendu Sarkar. All Rights Reserved. 10
Distribution of Urban Health Factors by States
Copyright © 2017 Soumyendu Sarkar. All Rights Reserved. 11
Smoking
100% Adult Teeth Loss for 65 years old or older
Low Physical Activity
Stroke
Distribution of Urban Health Factors by States
Copyright © 2017 Soumyendu Sarkar. All Rights Reserved. 12
High Blood Pressure
Asthma Diabetes Poor Physical Health
Distribution of Urban Health Factors by States
Copyright © 2017 Soumyendu Sarkar. All Rights Reserved. 13
Diabetes
No Health InsuranceCoronary Heart DiseaseArthritis
Less Sleep
Distribution of Urban Health Factors by States
Copyright © 2017 Soumyendu Sarkar. All Rights Reserved. 14
Cancer – Poorly CorrelatedCholesterol ScreeningChronic Kidney Disorder
References & Acknowledgements
• Overweight & Obesity - https://www.cdc.gov/obesity/data/adult.html
• 500 Cities: Local Data for Better Health - https://www.cdc.gov/500cities/
• Chronic Disease and Health Promotion Data & Indicators - https://chronicdata.cdc.gov/health-
area/nutrition-physicalactivity-obesity
• Population Estimates, Unemployment, Education - https://www.census.gov/data.html
• Special thanks to Hakan Egeli for identifying and collecting some of the CDC and Census Data
Copyright © 2017 Soumyendu Sarkar. All Rights Reserved. 15

More Related Content

Similar to Obesity Correlation Study and Linear Classifier Performance Analysis with other Health factors from CDC and Census Tract Data Merge for USA Urban Population

ACS 2013: 70 Largest Cities with the Highest Bicycle Commute Rates
ACS 2013: 70 Largest Cities with the Highest Bicycle Commute RatesACS 2013: 70 Largest Cities with the Highest Bicycle Commute Rates
ACS 2013: 70 Largest Cities with the Highest Bicycle Commute Ratescarolynbike
 
Alvarez Paulo Math IA Draft PDF FINAL
Alvarez Paulo Math IA Draft PDF FINALAlvarez Paulo Math IA Draft PDF FINAL
Alvarez Paulo Math IA Draft PDF FINALPaulo Martin Alvarez
 
Somerset County: Embracing Diversity & Inclusion
Somerset County: Embracing Diversity & InclusionSomerset County: Embracing Diversity & Inclusion
Somerset County: Embracing Diversity & InclusionMelissa DeFreest
 
presidents_club_leaderboard_Feb2016
presidents_club_leaderboard_Feb2016presidents_club_leaderboard_Feb2016
presidents_club_leaderboard_Feb2016George Boelman
 
AIER_2015_CDI_brochure
AIER_2015_CDI_brochureAIER_2015_CDI_brochure
AIER_2015_CDI_brochureTodd Hoffman
 
Top 25 Worst-Connected Cities Poor Households ACS 2014
Top 25 Worst-Connected Cities Poor Households ACS 2014Top 25 Worst-Connected Cities Poor Households ACS 2014
Top 25 Worst-Connected Cities Poor Households ACS 2014Angela Siefer
 
2016 Presidential Election - Counties With Large Urban Concentration
2016 Presidential Election - Counties With Large Urban Concentration2016 Presidential Election - Counties With Large Urban Concentration
2016 Presidential Election - Counties With Large Urban ConcentrationBruce LaCour
 
Q3 2015 SFH - Green Mountain Estates
Q3 2015 SFH - Green Mountain EstatesQ3 2015 SFH - Green Mountain Estates
Q3 2015 SFH - Green Mountain Estates8zmarketing
 
Women’s Employment and Earnings: Best States For Women To Work
Women’s Employment and Earnings: Best States For Women To WorkWomen’s Employment and Earnings: Best States For Women To Work
Women’s Employment and Earnings: Best States For Women To WorkAmarendra Bhushan Dhiraj
 
Mary Kealey - Q3 farm check-in
Mary Kealey - Q3 farm check-inMary Kealey - Q3 farm check-in
Mary Kealey - Q3 farm check-in8zmarketing
 
Facts & Figures 2016: How Does Your State Compare?
Facts & Figures 2016: How Does Your State Compare?Facts & Figures 2016: How Does Your State Compare?
Facts & Figures 2016: How Does Your State Compare?Tax Foundation
 
Average Tuition and Educational Attainment in the United States
Average Tuition and Educational Attainment in the United StatesAverage Tuition and Educational Attainment in the United States
Average Tuition and Educational Attainment in the United StatesMitch Barrick
 
CBS TV News stations and affiliates
CBS TV News stations and affiliatesCBS TV News stations and affiliates
CBS TV News stations and affiliatesabandoneddecoy407
 
CityDewpoint (°F)Current weatherBarometric PressurePress.docx
CityDewpoint (°F)Current weatherBarometric PressurePress.docxCityDewpoint (°F)Current weatherBarometric PressurePress.docx
CityDewpoint (°F)Current weatherBarometric PressurePress.docxclarebernice
 
State of the Church
State of the ChurchState of the Church
State of the Churchthefoundry
 

Similar to Obesity Correlation Study and Linear Classifier Performance Analysis with other Health factors from CDC and Census Tract Data Merge for USA Urban Population (20)

ACS 2013: 70 Largest Cities with the Highest Bicycle Commute Rates
ACS 2013: 70 Largest Cities with the Highest Bicycle Commute RatesACS 2013: 70 Largest Cities with the Highest Bicycle Commute Rates
ACS 2013: 70 Largest Cities with the Highest Bicycle Commute Rates
 
Alvarez Paulo Math IA Draft PDF FINAL
Alvarez Paulo Math IA Draft PDF FINALAlvarez Paulo Math IA Draft PDF FINAL
Alvarez Paulo Math IA Draft PDF FINAL
 
Somerset County: Embracing Diversity & Inclusion
Somerset County: Embracing Diversity & InclusionSomerset County: Embracing Diversity & Inclusion
Somerset County: Embracing Diversity & Inclusion
 
presidents_club_leaderboard_Feb2016
presidents_club_leaderboard_Feb2016presidents_club_leaderboard_Feb2016
presidents_club_leaderboard_Feb2016
 
2016 pac report. pdf
2016 pac report. pdf2016 pac report. pdf
2016 pac report. pdf
 
AIER_2015_CDI_brochure
AIER_2015_CDI_brochureAIER_2015_CDI_brochure
AIER_2015_CDI_brochure
 
Top 25 Worst-Connected Cities Poor Households ACS 2014
Top 25 Worst-Connected Cities Poor Households ACS 2014Top 25 Worst-Connected Cities Poor Households ACS 2014
Top 25 Worst-Connected Cities Poor Households ACS 2014
 
2016 Presidential Election - Counties With Large Urban Concentration
2016 Presidential Election - Counties With Large Urban Concentration2016 Presidential Election - Counties With Large Urban Concentration
2016 Presidential Election - Counties With Large Urban Concentration
 
Q3 2015 SFH - Green Mountain Estates
Q3 2015 SFH - Green Mountain EstatesQ3 2015 SFH - Green Mountain Estates
Q3 2015 SFH - Green Mountain Estates
 
Music and Menory State statuspdf version2b
Music and Menory State statuspdf version2bMusic and Menory State statuspdf version2b
Music and Menory State statuspdf version2b
 
Women’s Employment and Earnings: Best States For Women To Work
Women’s Employment and Earnings: Best States For Women To WorkWomen’s Employment and Earnings: Best States For Women To Work
Women’s Employment and Earnings: Best States For Women To Work
 
Undiscovered America TV
Undiscovered America TVUndiscovered America TV
Undiscovered America TV
 
Mary Kealey - Q3 farm check-in
Mary Kealey - Q3 farm check-inMary Kealey - Q3 farm check-in
Mary Kealey - Q3 farm check-in
 
Facts & Figures 2016: How Does Your State Compare?
Facts & Figures 2016: How Does Your State Compare?Facts & Figures 2016: How Does Your State Compare?
Facts & Figures 2016: How Does Your State Compare?
 
Average Tuition and Educational Attainment in the United States
Average Tuition and Educational Attainment in the United StatesAverage Tuition and Educational Attainment in the United States
Average Tuition and Educational Attainment in the United States
 
Undiscovered America Clearance List
Undiscovered America Clearance ListUndiscovered America Clearance List
Undiscovered America Clearance List
 
CBS TV News stations and affiliates
CBS TV News stations and affiliatesCBS TV News stations and affiliates
CBS TV News stations and affiliates
 
Michigan 4-30-2020 Coronavirus Analysis
Michigan 4-30-2020 Coronavirus AnalysisMichigan 4-30-2020 Coronavirus Analysis
Michigan 4-30-2020 Coronavirus Analysis
 
CityDewpoint (°F)Current weatherBarometric PressurePress.docx
CityDewpoint (°F)Current weatherBarometric PressurePress.docxCityDewpoint (°F)Current weatherBarometric PressurePress.docx
CityDewpoint (°F)Current weatherBarometric PressurePress.docx
 
State of the Church
State of the ChurchState of the Church
State of the Church
 

Recently uploaded

Predicting Salary Using Data Science: A Comprehensive Analysis.pdf
Predicting Salary Using Data Science: A Comprehensive Analysis.pdfPredicting Salary Using Data Science: A Comprehensive Analysis.pdf
Predicting Salary Using Data Science: A Comprehensive Analysis.pdfBoston Institute of Analytics
 
Consent & Privacy Signals on Google *Pixels* - MeasureCamp Amsterdam 2024
Consent & Privacy Signals on Google *Pixels* - MeasureCamp Amsterdam 2024Consent & Privacy Signals on Google *Pixels* - MeasureCamp Amsterdam 2024
Consent & Privacy Signals on Google *Pixels* - MeasureCamp Amsterdam 2024thyngster
 
RS 9000 Call In girls Dwarka Mor (DELHI)⇛9711147426🔝Delhi
RS 9000 Call In girls Dwarka Mor (DELHI)⇛9711147426🔝DelhiRS 9000 Call In girls Dwarka Mor (DELHI)⇛9711147426🔝Delhi
RS 9000 Call In girls Dwarka Mor (DELHI)⇛9711147426🔝Delhijennyeacort
 
Call Girls In Dwarka 9654467111 Escorts Service
Call Girls In Dwarka 9654467111 Escorts ServiceCall Girls In Dwarka 9654467111 Escorts Service
Call Girls In Dwarka 9654467111 Escorts ServiceSapana Sha
 
Call Girls in Defence Colony Delhi 💯Call Us 🔝8264348440🔝
Call Girls in Defence Colony Delhi 💯Call Us 🔝8264348440🔝Call Girls in Defence Colony Delhi 💯Call Us 🔝8264348440🔝
Call Girls in Defence Colony Delhi 💯Call Us 🔝8264348440🔝soniya singh
 
20240419 - Measurecamp Amsterdam - SAM.pdf
20240419 - Measurecamp Amsterdam - SAM.pdf20240419 - Measurecamp Amsterdam - SAM.pdf
20240419 - Measurecamp Amsterdam - SAM.pdfHuman37
 
RadioAdProWritingCinderellabyButleri.pdf
RadioAdProWritingCinderellabyButleri.pdfRadioAdProWritingCinderellabyButleri.pdf
RadioAdProWritingCinderellabyButleri.pdfgstagge
 
办理学位证中佛罗里达大学毕业证,UCF成绩单原版一比一
办理学位证中佛罗里达大学毕业证,UCF成绩单原版一比一办理学位证中佛罗里达大学毕业证,UCF成绩单原版一比一
办理学位证中佛罗里达大学毕业证,UCF成绩单原版一比一F sss
 
Call Us ➥97111√47426🤳Call Girls in Aerocity (Delhi NCR)
Call Us ➥97111√47426🤳Call Girls in Aerocity (Delhi NCR)Call Us ➥97111√47426🤳Call Girls in Aerocity (Delhi NCR)
Call Us ➥97111√47426🤳Call Girls in Aerocity (Delhi NCR)jennyeacort
 
毕业文凭制作#回国入职#diploma#degree澳洲中央昆士兰大学毕业证成绩单pdf电子版制作修改#毕业文凭制作#回国入职#diploma#degree
毕业文凭制作#回国入职#diploma#degree澳洲中央昆士兰大学毕业证成绩单pdf电子版制作修改#毕业文凭制作#回国入职#diploma#degree毕业文凭制作#回国入职#diploma#degree澳洲中央昆士兰大学毕业证成绩单pdf电子版制作修改#毕业文凭制作#回国入职#diploma#degree
毕业文凭制作#回国入职#diploma#degree澳洲中央昆士兰大学毕业证成绩单pdf电子版制作修改#毕业文凭制作#回国入职#diploma#degreeyuu sss
 
Industrialised data - the key to AI success.pdf
Industrialised data - the key to AI success.pdfIndustrialised data - the key to AI success.pdf
Industrialised data - the key to AI success.pdfLars Albertsson
 
How we prevented account sharing with MFA
How we prevented account sharing with MFAHow we prevented account sharing with MFA
How we prevented account sharing with MFAAndrei Kaleshka
 
Saket, (-DELHI )+91-9654467111-(=)CHEAP Call Girls in Escorts Service Saket C...
Saket, (-DELHI )+91-9654467111-(=)CHEAP Call Girls in Escorts Service Saket C...Saket, (-DELHI )+91-9654467111-(=)CHEAP Call Girls in Escorts Service Saket C...
Saket, (-DELHI )+91-9654467111-(=)CHEAP Call Girls in Escorts Service Saket C...Sapana Sha
 
Generative AI for Social Good at Open Data Science East 2024
Generative AI for Social Good at Open Data Science East 2024Generative AI for Social Good at Open Data Science East 2024
Generative AI for Social Good at Open Data Science East 2024Colleen Farrelly
 
专业一比一美国俄亥俄大学毕业证成绩单pdf电子版制作修改
专业一比一美国俄亥俄大学毕业证成绩单pdf电子版制作修改专业一比一美国俄亥俄大学毕业证成绩单pdf电子版制作修改
专业一比一美国俄亥俄大学毕业证成绩单pdf电子版制作修改yuu sss
 
DBA Basics: Getting Started with Performance Tuning.pdf
DBA Basics: Getting Started with Performance Tuning.pdfDBA Basics: Getting Started with Performance Tuning.pdf
DBA Basics: Getting Started with Performance Tuning.pdfJohn Sterrett
 
9711147426✨Call In girls Gurgaon Sector 31. SCO 25 escort service
9711147426✨Call In girls Gurgaon Sector 31. SCO 25 escort service9711147426✨Call In girls Gurgaon Sector 31. SCO 25 escort service
9711147426✨Call In girls Gurgaon Sector 31. SCO 25 escort servicejennyeacort
 
GA4 Without Cookies [Measure Camp AMS]
GA4 Without Cookies [Measure Camp AMS]GA4 Without Cookies [Measure Camp AMS]
GA4 Without Cookies [Measure Camp AMS]📊 Markus Baersch
 
办理(Vancouver毕业证书)加拿大温哥华岛大学毕业证成绩单原版一比一
办理(Vancouver毕业证书)加拿大温哥华岛大学毕业证成绩单原版一比一办理(Vancouver毕业证书)加拿大温哥华岛大学毕业证成绩单原版一比一
办理(Vancouver毕业证书)加拿大温哥华岛大学毕业证成绩单原版一比一F La
 

Recently uploaded (20)

Predicting Salary Using Data Science: A Comprehensive Analysis.pdf
Predicting Salary Using Data Science: A Comprehensive Analysis.pdfPredicting Salary Using Data Science: A Comprehensive Analysis.pdf
Predicting Salary Using Data Science: A Comprehensive Analysis.pdf
 
Consent & Privacy Signals on Google *Pixels* - MeasureCamp Amsterdam 2024
Consent & Privacy Signals on Google *Pixels* - MeasureCamp Amsterdam 2024Consent & Privacy Signals on Google *Pixels* - MeasureCamp Amsterdam 2024
Consent & Privacy Signals on Google *Pixels* - MeasureCamp Amsterdam 2024
 
E-Commerce Order PredictionShraddha Kamble.pptx
E-Commerce Order PredictionShraddha Kamble.pptxE-Commerce Order PredictionShraddha Kamble.pptx
E-Commerce Order PredictionShraddha Kamble.pptx
 
RS 9000 Call In girls Dwarka Mor (DELHI)⇛9711147426🔝Delhi
RS 9000 Call In girls Dwarka Mor (DELHI)⇛9711147426🔝DelhiRS 9000 Call In girls Dwarka Mor (DELHI)⇛9711147426🔝Delhi
RS 9000 Call In girls Dwarka Mor (DELHI)⇛9711147426🔝Delhi
 
Call Girls In Dwarka 9654467111 Escorts Service
Call Girls In Dwarka 9654467111 Escorts ServiceCall Girls In Dwarka 9654467111 Escorts Service
Call Girls In Dwarka 9654467111 Escorts Service
 
Call Girls in Defence Colony Delhi 💯Call Us 🔝8264348440🔝
Call Girls in Defence Colony Delhi 💯Call Us 🔝8264348440🔝Call Girls in Defence Colony Delhi 💯Call Us 🔝8264348440🔝
Call Girls in Defence Colony Delhi 💯Call Us 🔝8264348440🔝
 
20240419 - Measurecamp Amsterdam - SAM.pdf
20240419 - Measurecamp Amsterdam - SAM.pdf20240419 - Measurecamp Amsterdam - SAM.pdf
20240419 - Measurecamp Amsterdam - SAM.pdf
 
RadioAdProWritingCinderellabyButleri.pdf
RadioAdProWritingCinderellabyButleri.pdfRadioAdProWritingCinderellabyButleri.pdf
RadioAdProWritingCinderellabyButleri.pdf
 
办理学位证中佛罗里达大学毕业证,UCF成绩单原版一比一
办理学位证中佛罗里达大学毕业证,UCF成绩单原版一比一办理学位证中佛罗里达大学毕业证,UCF成绩单原版一比一
办理学位证中佛罗里达大学毕业证,UCF成绩单原版一比一
 
Call Us ➥97111√47426🤳Call Girls in Aerocity (Delhi NCR)
Call Us ➥97111√47426🤳Call Girls in Aerocity (Delhi NCR)Call Us ➥97111√47426🤳Call Girls in Aerocity (Delhi NCR)
Call Us ➥97111√47426🤳Call Girls in Aerocity (Delhi NCR)
 
毕业文凭制作#回国入职#diploma#degree澳洲中央昆士兰大学毕业证成绩单pdf电子版制作修改#毕业文凭制作#回国入职#diploma#degree
毕业文凭制作#回国入职#diploma#degree澳洲中央昆士兰大学毕业证成绩单pdf电子版制作修改#毕业文凭制作#回国入职#diploma#degree毕业文凭制作#回国入职#diploma#degree澳洲中央昆士兰大学毕业证成绩单pdf电子版制作修改#毕业文凭制作#回国入职#diploma#degree
毕业文凭制作#回国入职#diploma#degree澳洲中央昆士兰大学毕业证成绩单pdf电子版制作修改#毕业文凭制作#回国入职#diploma#degree
 
Industrialised data - the key to AI success.pdf
Industrialised data - the key to AI success.pdfIndustrialised data - the key to AI success.pdf
Industrialised data - the key to AI success.pdf
 
How we prevented account sharing with MFA
How we prevented account sharing with MFAHow we prevented account sharing with MFA
How we prevented account sharing with MFA
 
Saket, (-DELHI )+91-9654467111-(=)CHEAP Call Girls in Escorts Service Saket C...
Saket, (-DELHI )+91-9654467111-(=)CHEAP Call Girls in Escorts Service Saket C...Saket, (-DELHI )+91-9654467111-(=)CHEAP Call Girls in Escorts Service Saket C...
Saket, (-DELHI )+91-9654467111-(=)CHEAP Call Girls in Escorts Service Saket C...
 
Generative AI for Social Good at Open Data Science East 2024
Generative AI for Social Good at Open Data Science East 2024Generative AI for Social Good at Open Data Science East 2024
Generative AI for Social Good at Open Data Science East 2024
 
专业一比一美国俄亥俄大学毕业证成绩单pdf电子版制作修改
专业一比一美国俄亥俄大学毕业证成绩单pdf电子版制作修改专业一比一美国俄亥俄大学毕业证成绩单pdf电子版制作修改
专业一比一美国俄亥俄大学毕业证成绩单pdf电子版制作修改
 
DBA Basics: Getting Started with Performance Tuning.pdf
DBA Basics: Getting Started with Performance Tuning.pdfDBA Basics: Getting Started with Performance Tuning.pdf
DBA Basics: Getting Started with Performance Tuning.pdf
 
9711147426✨Call In girls Gurgaon Sector 31. SCO 25 escort service
9711147426✨Call In girls Gurgaon Sector 31. SCO 25 escort service9711147426✨Call In girls Gurgaon Sector 31. SCO 25 escort service
9711147426✨Call In girls Gurgaon Sector 31. SCO 25 escort service
 
GA4 Without Cookies [Measure Camp AMS]
GA4 Without Cookies [Measure Camp AMS]GA4 Without Cookies [Measure Camp AMS]
GA4 Without Cookies [Measure Camp AMS]
 
办理(Vancouver毕业证书)加拿大温哥华岛大学毕业证成绩单原版一比一
办理(Vancouver毕业证书)加拿大温哥华岛大学毕业证成绩单原版一比一办理(Vancouver毕业证书)加拿大温哥华岛大学毕业证成绩单原版一比一
办理(Vancouver毕业证书)加拿大温哥华岛大学毕业证成绩单原版一比一
 

Obesity Correlation Study and Linear Classifier Performance Analysis with other Health factors from CDC and Census Tract Data Merge for USA Urban Population

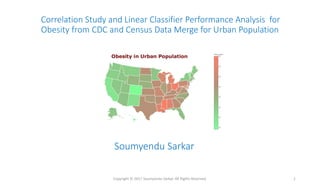
  • 1. Correlation Study and Linear Classifier Performance Analysis for Obesity from CDC and Census Data Merge for Urban Population Copyright © 2017 Soumyendu Sarkar. All Rights Reserved. 1 Soumyendu Sarkar
  • 2. States with Lowest and Highest Obesity in Cities Copyright © 2017 Soumyendu Sarkar. All Rights Reserved. 2 Rank State State BMI 1 DE Delaware 32.0 2 MS Mississippi 31.7 3 OH Ohio 31.1 4 MI Michigan 29.6 5 AL Alabama 29.3 6 LA Louisiana 29.2 7 MD Maryland 28.8 8 WI Wisconsin 28.4 9 IN Indiana 27.9 10 PA Pennsylvania 27.5 11 WV West Virginia 27.5 12 MO Missouri 27.4 13 TN Tennessee 27.0 14 GA Georgia 26.6 15 IA Iowa 26.5 16 NJ New Jersey 26.4 17 AR Arkansas 26.3 18 ND North Dakota 26.3 19 KS Kansas 26.3 20 TX Texas 26.2 21 KY Kentucky 26.2 22 VA Virginia 25.9 23 SC South Carolina 25.7 24 OK Oklahoma 25.5 25 IL Illinois 25.2 Rank State State BMI 1 CO Colorado 17.7 2 HI Hawaii 17.7 3 VT Vermont 18.5 4 CA California 19.6 5 NM New Mexico 20.2 6 MT Montana 21.6 7 OR Oregon 21.6 8 ME Maine 21.8 9 NY New York 21.8 10 WA Washington 21.9 11 NV Nevada 22.0 12 AK Alaska 22.3 13 MN Minnesota 22.3 14 ID Idaho 22.3 15 UT Utah 22.6 16 AZ Arizona 22.7 17 FL Florida 22.8 18 MA Massachusetts 22.8 19 RI Rhode Island 23.5 20 WY Wyoming 23.7 21 NE Nebraska 23.9 22 SD South Dakota 24.0 23 NH New Hampshire 24.5 24 NC North Carolina 24.5 25 CT Connecticut 25.0
  • 3. Healthy Cities with Least Obesity Rank City State BMI 1 Milpitas CA 12.2 2 Fremont CA 12.9 3 Irvine CA 13.4 4 Union City CA 13.6 5 Daly City CA 13.9 6 Westminster CA 13.9 7 Alhambra CA 14.2 8 Boulder CO 14.3 9 Longmont CO 14.3 10 Sunnyvale CA 14.5 11 Torrance CA 14.5 12 Pleasanton CA 14.8 13 Garden Grove CA 15 14 Chino Hills CA 15.1 15 Santa Clara CA 15.1 16 Mission Viejo CA 15.5 17 Newport Beach CA 15.5 18 San Francisco CA 15.5 19 Alameda CA 15.6 20 Lake Forest CA 15.6 Rank City State BMI 21 Lake Forest CA 15.6 22 Santa Fe NM 15.6 23 Huntington Beach CA 15.8 24 Loveland CO 15.8 25 Arvada CO 15.9 26 Buena Park CA 15.9 27 Denver CO 15.9 28 Mountain View CA 16 29 Bellevue WA 16.3 30 Centennial CO 16.3 31 Fullerton CA 16.3 32 Tustin CA 16.3 33 San Jose CA 16.4 34 Fort Collins CO 16.5 35 Redondo Beach CA 16.5 36 Johns Creek GA 16.6 37 Lakewood CO 16.6 38 San Leandro CA 16.7 39 Livermore CA 16.9 40 San Ramon CA 16.9 Rank City State BMI 41 Thousand Oaks CA 16.9 42 Carlsbad CA 17 43 Orange CA 17 44 Simi Valley CA 17 45 Sparks NV 17.3 46 West Covina CA 17.3 47 Boca Raton FL 17.4 48 San Mateo CA 17.4 49 Schaumburg IL 17.4 50 Lakewood CA 17.5 51 Burbank CA 17.7 52 Costa Mesa CA 17.7 53 Honolulu HI 17.7 54 Sugar Land TX 17.7 55 Westminster CO 17.7 56 Quincy MA 17.8 57 Reno NV 17.8 58 Santa Monica CA 17.8 59 Anaheim CA 17.9 60 Elk Grove CA 17.9 Rank City State BMI 61 Folsom CA 17.9 62 Plymouth MN 17.9 63 Glendale CA 18 64 San Diego CA 18 65 Santa Clarita CA 18 66 Arlington Heights IL 18.1 67 Newton MA 18.2 68 Roseville CA 18.2 69 Santa Rosa CA 18.2 70 Cary NC 18.3 71 Rancho Cucamonga CA 18.3 72 Berkeley CA 18.4 73 Hayward CA 18.4 74 Burlington VT 18.5 75 Chula Vista CA 18.6 76 Clovis CA 18.6 77 San Marcos CA 18.6 78 Colorado Springs CO 18.7 79 Redlands CA 18.7 80 San Buenaventura CA 18.7 Copyright © 2017 Soumyendu Sarkar. All Rights Reserved. 3
  • 4. Cities with Highest Obesity Rank City State BMI 1 Dayton OH 38.8 2 Gary IN 38.2 3 Detroit MI 36.4 4 Youngstown OH 35.1 5 Macon GA 34.7 6 Kalamazoo MI 34.5 7 Flint MI 34.1 8 Cleveland OH 33.8 9 Jackson MS 33.3 10 Toledo OH 33.2 11 Camden NJ 33.1 12 Reading PA 32.6 13 Albany GA 32.4 14 Wilmington DE 32 15 Tuscaloosa AL 31.8 16 Birmingham AL 31.7 17 Milwaukee WI 31.6 18 Brownsville TX 31.5 19 Rochester NY 31.3 20 Portsmouth VA 31.1 Rank City State BMI 21 Pharr TX 30.9 22 Mobile AL 30.8 23 Southfield MI 30.8 24 Hampton VA 30.7 25 Trenton NJ 30.7 26 Canton OH 30.6 27 Hartford CT 30.4 28 St. Louis MO 30.4 29 Baton Rouge LA 30.3 30 Kansas City KS 30.3 31 Laredo TX 30.3 32 Beaumont TX 30.2 33 Montgomery AL 30.2 34 Rockford IL 30.1 35 South Bend IN 30.1 36 Akron OH 30 37 Cincinnati OH 30 38 Shreveport LA 30 39 Corpus Christi TX 29.9 40 Lake Charles LA 29.7 Rank City State BMI 41 Hammond IN 29.5 42 Kenner LA 29.5 43 Newark NJ 29.5 44 Buffalo NY 29.4 45 Racine WI 29.4 46 Lansing MI 29.3 47 Memphis TN 29.3 48 Muncie IN 29.3 49 Edinburg TX 29.2 50 Savannah GA 29.1 51 Springfield MO 29.1 52 Paterson NJ 29 53 Waco TX 29 54 Allentown PA 28.8 55 Augusta GA 28.8 56 Baltimore MD 28.8 57 Columbus OH 28.8 58 New Haven CT 28.8 59 Erie PA 28.7 60 Grand Rapids MI 28.7 Rank City State BMI 61 McAllen TX 28.6 62 Winston-Salem NC 28.6 63 Columbia SC 28.5 64 Kansas City MO 28.5 65 Longview TX 28.5 66 Brockton MA 28.4 67 Chattanooga TN 28.4 68 Mission TX 28.4 69 Fort Smith AR 28.3 70 Indianapolis IN 28.3 71 Kenosha WI 28.3 72 Lawton OK 28.3 73 New Orleans LA 28.3 74 Topeka KS 28.3 75 Decatur IL 28.2 76 El Paso TX 28.2 77 North Charleston SC 28.2 78 Sioux City IA 28.2 79 Tyler TX 28.2 80 Fayetteville NC 28.1 Copyright © 2017 Soumyendu Sarkar. All Rights Reserved. 4
  • 5. Linear Classifier for Obesity Classification Methods Merge Census Tract County data with CDC 500 cities data with population weights to augment feature set Correlation Analysis of Features from Census data with Obesity and include Top 30 Features for classification Obtain 400 Training & 100 Test Feature vectors with shuffling from 500 cities database to remove bias Implement Linear Classifier with Squared and Cubed Non-Linear terms to enhanced accuracy and use data normalization to optimize performance Implement Principal Component Analysis for Obesity Classification BMI Class Definition: Healthy : BMI < 20 Average : 20 >= BMI < 27 Obese : BMI >= 27 Linear Classifier with Normalized SQUARED Terms with 30 features Training Testing Accuracy 0.88 0.84 Highest PPV 0.95 1.00 Lowest PPV 0.86 0.77 PPV for Healthy Classification 0.95 0.89 PPV for Average Classification 0.86 0.77 PPV for Obese Classification 0.87 1.00 Linear Classifier with Normalized CUBED and Squared Terms with 30 features Training Testing Accuracy 0.91 0.80 Highest PPV 1.00 1.00 Lowest PPV 0.88 0.73 PPV for Healthy Classification 0.97 0.85 PPV for Average Classification 0.88 0.73 PPV for Obese Classification 0.90 1.00 Over-Fitting ? Objective Use Linear Classification and Principal Component Analysis to implement a Machine Learning Model to Classify Obesity from CDC data for 500 cities and Census Tract & County data Research on Variation of Classification Performance with variation of feature set Research on Classification Performance with additional non-linear terms in Linear Classification Copyright © 2017 Soumyendu Sarkar. All Rights Reserved. 5
  • 6. CDC & Census Data Correlation Analysis with Obesity Copyright © 2017 Soumyendu Sarkar. All Rights Reserved. 6
  • 7. Feature Correlation with Obesity Rank FEATURE CORRELATION 1 Teeth Loss 0.8136687437263442 2 Smoking 0.7782953004281681 3 Low Physical Activity 0.7088155129076699 4 Stroke 0.6884054217581411 5 COPD 0.6520786256266082 6 Dental Visit -0.651864343360142 7 High Blood Pressure 0.6514067957254205 8 Asthma 0.6476837471816237 9 Diabetes 0.6450348353789633 10 Poor Mental Health 0.6341907564608653 11 Poor Physical Health 0.6029283356020563 12 Adults % with high school diploma 0.5760699676500974 13 Less Sleep 0.5680532130394792 14 Asian female population -0.5633977183347055 15 Asian male population -0.5517973396661352 16 Arthritis 0.5202128697892304 17 Coronary Heart Disease 0.5150142669268579 18 No Health Insurance 0.5044810771017083 19 Median_Household_income_2015 -0.49924542549151063 20 Chronic Kidney Disease 0.49136753647522907 21 Taking BP Medication 0.4835522676520599 22 Pap Smear Test -0.40802112000662577 23 Colorectal Cancer Screening -0.40387566366546335 24 African American male population 0.3782030479176095 Rank FEATURE CORRELATION 25 Adults % bachelor's degree or higher -0.37409617528765426 26 African American female population 0.37191965521328857 27 Percent of people in poverty 0.3375526128971053 28 Cholesterol Screening -0.3372678541648043 29 Total population -0.3245786518713684 30 Annual Checkup 0.29761058387099665 31 Mammography -0.2854508003727619 32 % of People in poverty -0.2701119883267754 33 High Cholesterol 0.25805175528402285 34 Pacific Islander Female population -0.25486328530053304 35 Pacific Islander Male population -0.2475011132522548 36 Binge Drinking -0.2354599926965364 37 Total male population -0.22279697497623033 38 Total female population 0.2227969749762296 39 Preventive services for older women -0.217631636493823 40 American Indian and Alaskan Male population -0.1733907182844397 41 American Indian and Alaskan Female population -0.16113420140074838 42 Cancer (except skin) -0.1259704222265354 43 Adults % with college or associate's degree 0.11066137961902359 44 Unemployment_rate_2014 0.0722820170201452 45 Preventive services for older men -0.03667305959706792 46 adults % with NO high school diploma 0.0029059468315383538 47 White female population 0.002221613640036274 48 White male population -0.0015587877326375108 Copyright © 2017 Soumyendu Sarkar. All Rights Reserved. 7
  • 8. Linear Classifier (Training) The number of features were varied from 2 to 30 for the Classifier Both Square and Cube Non-Linear functions were added in addition to feature terms Observations Accuracy and PPV goes up with inclusions of more FEATURES Accuracy and PPV goes up with inclusions of non- linear SQUARED terms of Feature values Accuracy and PPV goes up FURTHER with inclusions of non-linear CUBED and SQUARED terms of Feature values Normalization of features improves performance when non-linear functions specially Cubes and also Squares are included in Linear Classifier How TRAINING Accuracy and PPV varies with ? Number of Features Non-Linear Functions Copyright © 2017 Soumyendu Sarkar. All Rights Reserved. 8
  • 9. Linear Classifier (Testing) The number of features were varied from 2 to 30 for the Classifier Both Square and Cube Non-Linear functions were added in addition to feature terms Observations Accuracy and PPV goes up with inclusions of more FEATURES Accuracy and PPV goes up with inclusions of non-linear SQUARED terms of Feature values Accuracy and PPV goes up FURTHER with inclusions of non-linear CUBED and SQUARED terms with lower number of Features, but then goes lower than that of LC with SQUARED terms with inclusion of more features. This is likely due to OVER-FITTING Normalization of features improves performance when non-linear functions specially Cubes and also Squares are included in Linear Classifier How TESTING Accuracy and PPV varies with ? Number of Features Non-Linear Functions Copyright © 2017 Soumyendu Sarkar. All Rights Reserved. 9
  • 10. Linear Classifier Testing VS Training Classification Performance Accuracy of classification of Testing is less than that of Training but mostly within 5% for all three classifiers for the range of number of features Obesity classification PPV is more for Testing than that of Training and reaches 100% when more number of features are included specially with non-linear Squared and Cubed terms Average BMI classification PPV is less for Testing than that of Training Even though classification performance for test data is significantly better with non-linear Squared terms in the Linear Classifier, inclusion of Cubed terms does not significantly help classification with Test data performance Copyright © 2017 Soumyendu Sarkar. All Rights Reserved. 10
  • 11. Distribution of Urban Health Factors by States Copyright © 2017 Soumyendu Sarkar. All Rights Reserved. 11 Smoking 100% Adult Teeth Loss for 65 years old or older Low Physical Activity Stroke
  • 12. Distribution of Urban Health Factors by States Copyright © 2017 Soumyendu Sarkar. All Rights Reserved. 12 High Blood Pressure Asthma Diabetes Poor Physical Health
  • 13. Distribution of Urban Health Factors by States Copyright © 2017 Soumyendu Sarkar. All Rights Reserved. 13 Diabetes No Health InsuranceCoronary Heart DiseaseArthritis Less Sleep
  • 14. Distribution of Urban Health Factors by States Copyright © 2017 Soumyendu Sarkar. All Rights Reserved. 14 Cancer – Poorly CorrelatedCholesterol ScreeningChronic Kidney Disorder
  • 15. References & Acknowledgements • Overweight & Obesity - https://www.cdc.gov/obesity/data/adult.html • 500 Cities: Local Data for Better Health - https://www.cdc.gov/500cities/ • Chronic Disease and Health Promotion Data & Indicators - https://chronicdata.cdc.gov/health- area/nutrition-physicalactivity-obesity • Population Estimates, Unemployment, Education - https://www.census.gov/data.html • Special thanks to Hakan Egeli for identifying and collecting some of the CDC and Census Data Copyright © 2017 Soumyendu Sarkar. All Rights Reserved. 15