Benedict Evans
•
11 likes•1,127 views

Benedict Evans, Enders Analysis, keynote presentation at Mobile Media Strategies 2012
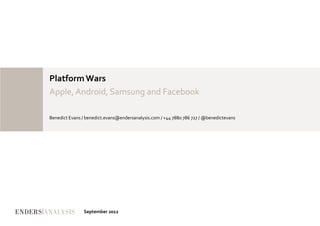
![Growth,
for
some
Quarterly
smartphone
unit
sales
(m)
Handset
revenue
($bn)
90
20
80
18
70
16
14
60
12
50
10
40
8
30
6
20
4
10
2
0
0
Feb-‐2008
Mar-‐2009
May-‐2010
Jun-‐2011
Jul-‐2012
iPhone
Android
Symbian
RIM
Windows
Phone
[Source:
Companies,
Enders
Analysis]
Q2
2011
Q2
2012
[Source:
Companies,
Enders
Analysis]
Platform
Wars,
September
2012
2](data:image/gif;base64,R0lGODlhAQABAIAAAAAAAP///yH5BAEAAAAALAAAAAABAAEAAAIBRAA7)
Recommended
More Related Content
More from Briefing Media
More from Briefing Media (20)
Recently uploaded
Recently uploaded (20)
Benedict Evans
- 1. Platform Wars Apple, Android, Samsung and Facebook Benedict Evans / benedict.evans@endersanalysis.com / +44 7880 786 727 / @benedictevans September 2012
- 2. Growth, for some Quarterly smartphone unit sales (m) Handset revenue ($bn) 90 20 80 18 70 16 14 60 12 50 10 40 8 30 6 20 4 10 2 0 0 Feb-‐2008 Mar-‐2009 May-‐2010 Jun-‐2011 Jul-‐2012 iPhone Android Symbian RIM Windows Phone [Source: Companies, Enders Analysis] Q2 2011 Q2 2012 [Source: Companies, Enders Analysis] Platform Wars, September 2012 2
- 3. Polarisation Q2 2012 global mobile handset business Q2 2012 global smartphone business 160 60 All other Android 140 Other non-‐ smart 50 Samsung 120 Android iPhone 40 Units shipped (m) Units shipped (m) 100 Nokia Samsung 80 30 60 iPhone 20 Other Nokia smart 40 Android RIM 10 Sony 20 Moto HTC LG 0 0 RIM 0 100 200 300 400 500 600 700 0 100 200 300 400 500 600 700 ASP ($) ASP ($) Bubble size = revenue [Source: Companies, Enders Analysis] Bubble size = revenue [Source: Companies, Enders Analysis] Platform Wars, September 2012 3
- 4. Platform scale: 810m cumulative iOS & Android sales, 675m users Cumulative activations (m) Active installed base, Q2 2012 (m) 700 450 410 610 400 374 600 480 530 350 500 307 300 400 410 250 300 200 180 200 150 100 100 50 0 0 iOS Android Facebook Amazon mobile apps Phones iPod Touch Tablets Active users iOS Android [Source: Apple, Facebook, Amazon, Enders Analysis] [Source: Apple, Google, Enders Analysis] Platform Wars, September 2012 4
- 5. The iOS app store: 5 apps downloaded and $1 spent per live device per month iOS app store growth iOS app store trends per live device 35 25 7 30 30 6 20 25 5 13.9 15 20 4 15 3 10 10 2 2.8 7.9 5 5 1 0 0 0 Jul-‐08 Dec-‐08 Jun-‐09 Dec-‐09 Jun-‐10 Dec-‐10 Jun-‐11 Dec-‐11 Jun-‐12 Dec-‐12 Sep-‐10 Dec-‐10 Mar-‐11 Jun-‐11 Sep-‐11 Dec-‐11 Mar-‐12 Jun-‐12 Cumulative Downloads (bn) Cumulative Gross App revenue ($bn) Downloads per live device $ Gross App Revenue per device (RH scale) [Source: Apple] [Source: Enders Analysis] Platform Wars, September 2012 5
- 6. Facebook Mobile: bigger than iOS or Android, but latent as a platform Facebook user base (m) Mobile as % total Facebook active users, 8/2012 1,200 80% 70% 1,000 12% 8% 60% 800 10% 412 50% 12% 48% 420 13% 600 450 40% 136 40% 30% 56% 59% 400 28% 109 48% 19% 101 20% 42% 35% 200 407 316 10% 22% 249 13% 14% 15% 0 0% Sep-‐11 Dec-‐11 Jun-‐12 Using apps Using mobile web Not using mobile Smartphone [Source: Facebook, Enders Analysis] Other mobile [Source: Facebook] Platform Wars, September 2012 6
- 7. UK device penetration Share of UK adult mobile users 100% 5% 8% 90% 10% 10% 80% 13% 16% 70% 9% 60% 20% 50% 40% 30% 60% 48% 20% 10% 0% Apr-‐11 Apr-‐12 Basic Android [Source: Enders Analysis/TNS-‐RI survey April 2012] Platform Wars, September 2012 7
- 8. UK smartphone ownership profiles Smartphone user breakdown: social grade Smartphone user breakdown: age 100% 4% 100% 3% 13% 12% 15% 10% 12% 10% 23% 26% 32% 13% 18% 80% 17% 16% 80% 16% 23% 16% 60% 60% 34% 32% 37% 44% 45% 41% 24% 44% 40% 46% 40% 20% 42% 20% 42% 33% 31% 35% 28% 27% 17% 21% 0% 0% AB C1 C2 DE 16-‐24 25-‐34 35-‐44 45-‐54 55+ iPhone Android BlackBerry Nokia iPhone Android BlackBerry Nokia [Source: Enders Analysis/TNS-‐RI survey April 2012] [Source: Enders Analysis/TNS-‐RI survey April 2012] Platform Wars, September 2012 8
- 9. UK tablets – 7-‐10m by the new year Tablet ownership and interest 50% 40% 37% 30% 30% 15% 18% 20% 7% 10% 6% 15% 6% 0% Apr-‐11 Apr-‐12 Already own Very interested Quite interested [Source: Enders Analysis/TNS-‐RI survey April 2012] Platform Wars, September 2012 9
- 10. Apps and the web Main method of viewing online content on device 100% 6% 7% 15% 31% 80% 27% 34% 27% 59% 60% 18% 23% 19% 16% 11% 40% 16% 0% 20% 45% 40% 43% 40% 25% 0% Tablet iPhone Android BlackBerry Nokia smartphone Websites Apps Do both about equal Do not view online content [Source: Enders Analysis/TNS-‐RI survey 2012] Platform Wars, September 2012 10
- 11. Tablets – still iPad only US tablet unit sales (000s) 7,000 5,967 6,000 5,000 4,460 4,293 4,000 3,795 3,597 3,000 2,294 1,969 1,914 2,000 1,000 262 266 293 347 156 77 0 Jun-‐10 Sep-‐10 Dec-‐10 Mar-‐11 Jun-‐11 Sep-‐11 Dec-‐11 Mar-‐12 Apple Samsung [Source: Apple, Samsung] Platform Wars, September 2012 11
- 12. Tablets: getting much cheaper Apple and Amazon tablet positioning ($) 700 600 500 400 300 630 500 500 506 200 400 300 300 100 200 160 0 Fire Fire HD Fire HD 9" iPad Mini? iPad 2 Fire HD 9" iPad 3 Wifi iPad ASP iPad 3 LTE Cellular Amazon Apple [Source: Enders Analysis] Platform Wars, September 2012 12
- 13. UK Magazines B2C magazines consumer and advertiser expenditure (£m) 3,000 2,500 2,000 1,500 1,000 500 0 Current prices Consumer expenditure Advertising expenditure [Source: Enders Analysis based on ABC and WARC data] Platform Wars, September 2012 13
- 14. Reading on the iPad Do you read newspapers and magazines on your tablet? 50% 45% 44% 40% 9% Yes, and I did not read the print 12% versions previously 30% 15% Yes, and I read the print versions 12% the same amount or more than before 20% Yes, and I read the print versions less frequently as a consequence 10% 21% 20% 0% Apr-‐11 Apr-‐12 Base: those who currently own a tablet [Source: Enders Analysis/TNS-‐RI survey April 2012] Platform Wars, September 2012 14
- 15. Tablet magazines: a mixed picture Hearst USA tablet magazine sales, 2012 Fire 15% iPad 35% Zinio 20% Nook 30% [Source: Hearst] Platform Wars, September 2012 15
- 16. Solipsism Apple should remake the TV ISPs should subsidise newspapers Tablets will save magazines industry Google steals our content Facebook destroys local Apple will destroy Amazon Platform Wars, September 2012 16
- 17. Distribution Platform Wars, September 2012 17
- 18. Disclaimer Important notice: By accepting this research note, the recipient agrees to be bound by the following terms of use. This research note has been prepared by Enders Analysis Limited and published solely for guidance and general informational purposes. It may contain the personal opinions of research analysts’ based on research undertaken. This note has no regard to any specific recipient, including but not limited to any specific investment objectives, and should not be relied on by any recipient for investment or any other purposes. Enders Analysis Limited gives no undertaking to provide the recipient with access to any additional information or to update or keep current any information or opinions contained herein. The information and any opinions contained herein are based on sources believed to be reliable but the information relied on has not been independently verified. Enders Analysis Limited, its officers, employees and agents make no warranties or representations, express or implied, as to the accuracy or completeness of information and opinions contained herein and exclude all liability to the fullest extent permitted by law for any direct or indirect loss or damage or any other costs or expenses of any kind which may arise directly or indirectly out of the use of this note, including but not limited to anything caused by any viruses or any failures in computer transmission. The recipient hereby indemnifies Enders Analysis Limited, its officers, employees and agents and any entity which directly or indirectly controls, is controlled by, or is under direct or indirect common control with Enders Analysis Limited from time to time, against any direct or indirect loss or damage or any other costs or expenses of any kind which they may incur directly or indirectly as a result of the recipient’s use of this note. © 2012 Enders Analysis Limited. All rights reserved. No part of this note may be reproduced or distributed in any manner including, but not limited to, via the internet, without the prior permission of Enders Analysis Limited. If you have not received this note directly from Enders Analysis Limited, your receipt is unauthorised. Please return this note to Enders Analysis Limited immediately. Platform Wars, September 2012 18