SlideShare a Scribd company logo
1 of 84
Download to read offline
by Martha Alter Chen
April 2014
IEMSInformal Economy
Monitoring StudyIEMSInformal Economy
Monitoring Study
Informal Economy Monitoring Study
Sector Report: Home-Based Workers
Informal Economy Monitoring Study Sector Report:
Home-Based Workers
Author
Martha (Marty) Alter Chen is a co-founder and the International Coordinator of WIEGO, as well as a Lecturer
in Public Policy at the Harvard Kennedy School, and an Affiliated Professor at the Harvard Graduate School of
Design. An experienced development practitioner and scholar, Marty’s areas of specialization are employment,
gender, and poverty with a focus on the working poor in the informal economy.
Acknowledgements
Special thanks are due to the local research partners and research teams in each city whose knowledge of home-
based workers and their respective cities were so critical to the success of the Informal Economy Monitoring Study.
In Ahmedabad, the research partner was the Self-Employed Women’s Association (SEWA). Manali Shah, Mansi
Shah, and Shalini Trivedi from the SEWA Union coordinated the study. The local research team from CEPT
University were Darshini Mahadevia, Aseem Mishra, and Suchita Vyas.
In Bangkok, the research partner was HomeNet Thailand. Suanmuang (Poonsap) Tulaphan of HomeNet
Thailand coordinated the research and served as one of the qualitative researchers and MBO representatives.
The local research team consisted of Sayamol Charoenratan, Amornrat Kaewsing, Boonsom Namsomboon,
Chidchanok Samantrakul, and Suanmuang Tulaphan.
In Lahore, the research partner was HomeNet Pakistan, represented by Ume-Laila Azhar who coordinated the
research. The local research team were Bilal Naqeeb, Rubina Saigol, Kishwar Sultana, and Reema Kamal.
Special thanks are also due to Caroline Moser, Angélica Acosta, and Irene Vance who helped design the
qualitative tools and train the local research teams.
Thanks are also due to the WIEGO team members who served on the IEMS Technical Advisory Committee (TAC)
during Years 1 and 2 of the study: Marty Chen (IEMS TAC Chair), Imraan Valodia (IEMS Director), Sally Roever
(IEMS Qualitative Research Coordinator), Michael Rogan (IEMS Quantitative Research Coordinator), and Zoe
Horn (IEMS MBO Coordinator) as well as Sonia Dias, Rhonda Douglas, Francie Lund, Melanie Samson, Shalini
Sinha, and Caroline Skinner. Marty Chen, Zoe Horn, and Imraan Valodia provided special oversight to the field
research and data analysis in Ahmedabad, Bangkok and Lahore, respectively.
Thanks are also due to Leslie Vryenhoek, WIEGO’s editor, who so ably edited 13 IEMS City Reports and the
three IEMS Sector Reports, including this report, and prepared advocacy materials based on each report. Thanks
also to Demetria Tsoutouras who oversaw the production of the reports, to Olga Abizaid who edited the three
Latin American reports and prepared the advocacy materials based on these, and to other members of the
Communications Team involved in all the stages of production.
Last, but hardly least, special thanks are due to the home-based workers in Ahmedabad, Bangkok, and Lahore,
who opened their lives and work to the research team.
Publication date: April 2014
ISBN number: 978-92-95095-82-3
Published by Women in Informal Employment: Globalizing and Organizing (WIEGO). A Charitable Company
Limited by Guarantee – Company No. 6273538, Registered Charity No. 1143510
WIEGO Secretariat	 WIEGO Limited
Harvard University	 521 Royal Exchange
79 John F. Kennedy Street	 Manchester M2 7EN
Cambridge, MA 02138, USA	 United Kingdom
www.wiego.org
Copyright © WIEGO. This report can be replicated for educational, organizing and policy purposes as long as the
source is acknowledged.
Full citation: Chen, Martha Alter. 2014. Informal Economy Monitoring Study Sector Report: Home-Based Workers.
Cambridge, MA, USA: WIEGO.
Cover photographs by: HomeNet Pakistan, Ms. Supranee Tubsakul, Martha Chen
Design by: Julian Luckham of Luckham Creative
About the Informal Economy
Monitoring Study
The Informal Economy Monitoring Study (IEMS) is a major, longitudinal study of the urban informal
economy being undertaken initially at two points in time, 2012 and 2016, in 10 cities around the
world: Accra, Ghana; Ahmedabad, India; Bangkok, Thailand; Belo Horizonte, Brazil; Bogota,
Colombia; Durban, South Africa; Lahore, Pakistan; Lima, Peru; Nakuru, Kenya; and Pune, India. The
study combines qualitative and quantitative research methods to provide an in-depth understanding
of how three groups of urban informal workers – home-based workers, street vendors, and waste
pickers – are affected by and respond to economic trends, urban policies and practices, value chain
dynamics, and other economic and social forces. The IEMS will generate panel data on the urban
informal economy.
In each city, a team of five researchers worked in collaboration with a local membership-based
organization of informal workers from April 2012 to April 2013 to collect and analyze the first round
of the data.
All city research reports, as well as sector reports (one each for home-based work, street
vending and waste picking), a global report, and other information on the study can be found at
www.inclusivecities.org and www.wiego.org.
iv IEMS Informal Economy Monitoring Study
Table of Contents
Executive Summary	 1
Key Findings	 1
Theoretical & Policy Implications	 3
Introduction	 5
Home-Based Workers	 5
IEMS Study	 6
Report Structure	 8
Part 1: Individual, Household & Enterprise Characteristics	 9
1.1 Home-Based Workers	 9
1.2 Households of Home-Based Workers	 10
1.3 Enterprises of Home-Based Workers	 13
	 1.3.1 Product Categories	 13
	 1.3.2 Type & Structure of Enterprises	 14
	 1.3.3 Market Transactions 	 16
	 1.3.4 Seasonality	 17
	 1.3.5 Piece Rates & Earnings	 18
Part 2: Drivers & Responses	 25
2.1 Drivers 		 27
	 2.1.1 Macroeconomic Trends	 27
	 2.1.2 Government Policies & Practices	 34
	 2.1.3 Value Chain Dynamics	 47
2.2 Responses	 56
Part 3: Institutions, Linkages & Contributions	 59
3.1 Mediating Institutions	 59
	 3.1.1 Membership-Based Organizations (MBOs)	 60
	 3.1.2 Welfare Boards 	 62
	 3.1.3 Local Government 	 62
3.2 Production Linkages	 63
3.3 Economic & Social Contributions 	 64
	 3.3.1 Contributions to Family 	 64
	 3.3.2 Contributions to Consumers 	 64
	 3.3.3 Contributions to Society	 65
	 3.3.4 Contributions to the Environment	 65
	 3.3.5 Contributions to the Economy 	 65
	 3.3.6 Contributions to Taxes	 66
Part 4: Key Findings, Theoretical Lessons & Policy Implications	 69
4.1 Key Findings	 69
	 4.1.1 Driving Forces	 69
	 4.1.2 Responses & Institutions 	 70
4.2 Theoretical Lessons	 71
	 4.2.1 Women and Home-Based Work 	 71
	 4.2.2 Self-Employment & Wage Employment 	 71
	 4.2.3 Informal Economy 	 73
4.3 Policy Implications	 74
Cited References	 75
vIEMS Sector Report: Home-Based Workers
List of Tables
Table 1. Sample by Status in Employment (% distribution)	 10
Table 2. Formal Source of Household Income & Secondary Source of Individual Income
of Self-Employed and Sub-Contracted (%)	 11
Table 3. Main Source of Household Income, Formal or Informal,
of Self-Employed and Sub-Contracted (% distribution)	 11
Table 4. Piece Rates, Daily Output, and Daily Gross Earnings Reported
by Sub-Contracted Garment Makers, by City	 18
Table 5. Piece Rates, Daily Output, and Daily Gross Earnings Reported
by Sub-Contracted Non-Garment Makers, by City	 20
Table 6. Range of Gross Daily Earnings Reported by Sub-Contracted Home-Based Workers,
by Product Type and City (USD) 	 21
Table 7. Median Net Monthly Earnings and Work-Related Expenditures by City	 22
Table 8. Levels of Net Monthly Earnings, by City (% distribution)	 22
Table 9. Levels of Net Monthly Earnings by Self-Employed and Sub-Contracted
in Bangkok and Lahore (% distribution)	 22
Table 10. City-Level Earnings Distribution by Status in Employment and Product Type (%)	 23
Table 11. Median Net Monthly Earnings (unadjusted USD) and Percentage in the
Poorest Earnings Quintile by Status in Employment, Age, and Marital Status	 23
Table 12. Ranking of Three Sets of Driving Forces as Negative (-) or Positive (+)
by City (# of Focus Groups)	 26
Table 13. Key Driving Forces by Self-Employed and Sub-Contracted (%)	 26
Table 14. GDP Growth Rate and Inflation: India, Pakistan & Thailand 2007-2012	 28
Table 15. Wider Economy: Negative and Positive Driving Forces by City (# of focus groups)	 28
Table 16. Problems with Orders and Payments of Self-Employed and Sub-Contracted (%)	 31
Table 17. Degree of Competition within Same Trade of Self-Employed and Sub-Contracted (%)	 31
Table 18. Government Policies & Practices: Negative and Positive Rankings by City
(# of focus groups)	 35
Table 19. Value Chain Dynamics: Negative and Positive Rankings by City (# of focus groups)	 47
Table 20. Who Sets the Selling Price of Finished Goods for the Self-Employed
and Sub-Contracted (%)	 54
Table 21. Unable to Bargain for Better Prices by Level of Education of Self-Employed
and Sub-Contracted (%)	 55
Table 22. Types of Responses to Three Sets of Driving Forces (# of focus groups)	 57
Table 23. Responses to a Fall in Earnings by Self-Employed and Sub-Contracted (%)	 58
Table 24. Institutions Seen as Helpful or Not Helpful by Self-Employed and Sub-Contracted (%)	 60
Table 25. Types of Businesses that Buy Home-Based Workers’ Products, by Self-Employed
and Sub-Contracted (%)	 63
Table 26. Home-Based Workers Along a Continuum of Independent to
Dependent Work Arrangements	 72
vi IEMS Informal Economy Monitoring Study
List of Figures, Diagrams and Charts
Box 1. Home-Based Worker Sample in Three Study Cities 	 7
Box 2. Range of Products & Services Produced by Home-Based Workers, by City 	 13
Diagram 1. Economic Linkages: Cooperative of Home-Based Workers, Bangkok, Thailand	 16
Diagram 2. Economic Linkages: Garment Makers & Incense Stick Rollers, Ahmedabad, India	 17
Box 3. High Cost of Health & Education in Lahore 	 29
Box 4. Economic Recovery Undermined by Heavy Floods in Bangkok 	 34
Box 5. Impact of Small Size and Poor Quality of Housing on Home-Based Work in Ahmedabad 	 37
Diagram 3. Causal Flow: Impact of and Responses to Lack of Low-Cost Housing Lahore, Pakistan	 38
Box 6. Evictions & Relocations in Bangkok 	 39
Diagram 4. Causal Flow: Impact of and Responses to Electrical Outages & Load Shedding,
Lahore, Pakistan	 42
Box 7. In Lahore, Energy Crisis Compounds Inflation 	 42
Box 8. Problems Associated with Lack of Public Transport 	 46
Box 9. Occupational Health and Safety Hazards of Rolling Incense Sticks 	 53
Box 10. Types of Support by Membership-Based Organizations (MBOs) of Home-Based Workers 	 61
Box 11. Overall Contributions: Perceptions of Focus Groups in Lahore 	 66
1IEMS Sector Report: Home-Based Workers
Executive Summary
Home-based workers produce goods or services for the market from within or around their own
homes: stitching garments and weaving textiles; producing craft products; processing and preparing
food items; assembling or packaging electronics, automobile parts, and pharmaceutical products;
selling goods or providing services (laundry, hair-cutting, beautician services); or doing clerical
or professional work; among other activities. Although they remain largely invisible, home-based
workers are engaged in many branches of industry and represent a significant share of urban
employment in some countries, particularly for women and especially in Asia.
Home-based workers are one of three urban informal occupational groups – together with street
vendors and waste pickers – who are the focus of a 10-city study. The Informal Economy Monitoring
Study aims to provide credible, grounded evidence of the range of driving forces, both positive and
negative, that affect conditions of home-based work, street vending and waste picking; the responses
of informal workers to these driving forces; and the institutions which help or hinder their responses.
IEMS uses both qualitative and quantitative methods. The qualitative component consists of a set
of focus group tools designed to capture systematically the perceptions and understandings of 75
informal workers (per city), in their own words, in focus group settings. The quantitative component
consists of a survey administered to the focus group participants plus another approximately 75
workers who did not participate in focus groups. A total of 447 home-based workers participated in
the study. They live in three cities: Ahmedabad, India; Bangkok, Thailand; and Lahore, Pakistan.
Key Findings
Individuals, Households and Enterprises
The home-based workers in the study produce a wide range of products for local, national, and
international markets: from prepared food to incense sticks, from flower garlands to soccer balls, and
IncenserollerinAhmedabad.Photo:L.Vryenhoek
2 IEMS Informal Economy Monitoring Study
from shoes to garments (both traditional and modern). Though most home-based workers have very
low and unpredictable earnings, their earnings are essential in fending off extreme poverty: over three
quarters of the sample belonged to households where the main source of income is informal.
Of the total sample of home-based workers across the three study cities, 71 per cent are sub-contracted
and 29 per cent are self-employed. In the Ahmedabad sample, all of the home-based workers are
sub-contracted; in both the Bangkok and Lahore samples, around 56 per cent are sub-contracted.
The majority of the self-employed are own-account workers, one third are employers, and a small
percentage are unpaid contributing family workers or (only in Bangkok) members of cooperatives.
Among sub-contracted workers, some sub-contract work to other sub-contracted workers. Among
the self-employed, one third hire workers at some point in the year; one third use only unpaid family
workers; and one third work entirely on their own throughout the year. Over half of the total sample
make garments; the others produce a range of products.
Driving Forces
The study found that home-based workers, both self-employed and sub-contracted, are affected by
the macroeconomic environment, notably by fluctuations in demand and prices. Across the three
study cities, nearly half of the survey respondents reported that the high cost of inputs was a problem
and over 40 per cent reported that the price of inputs had increased over the past year. Inflation was
prioritized as a major driving force by nearly all of the focus groups in Lahore and one third of the
focus groups in Bangkok.
The study also found that, because their homes are their workplaces, home-based workers are
directly affected by basic infrastructure services, or the lack thereof: including, the high cost and
irregular supply of electricity. Focus group participants, most prominently in Lahore, reported that
power outages and load shedding significantly impacted their ability to get work done; many had
to intensify work when the power came on while others switched to laborious manual machines.
The accessibility and cost of public transport is also a key factor for home-based workers. The
self-employed commute to markets on a regular, if not daily, basis to buy raw materials and other
supplies, to negotiate orders, and to sell finished goods. The sub-contracted workers commute to
firms or contractors to receive work orders and raw materials, to return finished goods, and to get
paid. Significantly, one quarter of those who had to rely on paid transport operated at a loss.
Further, the study found that home-based workers are exposed to unpredictable and often unfair value
chain dynamics, including: irregular purchase/work orders, irregular supply of raw materials, and
delayed payments. In short, most home-based workers are included in markets on unfair terms. In part
this is because they work at home: isolated from other workers in their sector (apart from those in their
neighbourhood) and with limited knowledge of markets and market prices (especially if they are sub-
contracted). These factors limit their ability to bargain in the market for more favourable prices and
piece rates or to negotiate with government for basic infrastructure and transport services. While there
are important differences in value chain dynamics and relationships between self-employed and sub-
contracted home-based workers, a crucial economic factor that both groups face is that they must cover
many costs of production including workplace, equipment, and power as well as transport.
It is important to note that some of the focus groups in Bangkok identified a number of positive
driving forces in their work and lives, including infrastructure services, free education and health, and
regular orders/customers; some of the focus groups in Lahore mentioned improved roads, improved
water supply, and improved sanitation. It is also important to note that some focus groups in each of
the three cities highlighted the value of home-based work to women, including not only the ability to
combine paid and unpaid work and to have a flexible work schedule but also to earn and save money,
to train children, and to engage family members as needed to help out. Further, many individual
home-based workers reported that they like home-based work and feel they are skilled at it.
These positive factors notwithstanding, the negative driving forces take a cumulative toll on the
earnings of home-based workers, making them both low, on average, and unpredictable. In addition,
home-based workers must cover many costs and absorb many risks of production, but they do so
from a position of limited leverage: with little or no bargaining power, no policy presence, and limited
voice and visibility outside the immediate household or neighbourhood. Considered together, these
findings illustrate why so many home-based workers – and other informal workers – are not able to
work their way out of poverty, so long as their earnings are low and unstable, their expenditures and
risks are high, and their first line of defense is to reduce household consumption, especially nutrition.
3IEMS Sector Report: Home-Based Workers
Responses & Mediating Institutions
The negative driving forces make both expenditures and earnings unpredictable for home-based
workers. Reducing expenditure is the most common coping strategy followed by borrowing money,
adjusting current work, and/or taking on new work. Many home-based workers expressed concern
about the cumulative toll of physical effort, long hours, stress and frustration that resulted from
dealing with these negative forces on themselves, their households and their communities. Many also
recognized that as individuals they could not exercise voice – could not bargain for a better deal – as
they had no fall-back position, no alternative economic opportunities. But some reported engaging in
collective protests or negotiations with the support of their membership-based organizations (MBOs).
In both the survey questionnaire and the focus groups, the home-based workers were asked which
institutions helped or hindered their ability to respond to the negative driving forces. Among the
institutions ranked as helpful by the focus groups, the MBO to which the home-based workers
belong was the most prominent, mentioned by well over half of the focus groups, followed by
welfare boards and local municipal government. However, there was significant variation in the
institutional environment across the three cities. The local municipality, the employment department,
and public transport play more prominent positive roles in Bangkok than in the other two cities.
Welfare boards play a prominent positive role in Lahore and especially in Ahmedabad, but there is no
local equivalent in Bangkok. Among the institutions ranked as negative by the focus groups, by far
the most prominent was the private company or government department responsible for providing
electricity, followed by the municipal government, police, and public transport. The findings illustrate
the importance of being organized – of belonging to an MBO of informal workers. Such organizations
represent the only channel for voice for most home-based workers who otherwise lack bargaining
power and, also, lack visibility in policy processes.
Linkages & Contributions
These is a widespread notion that the informal economy is not linked to the formal economy.
Although they work from their homes, many home-based workers are linked to formal firms through
both backward and forward production linkages. Around 30 per cent of the self-employed home-
based workers purchase inputs from formal firms and just under 30 per cent of both groups of home-
based workers sell goods to or produce goods for formal firms.
There is also a widespread notion that the informal economy does not contribute to the economy.
However, home-based workers make significant contributions to their households, to society, and to
the economy. They contribute to the household budget but also, by working from home, to the care
of children and the elderly, to the quality of family life, and to the social fabric of their communities.
They provide goods and services at a low cost to low-income people and the general public. They
also produce goods at low prices for domestic and global value chains. They do not commute every
day and often go to markets on foot or by bicycle, thus, helping to reduce air pollution and traffic
congestion. They create demand by buying supplies, raw materials, and equipment and paying for
transport and other services (such as washing, ironing and packaging of garments they product).
They pay taxes on the raw materials, supplies, and equipment they purchase; and the firms up the
chain who sell their finished goods often charge sales taxes.
Theoretical & Policy Implications
Theoretical Lessons
It is widely assumed that the workforce is comprised of fully independent self-employed and fully
dependent employees. However, most home-based workers fall in a grey intermediate zone between
being fully independent and being fully dependent. Clearly, sub-contracted home-based workers
are neither fully independent self-employed nor fully dependent employees. They typically have
to absorb many of the costs and risks of production – including: buying or renting and maintaining
equipment; providing workspace and paying for utility costs; buying some inputs; and paying for
transport, often without legal protection or help from those who contract work to them. Also, they
are not directly supervised by those who contract work to them. However, they are subject to factors
beyond their control, namely: irregular work orders, strict delivery deadlines, and quality control
of the products or services they deliver. On the other hand, self-employed home-based workers are
not fully independent: as they have limited access to capital, limited knowledge of markets, limited
bargaining power, and limited control in commercial transactions. Also, both groups have limited
4 IEMS Informal Economy Monitoring Study
leverage over public policies and services that are crucial to their productivity, such as land allocation
and housing policies, as well as basic infrastructure and transport services.
The study findings challenge the common assumptions that the informal economy is not linked to the
formal economy or to the modern economy; that informal operators intentionally avoid regulation
and taxation; and that the informal economy does not contribute to – or is not affected by – the wider
economy. As noted earlier, many self-employed home-based workers buy supplies from formal firms
and many self-employed and sub-contracted home-based workers sell goods to or produce goods for
formal firms. The study found no evidence that home-based workers are hiding from any regulations.
On the contrary, most of the home-based workers in the sample pay taxes and levies of various kinds
but do not enjoy the basic infrastructure and transport services they need to be productive. Moreover,
few home-based workers hire other workers, and are not therefore avoiding labour regulations,
and many of the sub-contracted are concerned about their own working conditions. Further, the
productive activities of home-based workers, both self-employed and sub-contracted, are significantly
affected by the macroeconomic environment, notably by fluctuations in demand and prices.
Policy Lessons
A major policy lesson is that home-based workers and their activities are affected by government
policies and practices, notably land allocation, housing policies, basic infrastructure services, and
public transport. This is because their homes are their workplaces; and they have to commute to
markets and transport supplies/goods to and from their homes. Efforts should be made to upgrade
settlements with large concentrations of home-based workers to ensure they have adequate shelter,
water, sanitation and electricity. If and when home-based workers and their families have to be
relocated, efforts should be made to ensure the relocation sites have, from the outset, adequate shelter,
basic infrastructure, transport services, and access to markets.
A second major policy lesson is that home-based workers need legal rights and protections against
unequal and, often, exploitative value chain practices and relationships. To demand and secure their
rights, home-based workers need increased bargaining power, which comes with being organized
and being invited to have a seat at the policymaking, rule-setting or negotiating table. As the study
findings show, home-based workers have limited scope for negotiation or leverage: due in large part
to their isolation in their homes but also to exclusionary urban policies or practices and to unequal
or exploitative value chain dynamics. The most supportive institution to the home-based workers in
each study city is the MBO to which they belong.
The final policy lesson from the study is that home-based workers and their activities, like formal
workers and formal firms, are impacted by macroeconomic trends and policies. Efforts should be
made to increase the visibility of home-based workers and their output in official labour force and
other economic statistics and to study the impact of macroeconomic trends and policies on home-
based workers and their work.
Clearly, improving the terms on which home-based workers, and other informal workers, engage
with the market and the state are key pathways to reducing poverty. Improving the terms of
engagement with the state and with the market should also be recognized as key dimensions of
social-economic inclusion and inclusive growth. Meanwhile, policymakers should recognize that the
earnings of home-based workers are essential to the daily cash flow – and the ongoing struggle to
ward off extreme poverty – of their households.
5IEMS Sector Report: Home-Based Workers
Introduction
Home-Based Workers
Home-based workers produce goods or services for the market from within or around their own
homes:1
stitching garments and weaving textiles; producing craft products; processing and preparing
food items; assembling or packaging electronics, automobile parts, and pharmaceutical products;
selling goods or providing services (laundry, hair-cutting, beautician); or doing clerical or professional
work; among other activities. Although they remain largely invisible, home-based workers are
engaged in many branches of industry and represent a significant share of urban employment in
some countries, particularly for women and especially in Asia. For example, in India in 2011-12, they
represented 14 per cent of total urban employment and 32 per cent of women’s urban employment
(Chen and Raveendran 2014); and in Pakistan in 2008-9, they represented 4 per cent of total urban
employment and 31 per cent of women’s urban employment (Akhtar and Vanek 2013).
Historically, home-based work has been associated with pre-modern manufacturing. But home-based
work has persisted and is growing in many sectors and countries around the world. Today, many
home-based workers produce under sub-contracts for global value chains and are, thus, a feature of
the modern global economy (Carr, Chen and Tate 2000; Kabeer 2004). Many others are self-employed,
producing both low- and high-end goods and services. In many countries, a large share of total
1
	 The Independent Group on Home Based Workers in India constituted by the Ministry of Statistics and Programme Imple-
mentation recommended in 2007 the following definitions for “home” and “home-based workers”. “Home” was defined as
a) dwelling unit and/or b) structure attached to dwelling unit and/or c) open area adjacent to the dwelling unit. “Home-
based workers” were defined as a) own-account workers and contributing family workers helping the own account workers,
involved in the production of goods and services in their homes for the market; and b) workers carrying out work in their
homes for remuneration, resulting in a product or service as specified by the employer(s), irrespective of who provides the
equipment, materials or other inputs used and those contributing family workers helping such workers (Sudarshan and
Sinha 2011).
GarmentworkerinBangkok.Photo:S.Tubsakal
6 IEMS Informal Economy Monitoring Study
production is now home-based. In India in 2005-6, around 75 per cent of all manufacturing firms were
informal and, of these, around 75 per cent were home-based (Basole and Basu 2011). These figures
suggest that over half of all manufacturing units in modern India are home-based.
Debates around home-based work centre on what drives it and how to extend labour protections
to home-based workers, particularly those who are sub-contracted. Much of this debate focuses
on women home-based workers. But there are male home-based workers, often in retail trade and
repair services (ILO and WIEGO 2013). Indeed, men represent one half of all home-based workers in
India and one quarter of all home-based workers in Pakistan, in part because the female labour force
participation rate is very low in both countries (Raveendran, Sudarshan and Vanek 2013; Akhtar and
Vanek 2013). In some societies, gender norms restrict the physical mobility of women, conditioning
them to not seek paid work outside the home. In many societies, the gender division of labour –
whereby women are seen as the primary housekeepers and caregivers – conditions women to work at
home in order to juggle paid work with unpaid domestic and care work. But it is also the case that, to
cut costs and maximize profits, many firms decide to outsource production to home-based workers,
especially women. Further, advances in technology have facilitated the outsourcing of production
to home-based workers (Balakrishnan 2002; Balakrishnan and Sayeed 2002; Chen, Sebstad and
O’Connell 1999; Bose 2007; Raju 2013).
In other words, home-based work in its modern form is driven in large part by changes in production
associated with the global economy. Outsourcing of work to home-based workers and the associated
lack of power of these workers are both inextricably linked to recent shifts in how global production
is organized. Sub-contracted home-based workers are officially referred to as “homeworkers”. In
1996, the International Labour Organization (ILO) adopted an international convention on homework
– Convention 177 – which has been ratified by 10 countries. And, in recent years, some corporate
social responsibility initiatives have expanded their oversight to encompass homeworkers, the lowest
links in global value chains: for instance, the Ethical Trading Initiative in the UK has a working group
on homeworkers. There is growing understanding of how home-based workers are inserted into
global value chains, from labour-intensive industries such as garments to high-end industries such as
automobiles (Balakrishnan 2002; Carr, Chen and Tate 2000; Unni and Rani 2008).
There is also growing understanding of how economic crises affect home-based workers, from the
Asian financial crisis in the late 1990s to the global recession that started in 2008 (HomeNet Thailand
and ILO 2002; Horn 2009, 2011). But far less is known about how broader economic trends and
government policies affect home-based workers, especially the self-employed. In particular, few
studies trace how inflation and fluctuations in demand, competition and prices affect home-based
workers; and few show how urban housing policies, basic infrastructure provision (or the lack
thereof), and zoning regulations affect home-based workers whose homes are also their workplaces.
Further, few existing studies provide structured comparisons of different sectors of home-based
workers across cities. The Informal Economy Monitoring Study (IEMS), of which this report is a part,
begins to fill these gaps for home-based workers. Separate reports tracing the impact of economic
trends, city policies, and value chain dynamics are available for two other sectors of the informal
economy: street vending and waste picking (Roever 2014; Dias and Samson 2014).
IEMS Study
The objective of the IEMS is to provide credible, grounded evidence of the range of driving forces,
both positive and negative, that affect conditions of work in the urban informal economy in 10 cities
over time. The study examines not only the impact of these forces across and within sectors, but also
informal workers’ responses to them. It is based on a collaborative approach between researchers,
both local researchers in each city and researchers from the WIEGO network, and membership-
based organizations (MBOs) of home-based workers, street vendors, and waste pickers to monitor
the state of the urban working poor in the informal economy. This report synthesizes qualitative and
quantitative data from the first (2012) round of IEMS fieldwork in the home-based work sector in three
cities: Ahmedabad, India; Bangkok, Thailand; and Lahore, Pakistan. Its focus is on the ways in which
three driving forces – macroeconomic trends, government policies and practices (especially but not
exclusively at the city level), and value chain dynamics – play out among different segments of home-
based work across cities, and how those trends may inform urban policy and planning approaches.
The IEMS is based on both qualitative and quantitative methods. The qualitative component consists
of participatory informal economy appraisal (PIEA), an innovative method designed to capture
7IEMS Sector Report: Home-Based Workers
systematically the perceptions and understandings of informal workers in their own words, in a focus
group setting.2
Each city team3
conducted 15 focus groups of five participants each (per sector), in
which nine tools – organized around the themes of sector characteristics, market linkages the impact
of and responses to driving forces, the institutional environment, and contributions of the sector to the
city – were used to generate data related to the conceptual framework. The results of the focus groups
were recorded in brief reports (5-10 pages) immediately after each focus group was conducted, and
those reports were then analyzed and synthesized into a city report.
The quantitative component consists of a survey questionnaire administered to the 75 focus group
participants per sector, plus another 75 workers for a total of 150 in each city-sector (with minor
variation in the sample size in some cities/sectors). The questionnaire is designed to supplement
the data collected through the focus groups by collecting information on the household profile and
income sources of the workers; the assets profile of the workers’ households; detailed information
on the enterprise or occupation of the workers; and linkages between the informal economy and the
formal economy. The questionnaires were administered using a data-capture tool.
The sampling approach was designed to maintain comparability in the results across all IEMS cities,
on the one hand, and to allow some flexibility as demanded by local circumstances, on the other
hand. Each city aimed to include only members of the local MBOs or their affiliates. Research teams in
all cities used a common matrix of sector-specific sampling variables: for the home-based work sector,
this included status in employment (sub-contracted or self-employed4
), product category, and (in the
case of one city) a spatial variable. Each city research team then developed the most representative
sample possible of the population of MBO membership on that matrix. Because only MBO members
were sampled, the findings presented here are not designed to be representative of the entire
population of home-based workers in each city.
In the three cities where home-based workers were studied, only women home-based workers were
included in the sample as the membership of the local MBO partner in each study city was all women.
Two key variables were used to draw the sample from this pool: status in employment (self-employed
or sub-contracted) and product category (garments or non-garments): see box 1.
Box 1. Home-Based Worker Sample in Three Study Cities
Ahmedabad:
•	Product Type: Garment + Non-Garment (single product = incense sticks/agarbatti)
•	Status in Employment: All Sub-Contracted; among sub-contracted, distinction drawn
between those who deal directly with a trader and those who deal through a contractor for
getting work orders/raw materials and delivering finished goods
Bangkok:
•	Product Type: Garment + Non-Garment (multiple products)
•	Status in Employment: Sub-Contracted + Self-Employed
Lahore:
•	Product Type: Garment + Non-Garment (multiple products)
•	Status in Employment: Sub-Contracted + Self-Employed
•	Additional Location Variable: Center + Periphery
2
	 The methodology was developed collaboratively with Caroline Moser, Angélica Acosta, and Irene Vance, who also trained
the city teams in the data collection methods and later in data analysis. PIEA is an adaptation of earlier participatory research
methodologies developed by Chambers (1994), Moser and Holland (1997), Moser and McIlwaine (1999, 2004), and Moser,
Acosta and Vásquez (2006).
3
	 Each city team consisted of an MBO coordinator, two qualitative researchers, and two quantitative researchers. A member of
WIEGO’s Technical Advisory Committee supported each city team through data analysis and report writing.
4
	 In this report, as per the International Classification of Status in Employment, the self-employed include employers, own
account operators, unpaid contributing family workers, and members of cooperatives. Most sub-contracted workers are paid
by the piece. In Thailand, some reported that they were paid on a daily rate basis. In this report, those who were paid on a
daily rate were merged with those who were paid on a piece rate into a single “sub-contracted worker” category.
8 IEMS Informal Economy Monitoring Study
Report Structure
Part I of the report analyzes the individual, household, and enterprise characteristics of the 447
home-based workers who participated in the study. It describes the products they produce as well
as their status in employment and associated contractual arrangements and market transactions.
Part II analyzes the quantitative and qualitative data related to driving forces, showing especially
how fluctuating demand and prices affect home-based workers, how infrastructure services, notably
electricity supply, affect the productivity of home-based workers whose homes double as workplaces,
and how value chain dynamics affect the earnings of home-based workers. It also examines the
range of responses to these driving forces, with particular attention to whether the home-based
workers modify their existing work, reduce expenditures and/or borrow money, and the mediating
role of institutions, especially MBOs. Part III analyzes the institutions that support the home-based
workers; the linkages between home-based workers, formal firms, and the urban economy; and the
contributions of home-based workers to their families, society, environment and the economy. Part IV
summarizes key findings and offers theoretical lessons and policy implications derived from the first
round of study.
9IEMS Sector Report: Home-Based Workers
Part 1: Individual, Household & Enterprise Characteristics
The home-based workers in the study sample produce a wide range of goods from their homes for
domestic and global markets: stitching garments, shoes, or soccer balls; rolling incense sticks; cooking
food for sale; weaving or carving craft items out of bamboo, horn, and wood; threading flower garlands;
and more. Some sell goods or provide services from their homes. This heterogeneity of products can be
found among both categories of home-based workers: self-employed and sub-contracted.
The self-employed produce mainly for local customers, buyers and markets but also for domestic
markets and, in some cases, international buyers. They buy their own raw materials, supplies,
and equipment and sell their own finished goods. The sub-contracted workers produce goods for
firms up the value chain, both domestic and global value chains: but typically do not know the
backward or forward links of the chain they are engaged in beyond the firm or its contractor which
directly outsources work to them. This is because they do not buy their own raw materials or sell
their own finished goods. However, as the study findings clearly illustrate, both sub-contracted and
self-employed home-based workers cover many of the non-wage costs of production (workplace,
equipment, utilities, transport) and absorb many of the risks of production (delayed or cancelled
orders, unreliable supply of raw materials, delayed payments, rejected goods).
1.1 Home-Based Workers
The home-based workers in the IEMS study sample, as noted above, are all women. They have been
working as home-based workers for, on average, 12.5 years. All but 14 are currently members of a
local MBO of informal workers. Those who are currently MBO members have been members for, on
average, six years. But around one third have been an MBO member for less than a year.
GarmentworkerinLahore.Photo:HomeNetPakistan
10 IEMS Informal Economy Monitoring Study
Of the 447 women in the sample,5
11 per cent are 25 or younger; two thirds are between 26 and 50
years of age, and 22 per cent are aged 50 or older. Around two thirds are married, 16 per cent are
never-married, 12 per cent are widowed, and 7 per cent are separated or divorced. Nearly one quarter
(23 per cent) of the sample have no education, around 45 per cent have some primary education, and
one third have some secondary education or higher. Among the three cities, the home-based workers
in Bangkok have the highest levels of education (over half have some primary education and over
40 per cent have some secondary education or above); and those in Lahore have the lowest levels of
education (just under 40 per cent have no education).
Whether or not they have formal education, many home-based workers feel they have the requisite
skills for their work: some acquired these skills from their parents or communities; others learned
on the job; and still others attended training courses run by the government or non-governmental
organizations. A dress maker and embroiderer in Bangkok stated that she was destined to be a
dress maker: “I was born among garment workers. Formerly, most of the people who were living in this area,
worked on garments. Thus the skills for garment making including sewing and embroidering were taught from
generation to generation” (FG 11). Another dress maker in Bangkok, now in her mid-40s, said: “I have
known how to make dresses since I was 15-16 years old. During that time, parents usually allowed their young
girls to learn about dress making, which was popular as a woman’s occupation” (FG 8).
Of the total sample of home-based workers across the three study cities, 71 per cent are sub-
contracted and 29 per cent are self-employed: see table 1. The majority of the self-employed are
own-account workers (without paid employees), one third hire workers for some part of the year,
and a small percentage are unpaid contributing family workers or (only in Bangkok) members of
cooperatives. In the Ahmedabad sample, all of the home-based workers are sub-contracted; in both
the Bangkok and Lahore samples, around 56 per cent are sub-contracted.
Table 1. Sample by Status in Employment (% distribution)
Ahmedabad Bangkok Lahore Total
Self-Employed 0.00 43.34 44.08 29.40
Employers - for some part of the year --- 18.00 13.16 10.47
Own account workers --- 22.00 28.29 16.93
Contributing family workers --- 0.67 2.63 1.11
Cooperative members --- 2.67 0.00 0.89
Sub-Contracted 100.00 56.66 55.92 70.60
N 147 150 150 447
Source: IEMS survey data (2012)
1.2 Households of Home-Based Workers
With the low average earnings associated with home-based work (see section 1.3.5 below), the welfare
of home-based workers and their families depends on whether they are the sole or main earner in the
family; whether they have secondary sources of income; and whether other earning members, if any,
in the household are informally or formally employed. The poverty risk also depends on whether the
home-based worker or her family has access to sources of income other than what they earn. While
a very low percentage of the home-based workers are sole earners in their households, over three
quarters (78 per cent) of home-based workers across all three cities live in households where the main
source of income was informal.
While only 6 per cent of the home-based workers are the sole income earners of their families, over
one quarter (27 per cent) are the main earners of their families. Also, over two thirds (68 per cent)
belong to households that do not have a formal source of income; and over three-quarters (78 per cent)
belong to households where the main source of income is informal: see table 3. Finally, nearly one
quarter (22 per cent) of the home-based workers have a secondary source of income: see table 2. A far
higher percentage of home-based workers in Bangkok, compared to the other two cities, have a formal
source of income (55 per cent) and a secondary source of income (33 per cent). Home-based worker
5
	 Although the sample design called for 150 workers to be interviewed in each of the three cities, for a total of 450 workers, the
total interviewed was 447.
11IEMS Sector Report: Home-Based Workers
households are least likely (13 per cent) to have a formal source of income in Lahore and home-based
workers are least likely (12 per cent) to have a secondary source of income in Ahmedabad.
Table 2. Formal Source of Household Income & Secondary Source of Individual Income
of Self-Employed and Sub-Contracted (%)
Self-Employed Sub-Contracted All HBWs
Formal source of income 33.08 31.86 32.21
Secondary source of income 22.31 21.77 21.92
N 130 317 447
Bangkok
Formal source of income 55.38 55.29 55.33
Secondary source of income 35.38 31.76 33.33
N 65 85 150
Lahore
Formal source of income 10.77 15.29 13.33
Secondary source of income 9.23* 29.41 20.67
N 65 85 150
Ahmedabad
Formal source of income --- 27.89 27.89
Secondary source of income --- 11.56 11.56
N --- 147 147
*Statistically significant at the .05 level. Home-based workers in Bangkok are significantly more likely to report
at least one source of income from formal work in their household (X2
= 61.73; p = 0.000) and to have a secondary
income source (X2
= 20.76; p = 0.000) in addition to their main activity – at the .05 level of confidence.
Source: IEMS survey data (2012)
Table 3. Main Source of Household Income, Formal or Informal,
of Self-Employed and Sub-Contracted (% distribution)
Employment Status
Self-Employed Sub-Contracted All HBWs
Formal - main income 11.54* 26.18 21.92
Informal - main income 88.46 73.82 78.08
N 130 317 447
Bangkok
Formal - main income 18.46* 56.47 40.00
Informal - main income 81.54 43.53 60.00
N 65 85 150
Lahore
Formal - main income 4.62* 0.00 2.00
Informal - main income 95.38 100.00 98.00
N 65 85 150
12 IEMS Informal Economy Monitoring Study
Table 3. Main Source of Household Income, Formal or Informal,
of Self-Employed and Sub-Contracted (% distribution) (continued)
Employment Status
Self-Employed Sub-Contracted All HBWs
Ahmedabad
Formal - main income --- 23.81 23.81
Informal - main income --- 76.19 76.19
N --- 147 147
*Statistically significant at the .05 level for all cells for that specific city. Home-based workers in Bangkok are
significantly more likely to report income from formal work as their main source of household income at the .05
level of confidence (X2
= 63.72; p = 0.000)
Source: IEMS survey data (2012)
Survey results confirm that whether the main breadwinner in the household has a formal or informal
source of income has an impact on the status of the household. Home-based workers who live in a
household where the main source of income is formal are significantly more likely to have a credit
card, a bank account, and a private toilet. Households in which the main source of income is formal
are twice as likely to perceive themselves as reasonably or very comfortable. Conversely, households
in which the main source of income is informal are more likely to perceive themselves as very poor,
poor, or just getting by.
In Ahmedabad and Lahore, few of the sample households enjoy social protection, social assistance,
or sources of income other than what they earn. In Thailand, the universal health system extends
coverage to informal workers and other disadvantaged groups: so all of the home-based workers
in Bangkok reported that they have health insurance.6
In the other two cities, a very low percentage
of sample households have health insurance: 7 per cent in Ahmedabad and 3 per cent in Lahore.
Also, a far higher percentage of households in Bangkok (28 per cent) than in Ahmedabad (7 per
cent) and Lahore (3 per cent) reported that they have a pension.7
Around 7 per cent of households
in both Bangkok and Lahore, but less than 1 per cent in Ahmedabad, reported that they receive
remittances from family members who are migrant workers. Less than 15 per cent of households in
Bangkok and less than 10 per cent in Ahmedabad and Lahore receive any of the following forms of
social assistance: government grants, unemployment insurance, retrenchment packages, or workers’
compensation. Yet most home-based workers and their families would be eligible for and should be
targeted by social assistance schemes.
To sum up, over three quarters of the home-based worker sample belong to households that rely
entirely on earnings from informal work and over one quarter are the main earners in their families;
their earnings play a critical role, as will be shown later on, in maintaining household consumption,
including very basic food consumption. So although they earn little and have no policy visibility or
voice, the earnings of home-based workers are essential in fending off extreme poverty.
6
	 In Thailand under the universal health coverage scheme, the informal workers do not have health insurance per se but,
rather, are entitled to free health care services financed by the government. Since 2007, when a co-payment of Baht 30.00
(about US$1.00) per visit to accredited hospitals and health centers for inpatient or outpatient care (including drugs) was
dropped, these services have been free.
7
	 In Thailand, under article 40 of the Social Security Scheme, the informal workforce is entitled to old age pensions as well as
compensation for disability, hospitalization, and death.
13IEMS Sector Report: Home-Based Workers
1.3 Enterprises of Home-Based Workers8
Despite their heterogeneity, home-based workers can be meaningfully differentiated, for policy
and other purposes, by their status in employment and associated contractual arrangements. Other
important policy-relevant variables are what they produce, the conditions of their home-cum-workplace,
and the distance of their home-cum-workplace from their customers, markets, or contractors.
1.3.1 Product Categories
Home-based workers can be found in a wide variety of sectors: from traditional labour-intensive
sectors such as textiles and garments, artisan production, and food processing to more capital-intensive
sectors such as automobile parts and electronic assembly. In the study sample, all of the home-based
workers work in labour-intensive sectors. Over half of the total sample, as well as of the Ahmedabad
and Bangkok samples, are garment makers while in Lahore, the sample divides evenly between those
who make garments and those who make other products. Among the self-employed, the majority in
Bangkok are garment makers while the majority in Lahore make products other than garments.
In all three cities, the garment makers produce a range of garment items, traditional and modern: and
some are involved in ancillary work, such as embroidery, in addition to stitching: see box 2. In Bangkok
and Lahore, the home-based workers also produce a variety of products other than garments: shoes
and accessories; craft items; household goods; cooked and processed food. In Bangkok, a few home-
based workers provide services or engage in trade: ironing for local customers, filling bottles with oil
under a sub-contract, or running a small grocery store in their home. In Ahmedabad, as per the sample
design, the majority of the non-garment home-based workers roll incense sticks (agarbatti); a few make
cushion and pillow covers or apply lace edgings to handkerchiefs.
Box 2. Range of Products & Services Produced by Home-Based Workers, by City
City Garments Other products & services
Ahmedabad Traditional Garments:
Tunics - kameez, punjabi
Pants - salwar
Skirts - lehnga
Petticoats - for saris
Modern Garments:
Skirts
Pants
Frocks - for girls
Incense sticks - agarbatti
Cushion covers
Pillow covers
Handkerchiefs - lace edgings
8
	 In this report on home-based workers, we use the term “enterprise” advisedly for several reasons. First, most home-based
workers, even the self-employed, earn below the prevailing minimum wage or poverty line in their countries. Second, most
home-based workers, even the self-employed, invest relatively large amounts of their labour, compared to capital, into their
activities. Of the self-employed home-based workers in the study sample, one third hired workers at some point during
the year. Very few are employers who hire others on a regular basis. Finally, nearly three quarters of the sample were sub-
contracted workers who cover a lot of the non-wage costs of production (workspace, equipment, utilities) and absorb many
of the risks of value chain production (through delayed or cancelled work orders, delayed payments, or rejected goods)
but have limited (if any) knowledge of the product markets and limited autonomy or power to negotiate a better deal for
themselves.
14 IEMS Informal Economy Monitoring Study
Box 2. Range of Products & Services Produced by Home-Based Workers, by City (continued)
City Garments Other products & services
Bangkok Traditional Garments:
Shirts - for Muslim men
Prayer hats - for Muslim men
Modern Garments:
Dresses
Shirts - some brand-name
T-shirts
Ancillary Work:
Embroidery
Shoes & Accessories:
Handbags
Shoes
Cloth diapers
Craft:
Woven baskets
Carved buffalo horn
Flower garlands - for Buddhist rituals
Plastic products
Lottery games
Food Items:
Cooked food, including smoked pork
Processed food, including chili paste
Services & Trade:
Ironing
Filling oil bottles
Grocery store
Lahore Traditional Garments:
Bridal outfits
Modern Garments:
Shirts
Pants
Dresses
Ancillary Work:
Embroidery
Bead work
Ironing & packaging
Shoes & Accessories:
Handbags & purses
Jewelry
Shoe uppers
Shoe boxes
Household Goods:
Napkins
Sheets & bedspreads, including block-printing
Paper bags
Scrap cloth bags - for shopping
Foam mattresses
Food Items:
Cooked food, including coffee, rice porridge
(congee), & stuffed patties (samosas)
Processed food, including spices & dried fruit
Source: IEMS Focus Groups (2012)
1.3.2 Type & Structure of Enterprises
Self-employed and sub-contracted workers can be further distinguished by whether they hire
others, work on their own or with unpaid family help, or are members of producer groups. Among
sub-contracted workers, some sub-contract work to other sub-contracted workers; thus acting as
intermediaries between a contractor or firm that outsources work and other sub-contracted workers,
often in their own neighbourhood or community. Among the self-employed in the study sample,
one third hire workers at some point in the year; one third use only unpaid family workers; and one
third work entirely on their own. Among both groups in Bangkok, there are several cooperatives or
producer groups.
Sub-Contracted Home-Based Workers
Classic Sub-Contracted Workers – Under the most common sub-contracting arrangement, the
sub-contracted workers provide the workplace, pay for utilities, buy/rent and maintain their own
equipment while the contractors provide the work orders and raw materials, specify the product/s to
be made, and sell the finished goods or supply them to firms further up the chain. In most cases, the
home-based worker goes to the contractor to receive raw materials/deliver finished goods; in some
cases, the contractor comes to the home-based worker’s home or lives/works nearby.
15IEMS Sector Report: Home-Based Workers
In Ahmedabad, several variations on sub-contracting arrangements were reported. Some home-
based workers pick up raw materials and drop off finished goods from/to the shop or factory that
outsources production, rather than through a contractor. In Ahmedabad, among both home-based
worker product groups – garment makers and incense stick rollers – those who deal directly with a
shop or factory earn somewhat more, on average, than those who deal with contractors who take a
share of the value added.
Sub-Contracted Workers as Intermediaries – In some cases, the home-based worker is herself a
sub-contractor who splits the order and raw materials that she receives among other women in her
neighbourhood. In Bangkok, several sub-contracted workers also act as contractors: getting raw
materials and work orders from the contractors/firms for themselves and other women; distributing
the work orders and raw materials to other women in their neighbourhoods; collecting the finished
goods from other women and delivering these to the contractor/firm. In a few such cases, the
contractors or firms deliver raw materials to and collect finished goods from the designated woman in
the neighbourhood.
Groups of Sub-Contracted Workers – Some sub-contracted home-based workers work together in
groups: either in one woman’s home or in a common space within their neighbourhood. Consider
the case of five garment makers from one neighbourhood in Bangkok who made brand-name shirts
for a local factory. Two of the five are sisters. One of the sisters is the designated leader of the group.
The manager of the factory delivers work orders and raw materials to the local leader at her home;
she distributes the work orders and raw materials to the other women, who return finished goods
to her home, which the factory manager then picks up. According to the women, a brand-name firm
had designed the shirts and outsourced production to the local factory, which in turn outsourced
production to them (Bangkok FG 1).
Whatever the arrangement, many of the sub-contracted home-based workers have limited knowledge
of the markets and prices for raw materials and finished goods because they do not deal in these
markets. However, members of one group in Bangkok (FG 1), who embroider garments for a local
self-employed contractor, know where he buys his raw materials and how much he spends on
transport going to and from one of the markets. As one of them said:
“I know that the owner of our business goes to buy cloth and other materials from three places.
These are Pratunam Market, Yaovarat Market and sometimes at Pahurat Market. He takes a
taxi to Pratunam Market, which takes him about 1.5 to 2 hours, in order to sell his products on
wholesale and bring back home the raw materials for the next orders. He told me that he has to
pay 700 baht (USD 23.30) per round trip.”
The group added that sometimes their contractor takes a public boat from Pratunam Market to
Pahurat Market, where he books a taxi to wait for him (Bangkok FG 11).
Similarly, a group in Ahmedabad (FG 6) who produces incense sticks for a factory know where that
factory bought raw materials and processed the rolled incense sticks. As one of them said:
“My factory owner is a big wholesaler who has 2-3 factories. He purchases the raw materials
like jaggery, coal powder, and gum from Popat-bhai who is a big dealer in such raw materials.
The factory owner prepares the mixture and keeps it ready for us to make the incense sticks. The
scenting, packaging, and branding are done at other factories belonging to the owner.”
Knowing the markets for raw materials and finished goods, and especially the prices at which
supplies are purchased and finished goods are sold, should help enable sub-contracted workers to
negotiate better piece rates.
Self-Employed Home-Based Workers
Self-employed workers, by contrast, have to know and negotiate the markets for raw materials and
finished goods. As a result, they have much greater knowledge of markets and prices. But their
knowledge of markets comes at a price. Compared to sub-contacted home-based workers, the self-
employed have to spend more time and money on transport.
Consider the case of a cooperative in Bangkok, called the Solidarity Group, which makes T-shirts
for private firms as well as for NGOs and trade unions. The Solidarity Group is comprised of ex-
employees of Bed and Bath, a Thai company which had produced brand-name clothing for export but
16 IEMS Informal Economy Monitoring Study
closed in response to worker protests against its hiring practices. After fighting, unsuccessfully, for
compensation, some ex-employees decided to work independently and formed the Solidarity Group
cooperative. The cooperative members identified four markets where they purchase raw materials,
noting that they choose which market to go to after doing comparative research on wholesale prices
in different markets. They also make T-shirts for two factories which supply an especially fine fabric.
By participating in trade fares and exhibitions, they also receive orders for T-shirts from NGOs and
trade unions: see diagram 1.
Diagram 1. Economic Linkages:9
Cooperative of Home-Based Workers, Bangkok, Thailand
Trade unions
NGOs
Private firms
Yong Udom
factory
Lanluang
Market
Kwanthong &
Chongsathit
factories
Pahurat
Market
Wat Sone Market
Solidarity
Group
Charoenrath Market
Finished
shirts
Linings
Net linings
Accessories
Remnant
fabric
Fabric Fabric, thread
& accessories
Source: Bangkok FG 29
1.3.3 Market Transactions
Home-based does not necessarily mean home-bound. Often, home-based workers have to move
outside the home as part of their work: to buy raw materials or other inputs (self-employed and
sub-contracted), to get work orders/raw materials from and return finished goods to a contractor/
firm (sub-contracted), or to sell finished goods (self-employed). So the distance between the market/
contractor and the home-cum-workplace as well as the time and money spent in commuting and
transporting goods are of critical importance to the productivity and earnings of the workers. In
Ahmedabad, 8 per cent of the sub-contracted home-based workers reported that a contractor comes
to their home to give work orders, deliver raw materials, and pick up finished goods; over 75 per
cent reported that the contractor or firm/shop/factory which sub-contracts work to them is nearby
(often within walking distance); only 16 per cent reported that they have to use transport, usually
public transport, to commute to where the contractor/firm is located. In Bangkok, as noted earlier,
home-based workers in some neighbourhoods have a local leader who acts as an intermediary for the
others, getting raw materials from and delivering finished goods to a contractor, firm, or factory.
Consider what a focus group in Ahmedabad, comprised of three garment makers and two incense
stick rollers – all sub-contracted workers – described. A contractor or trader delivers the raw materials
to two of the garment makers and also collects the stitched garments from them; the third garment
maker has to go to the trader’s workshop to collect raw materials and deliver stitched garments.
Both incense stick rollers walk daily to their contractor or trader to collect raw materials and return
rolled incense sticks. The economic linkages diagram drawn by this focus group shows that the sub-
contracted workers have both backward and forward production linkages with the same traders and,
also, that the sub-contracted garment workers have to purchase supplies like thread and needles: see
diagram 2. The contractors, traders, and supply shops are all near the area where the women live and
work (Ahmedabad FG 12).
9
	 In the focus groups, in an economic linkages exercise, the participants were asked to draw diagrams indicating from whom
they bought/received raw materials and other supplies and to whom they sold/supplied finished goods.
17IEMS Sector Report: Home-Based Workers
Diagram 2. Economic Linkages: Garment Makers & Incense Stick Rollers, Ahmedabad, India
Raju
bhai
Guddu
bhai
Ashok
bhai
Shankar bhai
(contractor)
Garment
Raju bhai,
contractor of
incense stick
Mukesh bhai,
trader of
garments
Guddu bhai
garment trader
Shankar
bhai
(contractor)
Shops to
purchase needle etc
at sarangpur, gomtipur,
bapunagar
Mukesh
bhai
Home-based
workers:
Self-employed
& Sub-contracted
Ashok bhai,
trader of incense
Walking
Auto-
Rs 20
Pays Rs
13/1000
sticks
Pays Rs 12/piece
12-15/day
Pays Rs 13/1000 sticks
Per piece Rs 8/- daily
30 pieces stitched
Per piece Rs 10-20/-
daily 6 pieces stitched
Source: Ahmedabad FG 12
Self-employed home-based workers often buy raw materials from and sell finished goods at different
markets. Consider the case of one focus group in Lahore, Pakistan where there are strong gender-
cum-religious norms restricting women’s mobility. This focus group identified three markets where
they buy and sell goods: Shah Alam Market (a wholesale market) and Anarkali Bazaar (a retail
market) where they buy beads, needles, and thread and sell shirts decorated with beads; and Landa
Bazaar (a second-hand market) where they buy used clothes and sell the thread pulled from the used
clothes. These markets are located in North Lahore while the areas where this group of home-based
workers live and work, Kahna and Kot Lakhpat, are located in South Lahore. Most members of the
group travel long distances – as far as 35 kilometers each way – to buy materials and sell products. It
takes them up to two hours and costs them between 350 and 400 rupees to commute from Kahna or
Kot Lakhpat to the markets. Some of them work through an intermediary who lives near the markets
and who brings raw materials from and takes finished goods to the markets, saving the women
significant time and money. What the IEMS findings do not tell us, however, is the net difference, in
terms of opportunity and direct costs as well as buying and selling prices, between dealing directly
with the markets and working through an intermediary. Also, presumably, relying on an intermediary
limits the ability of the home-based workers to diversify what they sell or capture more of the profit.
1.3.4 Seasonality
Home-based work is often seasonal due largely to the weather and to festival and holiday shopping.
In the survey, 13 per cent of home-based workers reported their work was seasonal: more so in Lahore
(28 per cent) than in Ahmedabad (7 per cent) and in Bangkok (5 per cent). Seven focus groups in
Ahmedabad (both garment makers and incense stick rollers), four focus groups in Bangkok (garment
makers, game board makers, chili paste makers, and plastic waste sorters), and one focus group in
Lahore (garment makers and brush makers) reported that the monsoon rains force them to suspend or
reduce production. They cited several reasons for this: raw materials or finished goods get damaged
when roofs leak or during transport; products (e.g. incense sticks and plastic) cannot dry due to leaks
and humidity; factories, firms, or contractors reduce work orders due to decreased demand and/or
difficulties associated with transport during the rains.
As one home-based worker in Ahmedabad FG 10 – a mixed group of garment makers and incense
stick rollers – put it:
“The poor [kutcha] quality of our housing creates difficulty for our work during the rainy
season. The rain water leaks from the roof into our houses, sometimes causing the cloth or the
18 IEMS Informal Economy Monitoring Study
incense sticks to get wet. If the goods are spoiled, the cost is deducted from our wages by the firm
owner/contractor. Our sewing machines function poorly during the rainy season - this affects
the efficiency of our work. It also affects the output – or quantity – of our work and ultimately
our income.”
In Bangkok, two home-based workers in Focus Group 15 who staple numbers onto game boards
discussed their challenges. The first noted:
“I have difficulty to carry the big sheets [3 x 4 ft.] of cardboard, which is our finished stapling
work, to our contractor’s house. I am afraid that our finished work might be destroyed by the
rain and I will have to pay for the damage. So I put them into a plastic bag.”
The second said:
“If the rain destroys my work, I have to pay 50 baht per piece for the damage instead of getting
50 baht for my wage. It means that I lose 100 baht per piece.”
Festival seasons, in contrast, are periods of high demand and production. A few focus groups and
individual workers mentioned that they intensify or diversify their production before and during festival
seasons – to take advantage of the increased demand. One incense stick roller in Ahmedabad mentioned
that during the rainy season, when she cannot roll incense sticks, she makes sacred thread bracelets
(called rakhi) for a Hindu festival called Raksha Bandhan. During this festival, celebrated during the
monsoon season, sisters tie rakhi on the wrists of their brothers as a ritual gesture to seek protection.
1.3.5 Piece Rates & Earnings
Despite their heterogeneity, home-based workers tend, on average, to have low earnings. In part this
is because they work at home: isolated from other workers in their sector (apart from those in their
neighbourhood) and with limited knowledge of markets, market prices and the economic value of
what they produce (especially if they are sub-contracted). These factors limit their ability to bargain
for better prices or higher piece rates.
The study findings confirm that the piece rates paid to sub-contracted workers tend to be quite low,
especially in Ahmedabad and Lahore. The median piece rate for a specified unit of main products
of the home-based worker sample, reported in the survey and converted into US cents, was 27 cents
in Ahmedabad, 32 cents in Lahore, and 71 cents in Bangkok. Tables 4 and 5 present the piece rates
reported by the focus groups for different garment and non-garment products, including the number
of pieces the home-based worker makes per day, with or without help, and her daily gross earnings.10
Table 4. Piece Rates, Daily Output, and Daily Gross Earnings Reported
by Sub-Contracted Garment Makers, by City
City/Products Piece/Unit rate
Pieces/Units Per Day
(unless otherwise specified)
& Without Help Unless
Specified
Gross Earnings Per
Day (unless otherwise
specified)*
Ahmedabad
Tunic (kameez) 6-7 rupees per piece
30 rupees per dozen
20 (with 1 helper)
1 dozen
140 rupees (USD 2.52)
30 rupees (USD 0.54)
Tunic (punjabi) 6 rupees per piece 30 (with 1 helper) 180 rupees (USD 3.24)
Pant (salwar) 6-7 rupees per piece
40 rupees per dozen
12
NA
72-84 rupees
(USD 1.29-1.51)
NA
Skirt (lehnga) 40 rupees per dozen 6 dozen (with 3 helpers) 240 rupees (USD 4.32)
Petticoat (chania) 2-2.25 rupees per piece 1 dozen 24-27 rupees
(USD 0.43-0.49)
10
	 It is important to note that the reported daily earnings should be seen as gross earnings, not net earnings, since sub-
contracted home-based workers have to cover many of the non-wage costs of production – including workplace, equipment,
supplies, power and transport – out of their piece-rate earnings.
19IEMS Sector Report: Home-Based Workers
Shirt 10 rupees per piece 10 100 rupees (USD 1.80)
Pant 10 rupees per piece 8 80 rupees (USD 1.44)
Frock 80-120 per dozen
(depending on size &
whether patterned)
1 dozen patterned or 2
dozen plain
160-240 rupees
(USD 2.88-4.32)
Women’s
garments
8-20 per piece 6-30 pieces 48-600 rupees
(USD 0.86-10.79)
Infant wear 15 per dozen 10 dozen 150 rupees (USD 2.70)
Underwear 20 per dozen 20 – 25 dozen 400-500 rupees
(USD 7.19-8.99)
Bangkok
Modern
garments
18 – 22 baht per piece 200 pieces per month 3000-4000 baht/month
(USD 95.63—127.51)
Sandals 5-8 baht per pair 4-100 (depends on
other work/family
responsibilities)
20-800 baht
(USD 0.64-25.50)
Lahore
Wedding outfits 800-1000 per outfit 1 outfit per 2-3 days 266-500 rupees
(USD 2.779-5.21)
Shirts & pants 6 rupees per piece 2 dozen 144 rupees (USD 1.50)
Embroidery on
women’s dresses
10 rupees per piece 10
60-70 (with helper)
100-700 rupees
(USD 1.04-7.29)
School uniforms:
shirts & pants
9 rupees per pant & 20
rupees per shirt
55-122 with help 1100 rupees
(USD 11.46)
Shirts 120 rupees per shirt 2 (with 1 helper) 240 rupees (USD 2.50)
Decorative
uppers of shoes
30 rupees per dozen
6 rupees per strip
(1.5 yards) of shoe
decoration
2 – 3 dozen
18 strips (with help)
60-90 rupees
(USD 0.63 -0.94)
108 rupees
(USD 1.13)
Beadwork on
shoe uppers
35 rupees per packet
(packet has 1400 beads)
1 – 2 packets (with help) 35-70 rupees
(USD 0.36 – 0.73)
Shirts 8 – 10 rupees per shirt 3 24 – 30 rupees
(USD 0.25 – 0.31)
Dresses 100 – 150 rupees per
dress
2 200-300 rupees
(USD 2.08-3.13)
Purses 200 rupees per 12 dozen 12 dozen per 2-3 days 200 rupees/2-3 days
(USD 2.14)
Beadwork on
shirts
10 rupees per shirt 3-4 per day (with help) 30-40 rupees
(USD 0.31 – 0.42)
* Note: Currency was converted to USD equivalent, not adjusted for purchasing power parity, using the
prevailing exchange rates on 01 September 2012 per http://www.oanda.com/currency/converter/ as follows:
Indian rupee (55.4834) or 1 rupee = USD .01798
Thai baht (31.2332) or 1 baht = USD .03188
Pakistani rupee (93.4231) or 1 rupee = USD .01042
Source: IEMS Focus Groups (2012)
20 IEMS Informal Economy Monitoring Study
Table 5. Piece Rates, Daily Output, and Daily Gross Earnings Reported
by Sub-Contracted Non-Garment Makers, by City
City/Products Piece/Unit rate
Pieces/Units Per Day (un-
less otherwise specified)
& Without Help (unless
specified)
Gross Earnings Per
Day (unless otherwise
specified)*
Ahmedabad
All incense
sticks (not
differentiated by
type)
12-15 rupees per 1000
(higher if directly
from firm;
lower if through
contractor)
3000-9000 (depending
on hours of work, age of
worker, whether family
helpers)
10,000 – 15,000 (with
helpers)
36-105 rupees
(USD 0.65-1.89)
Oil-based incense
sticks
10-17 rupees per 1000 5000-6000 50- 60 rupees
(USD 0.90 – 1.08)
Water-based
incense sticks
12-14 rupees per 1000 4000-6000 48-72 rupees
(USD 0.86 – 1.29)
Cushion &
pillow covers
10 per dozen 5-6 dozen 50-60 rupees
(USD 0.90 – 1.08)
Handkerchiefs/
lace edging
handkerchiefs
2 per dozen
5 – 6 per piece (includes
cutting cloth)
20-25 dozen
5 – 7
40-50 rupees
(USD 0.72-0.90)
25-42 rupees
(USD 0.45 - 0.76)
Door hangings
(toran)
15 per piece 5 – 7 75-105 rupees
(USD 1.35 – 1.89)
Curtains 12 per piece 5 – 7 60-84
(USD 1.08 – 1.51)
Bangkok
Flower garlands 30 baht per 1000 1000 30 baht (USD 0.96)
Sorting plastic
waste
5 baht per kilo 100 kilo per week 500 baht per week
(USD 15.94)
Diapers 0.25-0.30 baht per piece up to 1000 pieces 250-300 baht
(USD 7.97 – 9.56)
Bags 1-1.30 baht per piece 100-200 pieces 100-260 baht
(USD 3.19-8.29)
Lahore
Shoe boxes 100 rupees per 1000 1000 (with help) 100 rupees (USD 1.04)
Necklaces 7 rupees per dozen 1 dozen per 10-15 days 84 rupees per 10-15
days (USD 0.88)
Pulling threads
– from used
clothing
70 paisa per yard 1 yard 70 paisa
(USD 0.01)
Shopping bags
(paper)
15 rupees per 1000 bags 3000 (with help) 45 rupees
(USD 0.47)
Polyester rolls
for quilts
10 rupees for 1.25 kilos 3-4 “bundles” = 20 kilos 160 rupees
(USD 1.67)
21IEMS Sector Report: Home-Based Workers
Quilts 50 rupees per quilt - -
Handbags &
purses
70 – 80 rupees
per 100 bags
100 (with help) 70-80 rupees
(USD 0.73 – 0.83)
* Note: Currency was converted to USD equivalent, not adjusted for purchasing power parity, using the
prevailing exchange rates on 01 September 2012 per http://www.oanda.com/currency/converter/ as follows:
Indian rupee (55.4834) or 1 rupee = USD .01798
Thai baht (31.2332) or 1 baht = USD .03188
Pakistani rupee (93.4231) or 1 rupee = USD .01042
Source: IEMS Focus Groups (2012)
Table 6 summarizes the range of reported daily gross earnings by city and product category in
US dollars at the prevailing exchange rate when the fieldwork was carried out, not adjusted for
purchasing power parity. Two outliers in Lahore – USD 0.01 per day for pulling threads from used
clothing and USD 0.07 per day for making necklaces – were excluded from the range. Nonetheless,
the range is very wide, especially for garments, in all three cities. The piece rates converted into daily
gross earnings (by estimating how many pieces a home-based worker can make per day) are mostly
between USD 1 and 3 per day. But in each city, some garment makers do very well, presumably
because they are able to produce large quantities usually with help from unpaid family workers or
hired workers, while others do very poorly.
Table 6. Range of Gross Daily Earnings Reported by Sub-Contracted Home-Based Workers,
by Product Type and City (USD)
City/Product Garment Non-Garment
Ahmedabad $0.38 (petticoats) - $9.60
(women's garments)
$0.40 (handkerchiefs) - $1.68 (door hangings)
Bangkok $0.62 (sandals) - $6.20 (modern
garments)
$0.93 (flower garlands) - $9.30 (diapers)
Lahore $0.22 (shirts) - $9.90 (school
uniforms)
$0.41 (paper bags) - $1.44 (quilts)
Source: IEMS Focus Groups (2012)
The survey findings confirm that the median net monthly earnings of home-based workers were
very low in Ahmedabad (USD 27) and especially Lahore (USD 16): see table 7. Indeed, 29 per cent
of the home-based workers in Lahore operated at a loss: see table 8. Also, among the total sample,
one quarter of those who had to pay for transport operated at a loss. Nearly the total sample in
Ahmedabad and two-thirds of the sample in Lahore earned less than USD 100 per month, compared
to around 30 per cent in Bangkok. A far higher percentage of self-employed than sub-contracted
workers earned more than USD 200 per month in both Bangkok and Lahore: see table 9. Also, among
the self-employed in Bangkok and Lahore, those who hired workers for some period in the year
were more likely to operate at a loss but also far more likely to earn more than USD 200 per month,
compared to own account workers or unpaid contributing workers. This finding speaks to both the
entrepreneurial risk and the entrepreneurial potential of growing a business.
Another way to consider the levels of earnings among the home-based workers is to consider intra-
city distributions: specifically, what percentage in each city earns less than two thirds of their city
median or are in the poorest earning quintile of their city distribution.11
Nearly one-third of the total
sample of home-based workers across the three cities earns less than two thirds of their city median
(table 7). In Bangkok, compared to Ahmedabad and Lahore, median earnings are much higher but a
far larger percentage (41 per cent) is clustered well below the median. In other words, earnings are
11
	 Given the diversity of settings and sectors in our sample, earnings are presented in relative terms throughout the report.
Where earnings are presented in USD or adjusted for purchasing power parity (PPP), these figures are meant to be indica-
tive only and should be treated with caution. Comparisons with the $1/day or $1.25/day poverty lines are not made in this
report because the earnings module from the IEMS survey differs significantly from the way in which information on income
and earnings is collected in national household surveys, and only limited information on total household income is collected
in the IEMS questionnaire.
22 IEMS Informal Economy Monitoring Study
higher but more unequally distributed in Bangkok than in the two other cities; while earnings are
lower and more unequally distributed in Lahore compared to Ahmedabad. Status in employment or
product type does not make much difference to the risk of being in the lowest earnings categories.
However, the self-employed are twice as likely to be in the richest earning quintile in their city
compared with the sub-contracted; and garment makers are far more likely to be in the richest
quintile than non-garment makers (table 10).
Table 7. Median Net Monthly Earnings and Work-Related Expenditures by City
Ahmedabad Bangkok Lahore Total
Median monthly net earnings (unadjusted
USD - 2012 prices)
27.36 139.05 15.75 32.30
Median monthly net earnings (PPP adjusted
USD- 2012 prices)
68.39 231.75 39.37 78.75
Median total monthly work-related
expenditure (USD)
3.80 29.16 21.00 12.08
Earn less than 2/3 of their city-sector
median (%)
24.49 41.33 31.33 32.44
N 147 148 139 447
* Median, rather than mean, earnings and expenditures. Work-related expenditures include material inputs,
lights and electricity and transport
Source: IEMS survey data (2012)
Table 8. Levels of Net Monthly Earnings, by City (% distribution)
Ahmedabad Bangkok Lahore Total
Operating at a loss 0.00 7.19 29.05 12.21
Breaking even 0.00 0.72 0.68 0.46
< USD 100 per month 99.32 29.50 63.51 64.75
USD 100-200 per month 0.68 28.06 2.70 10.14
> USD 200 per month 0.00 34.53 4.05 12.44
Total 100.00 100.00 100.00 100.00
N 147 139 148 434
Source: IEMS survey data (2012)
Table 9. Levels of Net Monthly Earnings by Self-Employed and Sub-Contracted
in Bangkok and Lahore (% distribution)
Bangkok Lahore
Self-Employed Sub-Contracted Self-Employed Sub-Contracted
Operating at a loss 14.29 2.41 23.81 32.94
Breaking even 1.79 0.00 1.59 0.00
< USD 100 per month 19.64 36.14 60.32 65.88
USD 100-200 per month 19.64 33.73 4.76 1.18
> USD 200 per month 44.64 27.71 9.52 0.00
Total 100.00 100.00 100.00 100.00
N 56 83 63 85
Source: IEMS survey data (2012)
23IEMS Sector Report: Home-Based Workers
Table 10. City-Level Earnings Distribution by Status in Employment and Product Type (%)
Status in Employment Product Type
Self-Employed Sub-Contracted Non-Garment Garment
Poorest quintile 20.17 21.59 23.56 19.34
Richest quintile 30.25 15.24 14.66 23.05
N 119 315 191 243
Source: IEMS survey data (2012)
Further, it is important to consider earnings variations among home-based workers within each city
by their status in employment, their age group, and their marital status: see table 11. In terms of status
in employment, median net monthly earnings are lower for sub-contracted workers (USD 28.50)
than for the self-employed (USD 63.49). In addition, a slightly higher percentage of sub-contracted
workers (22 per cent) than of self-employed workers (20 per cent) are in the poorest earnings quintiles
of their cities. In terms of age groups, median net monthly earnings are highest (USD 51.84) among
the oldest age group (55+ years); and lowest (USD 25.95) among the 25-34 age group. But the oldest
age group also has the highest percentage (31 per cent) in the poorest earning quintile while the 25-34
age group has a relatively low percentage (14 per cent), second only to the youngest age group (8 per
cent). In terms of marital status, earnings were lowest among widows (USD 18.48) and highest among
divorcees (USD 51.30). Also, widows are disproportionately represented in the poorest earnings
quintile. In sum, these findings suggest a significant dispersion of incomes within each category with
the exception of widows, suggesting the specific vulnerabilities of widows in some societies, notably
in India (Chen 2000).
Table 11. Median Net Monthly Earnings (unadjusted USD) and Percentage in the Poorest Earnings
Quintile by Status in Employment, Age, and Marital Status
Median Monthly Net Earnings
(unadjusted USD)
Poorest Quintile (%)
Status in Employment
Self-employed 63.49 20.00
Sub-contracted 28.50 21.59
Age Group
15-24 31.35 7.69
25-34 25.95 14.06
35-44 31.61 21.23
45-54 34.20 23.73
55+ 51.84 30.77
Marital Status
Married/cohabit 34.20 21.12
Divorced 51.30 0.00
Widowed 18.48 31.37
Never married 22.80 14.89
Source: IEMS survey data (2012)
To sum up, the earnings of the home-based workers in the sample are, on average, quite low and
erratic. Sub-contracted workers earn less on average than self-employed workers. Compared to the
sub-contracted, a roughly equal percentage of the self-employed are in the poorest earning quintile
of their city but a far higher percentage are in the richest earning quintile. These findings reflect the
entrepreneurial risk and potential of self-employment. Compared to those who make other products,
24 IEMS Informal Economy Monitoring Study
garment makers are less likely to be in the poorest earnings quintile and more likely to be in the
richest earning quintile of their city. Among all the home-based workers, in regard to age and marital
status, the likelihood of being in the poorest earnings quintile increases with age but the oldest age
groups (45-54 and 51+) have the highest net monthly earnings; while those who are divorced are least
likely to be in the poorest earnings quintile and enjoy the highest net monthly earnings; followed by
married women.
One concluding thought about the low level and erratic earnings of home-based workers. If we think
of an earnings and expenditure ledger, the net earnings of the home-based workers – both self-
employed and sub-contracted – are subject to costs of production (including workplace, equipment,
utilities, and transport), risks of production (including fluctuating demand, prices and competition as
well as delayed payments), and factors largely out of their control that create work stoppages (including
power outages/load shedding, leaks and flooding of their houses-cum-workplaces, competing
demands on their time). Moreover, home-based workers have limited scope for negotiation or
leverage: due in large part to their isolation but also to exclusionary urban policies or practices as
well as unequal or exploitative value chain dynamics. However, there are some home-based workers
who do relatively well. It is important to learn from their example what would help other home-
based workers earn more. But clearly, reducing the costs and risks of production associated with
home-based work and addressing the structural factors that create work stoppages in homes-cum-
workplaces are of critical importance to all home-based workers.
25IEMS Sector Report: Home-Based Workers
Part 2: Drivers & Responses
The IEMS was designed to investigate how three sets of driving forces affect urban informal workers:
wider economic trends; government policies and practices (specifically, but not exclusively, at the city-
level); and value chain dynamics and relationships. As used in the study, the term “driving forces”
refers to systemic factors that may impact, in either positive or negative ways, on the occupations or
livelihoods of urban informal workers. The study also explored how the informal workers respond
to the various driving forces, and which institutions help or hinder the ability of informal workers
to respond effectively to these driving forces. Further, the study tested a set of hypotheses about the
nature and behaviour of the urban informal economy and its relationship to the formal economy.
Both study methods – focus group tools and the survey questionnaire – were used to investigate
the driving forces and responses. In the focus groups, as opposed to the survey questionnaire, the
options were not pre-defined: the participants were asked to specify whether and how the three sets
of driving forces affected them and then to rank which driving forces had the greatest impact on their
work, either negative or positive. The focus groups ranked more driving forces as negative rather
than positive. But they also ranked many driving forces as both negative and positive.
Table 12 presents the frequency with which the three sets of driving forces – the wider economy,
government policies and practices, and value chain dynamics – were ranked as major negative or
positive forces by the 15 focus groups in each study city.
IncenserollerinAhmedabad.Photo:L.Vryenhoek
26 IEMS Informal Economy Monitoring Study
Table 12. Ranking of Three Sets of Driving Forces as Negative (-) or Positive (+)
by City (# of Focus Groups)
Driving Forces Ahmedabad Bangkok Lahore Total
- + - + - + - +
Wider economic trends 0 1 16 4 16 0 32 5
Government/City policies 20 10 13 18 24 16 57 44
Value chain dynamics 25 0 11 16 3 0 39 16
Other 0 0 0 1 1 1 1 2
Source: 45 IEMS Focus Groups (2012)
The top ranked negative forces were inflation, prioritized by 22 focus groups (14 in Lahore, 5 in
Bangkok, 3 in Ahmedabad), and shortages-cum-high cost of electricity, prioritized by 21 focus
groups (15 in Lahore, 6 in Ahmedabad). Other major negative forces included: inadequate housing,
prioritized by 17 groups (11 in Ahmedabad, 5 in Bangkok, 1 in Lahore); recession or low demand,
prioritized by 13 focus groups (11 in Bangkok, 2 in Lahore); and low earnings (for the self-employed)
or low piece rates (for the sub-contracted), prioritized by 12 focus groups (11 in Ahmedabad, 1 in
Lahore). The top ranked positive forces were infrastructure services (electricity in Bangkok; roads,
water and sanitation in Lahore), free education and health (in Bangkok), and regular orders or
customers (also only in Bangkok).
The survey findings also present a mixed picture: see table 13. Well over two thirds of the respondents
(69 per cent) reported the inability to bargain was a key negative force. Over half (53 per cent)
reported increased competition. Well over half (57 per cent) reported low prices of finished goods
while nearly half (47 per cent) reported high prices of raw materials. One third (33 per cent) reported
that the lack of basic infrastructure services was a key negative force. Roughly equal percentages
reported increased and decreased work orders (around 30 per cent each) or increased and decreased
customers/buyers (around 25 per cent each).
Table 13. Key Driving Forces by Self-Employed and Sub-Contracted (%)
Self-Employed Sub-Contracted All HBWs
Decreased demand (work orders) 31.45 32.26 32.03
Increased demand (work orders) 30.65 30.32 30.41
Decreased demand (customers/buyers) 25.64 22.30 23.83
Increased demand (customers/buyers) 29.06 23.74 26.17
High cost of raw materials 68.22* 37.66 46.52
Low price of finished goods 63.57 54.11 56.85
More competition 38.60* 58.54 52.87
Less competition 12.28 6.97 8.48
Lack of basic infrastructure 26.36* 36.39 33.48
Difficulty transporting goods to market 24.03* 15.24 17.79
Inability to bargain 56.59* 73.42 68.54
N 129 315 444
*Statistically significant at the .05 level.
Note: Respondents could identify more than one driving force
Source: IEMS survey data (2012)
27IEMS Sector Report: Home-Based Workers
To sum up, several key points about the driving forces should be noted. First, while negative findings
outweighed positive findings, the results were mixed. Second, the key driving forces prioritized
by the focus groups – both negative and positive – differed significantly by city. Indeed, a distinct
negative driving force seems emblematic of each city: inadequate housing in Ahmedabad, floods in
Bangkok, and an acute electricity crisis in Lahore. The study findings reflect the overall situation in
the study cities. In Ahmedabad, there are a number of large-scale urban renewal projects associated
with evictions and relocations across the city. Bangkok, the capital city of an upper middle income
country, has better infrastructure than the other two cities, both of which are non-capital cities of
lower middle income countries.12
But there was severe flooding in much of Thailand in 2011. All of
Pakistan, not just Lahore, is facing an acute energy crisis.
Finally, from the survey findings, it is clear that the key negative driving forces are different for
self-employed and sub-contracted workers. A significantly higher percentage of the self-employed
reported the high cost of raw materials and transporting goods as problems. This is because the
self-employed have to buy raw materials and supplies (while the sub-contracted have to buy only a
limited set of supplies) and, also, the self-employed have to commute/transport goods to markets
more frequently than sub-contracted workers. A significantly higher percentage of sub-contracted
workers identified increased competition, basic infrastructure problems, and the inability to bargain
as key barriers. The sub-contracted have less experience in bargaining than the self-employed who
have to bargain with suppliers and buyers on a regular basis. Ahmedabad, where the sample is all
sub-contracted, is the one city where the focus groups did not rank any infrastructure services as
positive: this may help explain why, in the total sample across the three cities, more sub-contracted
than self-employed workers prioritized basic infrastructure problems.
This section starts with a discussion of the main negative driving forces prioritized by the focus
groups. It analyzes the impact of these forces on the home-based workers, their work, and families,
then summarizes the responses by the home-based workers to these forces.
2.1 Drivers
2.1.1 Macroeconomic Trends
In all three countries, economic growth slowed down significantly during 2008, the year that marked
the beginning of the Great Recession. The Indian economy rebounded significantly during 2009
and 2010, slowed down in 2011 and then declined markedly during 2012. The Pakistan economy
recovered slowly but not to its pre-crisis level of growth. The Thai economy proved quite volatile:
experiencing negative growth in 2009, a notable rebound in 2010, another slump in 2011 (severe
floods inundated much of the country during the second half of the year), and another rebound in
2012 to above its pre-crisis level of growth: see table 14.
Inflation increased in all three countries between 2007 and 2012. Inflation in India increased steadily
to double-digit levels in 2009 and 2010, went down a bit in 2011 and then up a bit in 2012 to just over
9 per cent. In Pakistan, inflation increased dramatically during 2008 (to over 20 per cent), remained at
double-digit levels (in the teens) for three years, and then declined to just under 10 per cent in 2012. In
Thailand, inflation went up in 2008, dropped dramatically in 2009 (to -0.9 per cent) and then tapered
off at 3 per cent in 2012, slightly higher than the pre-crisis level: see table 14.
12
	 Thailand is an upper middle income country while India and Pakistan are lower middle income countries, reflected in their
gross national income (GNI) per capita.
GNI Per Capita GNI Per Capita, adjusted for
purchasing power parity
India USD 1,580 USD 3,640
Pakistan USD 1,260 USD 2,750
Thailand USD 5,210 USD 8,620
Source: World Bank 2011
28 IEMS Informal Economy Monitoring Study
Table 14. GDP Growth Rate and Inflation: India, Pakistan & Thailand 2007-2012
GDP Growth Rate (annual %) Inflation, Consumer Prices (annual %)
2007 2008 2009 2010 2011 2012 2007 2008 2009 2010 2011 2012
India 9.8 3.9 8.5 10.5 6.3 3.2 6.4 8.4 10.9 12 8.9 9.3
Pakistan 5.7 1.6 3.6 3.5 3 4.2 7.6 20.3 13.6 13.9 11.9 9.7
Thailand 5 2.5 -2.3 7.8 0.1 6.4 2.3 5.4 -0.9 3.3 3.8 3
Sources: The World Bank, website: http://data.worldbank.org/indicator/NY.GDP.MKTP.KD.ZG; http://data.
worldbank.org/indicator/FP.CPI.TOTL.ZG; and http://data.worldbank.org/indicator/SL.UEM.TOTL.ZS
The findings from the focus groups and survey, conducted in August and September 2012, indicate
that these aggregate economic patterns were mirrored at the base of the economy. The macroeconomic
trends were both experienced by and understood by the home-based workers in the sample.
Table 15. Wider Economy: Negative and Positive Driving Forces by City (# of focus groups)
Driving Forces Ahmedabad Bangkok Lahore Total
Negative
Inflation 3 5 14 22
Recession/Low demand 0 11 2 13
Increased competition 0 3 0 3
Totals 3 19 16 38
Positive
Strong demand (especially during festivals) 1 4 0 5
Totals 1 4 0 5
Source: 45 IEMS Focus Groups (2012)
Inflation
Across the three cities, nearly half (47 per cent) of the survey respondents cited the high cost of inputs
as a problem: see table 13. In Bangkok and Lahore, where the sample includes both self-employed and
sub-contracted workers, over half of the sample reported that the high cost of inputs was a problem.
Inflation was prioritized as a major driving force by 14 (93 per cent) of the focus groups in Lahore and
5 (33 per cent) of the focus groups in Bangkok: see table 15. The impact of inflation as a major negative
driving force in Lahore was captured in the phrase “inflation is killing us” (Lahore FG 1). Three of
the focus groups in Ahmedabad prioritized inflation as a negative driving force and two other focus
groups discussed inflation without prioritizing it. The key informants interviewed in Ahmedabad also
mentioned that inflation, especially the high cost of food, water, and energy, was forcing many would-
be customers to avoid buying clothing and other non-essentials. In other words, according to the
key informants, inflation was lowering demand: this may help explain the high percentage of focus
groups in Ahmedabad (73 per cent) that ranked low earnings as a significant negative driver.
In Bangkok, five focus groups ranked inflation as a major driving force. One group, all self-employed
dress makers, discussed the impact of increased prices in their sector (FG 12). One of the women
began the discussion with the following observation: “The prices of raw materials and dressmaking
equipment and accessories have increased but the wages for dressmaking have still not increased.” Another
added ruefully: “The labour cost for making dresses hasn’t increased for almost 20 years.” Two others
commented on the need for capital in the dress-making sector. “To order a dress the customer needs a lot
of money,” said one. The second noted: “To make a dress we need more money than in the past. On the other
hand, our capacity to invest is reduced.”
Iems sector report home based workers full report

More Related Content

More from Bilal Naqeeb

World Happiness Report 2018
World Happiness Report 2018World Happiness Report 2018
World Happiness Report 2018Bilal Naqeeb
 
Universal Declaration of Human Rights (Child-Friendly Version)
Universal Declaration of Human Rights (Child-Friendly Version)Universal Declaration of Human Rights (Child-Friendly Version)
Universal Declaration of Human Rights (Child-Friendly Version)Bilal Naqeeb
 
Sustainable Development Goals (with Urdu Translation)
Sustainable Development Goals (with Urdu Translation)Sustainable Development Goals (with Urdu Translation)
Sustainable Development Goals (with Urdu Translation)Bilal Naqeeb
 
Gold Price History in Pakistan (1947 2017)
Gold Price History in Pakistan (1947   2017)Gold Price History in Pakistan (1947   2017)
Gold Price History in Pakistan (1947 2017)Bilal Naqeeb
 
Pakistan General Elections (1997 - 2013)
Pakistan General Elections (1997 - 2013)Pakistan General Elections (1997 - 2013)
Pakistan General Elections (1997 - 2013)Bilal Naqeeb
 
Chiefs of Army Staff (Pakistan)
Chiefs of Army Staff (Pakistan)Chiefs of Army Staff (Pakistan)
Chiefs of Army Staff (Pakistan)Bilal Naqeeb
 
Prime Ministers of pakistan
Prime Ministers of pakistanPrime Ministers of pakistan
Prime Ministers of pakistanBilal Naqeeb
 
Pakistan Census 2017
Pakistan Census 2017Pakistan Census 2017
Pakistan Census 2017Bilal Naqeeb
 
Illustrations of selected Urdu poetry
Illustrations of selected Urdu poetryIllustrations of selected Urdu poetry
Illustrations of selected Urdu poetryBilal Naqeeb
 
Pakitsan's Governance Timeline (Presidents, Prime Ministers, COAS and CJs)
Pakitsan's Governance Timeline (Presidents, Prime Ministers, COAS and CJs)Pakitsan's Governance Timeline (Presidents, Prime Ministers, COAS and CJs)
Pakitsan's Governance Timeline (Presidents, Prime Ministers, COAS and CJs)Bilal Naqeeb
 
PROMOTING PEACE AND TOLERANCE THROUGH SOCIAL MEDIA
PROMOTING PEACE AND TOLERANCE THROUGH SOCIAL MEDIAPROMOTING PEACE AND TOLERANCE THROUGH SOCIAL MEDIA
PROMOTING PEACE AND TOLERANCE THROUGH SOCIAL MEDIABilal Naqeeb
 
Guide to Gender-Sensitive Indicators
Guide to Gender-Sensitive IndicatorsGuide to Gender-Sensitive Indicators
Guide to Gender-Sensitive IndicatorsBilal Naqeeb
 
Personality types and styles of conflict management
Personality types and styles of conflict managementPersonality types and styles of conflict management
Personality types and styles of conflict managementBilal Naqeeb
 
SPO A Brief History, Compiled by: Bilal Naqeeb
SPO A Brief History, Compiled by: Bilal NaqeebSPO A Brief History, Compiled by: Bilal Naqeeb
SPO A Brief History, Compiled by: Bilal NaqeebBilal Naqeeb
 
100 ways to energise groups: Games to use in workshops, meetings and the comm...
100 ways to energise groups: Games to use in workshops, meetings and the comm...100 ways to energise groups: Games to use in workshops, meetings and the comm...
100 ways to energise groups: Games to use in workshops, meetings and the comm...Bilal Naqeeb
 
Basic listening skills
Basic listening skillsBasic listening skills
Basic listening skillsBilal Naqeeb
 
Social Demand of Development
Social Demand of DevelopmentSocial Demand of Development
Social Demand of DevelopmentBilal Naqeeb
 
Behavior Change Communication
Behavior Change CommunicationBehavior Change Communication
Behavior Change CommunicationBilal Naqeeb
 
Constitution of pakistan as of 28 february 2012
Constitution of pakistan as of 28 february 2012Constitution of pakistan as of 28 february 2012
Constitution of pakistan as of 28 february 2012Bilal Naqeeb
 

More from Bilal Naqeeb (20)

World Happiness Report 2018
World Happiness Report 2018World Happiness Report 2018
World Happiness Report 2018
 
Universal Declaration of Human Rights (Child-Friendly Version)
Universal Declaration of Human Rights (Child-Friendly Version)Universal Declaration of Human Rights (Child-Friendly Version)
Universal Declaration of Human Rights (Child-Friendly Version)
 
Sustainable Development Goals (with Urdu Translation)
Sustainable Development Goals (with Urdu Translation)Sustainable Development Goals (with Urdu Translation)
Sustainable Development Goals (with Urdu Translation)
 
Gold Price History in Pakistan (1947 2017)
Gold Price History in Pakistan (1947   2017)Gold Price History in Pakistan (1947   2017)
Gold Price History in Pakistan (1947 2017)
 
Pakistan General Elections (1997 - 2013)
Pakistan General Elections (1997 - 2013)Pakistan General Elections (1997 - 2013)
Pakistan General Elections (1997 - 2013)
 
Chiefs of Army Staff (Pakistan)
Chiefs of Army Staff (Pakistan)Chiefs of Army Staff (Pakistan)
Chiefs of Army Staff (Pakistan)
 
Prime Ministers of pakistan
Prime Ministers of pakistanPrime Ministers of pakistan
Prime Ministers of pakistan
 
Pakistan Census 2017
Pakistan Census 2017Pakistan Census 2017
Pakistan Census 2017
 
Illustrations of selected Urdu poetry
Illustrations of selected Urdu poetryIllustrations of selected Urdu poetry
Illustrations of selected Urdu poetry
 
Pakitsan's Governance Timeline (Presidents, Prime Ministers, COAS and CJs)
Pakitsan's Governance Timeline (Presidents, Prime Ministers, COAS and CJs)Pakitsan's Governance Timeline (Presidents, Prime Ministers, COAS and CJs)
Pakitsan's Governance Timeline (Presidents, Prime Ministers, COAS and CJs)
 
PROMOTING PEACE AND TOLERANCE THROUGH SOCIAL MEDIA
PROMOTING PEACE AND TOLERANCE THROUGH SOCIAL MEDIAPROMOTING PEACE AND TOLERANCE THROUGH SOCIAL MEDIA
PROMOTING PEACE AND TOLERANCE THROUGH SOCIAL MEDIA
 
Guide to Gender-Sensitive Indicators
Guide to Gender-Sensitive IndicatorsGuide to Gender-Sensitive Indicators
Guide to Gender-Sensitive Indicators
 
Mediation skills
Mediation skillsMediation skills
Mediation skills
 
Personality types and styles of conflict management
Personality types and styles of conflict managementPersonality types and styles of conflict management
Personality types and styles of conflict management
 
SPO A Brief History, Compiled by: Bilal Naqeeb
SPO A Brief History, Compiled by: Bilal NaqeebSPO A Brief History, Compiled by: Bilal Naqeeb
SPO A Brief History, Compiled by: Bilal Naqeeb
 
100 ways to energise groups: Games to use in workshops, meetings and the comm...
100 ways to energise groups: Games to use in workshops, meetings and the comm...100 ways to energise groups: Games to use in workshops, meetings and the comm...
100 ways to energise groups: Games to use in workshops, meetings and the comm...
 
Basic listening skills
Basic listening skillsBasic listening skills
Basic listening skills
 
Social Demand of Development
Social Demand of DevelopmentSocial Demand of Development
Social Demand of Development
 
Behavior Change Communication
Behavior Change CommunicationBehavior Change Communication
Behavior Change Communication
 
Constitution of pakistan as of 28 february 2012
Constitution of pakistan as of 28 february 2012Constitution of pakistan as of 28 february 2012
Constitution of pakistan as of 28 february 2012
 

Recently uploaded

Monastic-Supremacy-in-the-Philippines-_20240328_092725_0000.pdf
Monastic-Supremacy-in-the-Philippines-_20240328_092725_0000.pdfMonastic-Supremacy-in-the-Philippines-_20240328_092725_0000.pdf
Monastic-Supremacy-in-the-Philippines-_20240328_092725_0000.pdfCharlynTorres1
 
productionpost-productiondiary-240320114322-5004daf6.pptx
productionpost-productiondiary-240320114322-5004daf6.pptxproductionpost-productiondiary-240320114322-5004daf6.pptx
productionpost-productiondiary-240320114322-5004daf6.pptxHenryBriggs2
 
2023 Ecological Profile of Ilocos Norte.pdf
2023 Ecological Profile of Ilocos Norte.pdf2023 Ecological Profile of Ilocos Norte.pdf
2023 Ecological Profile of Ilocos Norte.pdfilocosnortegovph
 
2024: The FAR, Federal Acquisition Regulations - Part 26
2024: The FAR, Federal Acquisition Regulations - Part 262024: The FAR, Federal Acquisition Regulations - Part 26
2024: The FAR, Federal Acquisition Regulations - Part 26JSchaus & Associates
 
Disciplines-and-Ideas-in-the-Applied-Social-Sciences-DLP-.pdf
Disciplines-and-Ideas-in-the-Applied-Social-Sciences-DLP-.pdfDisciplines-and-Ideas-in-the-Applied-Social-Sciences-DLP-.pdf
Disciplines-and-Ideas-in-the-Applied-Social-Sciences-DLP-.pdfDeLeon9
 
How to design healthy team dynamics to deliver successful digital projects.pptx
How to design healthy team dynamics to deliver successful digital projects.pptxHow to design healthy team dynamics to deliver successful digital projects.pptx
How to design healthy team dynamics to deliver successful digital projects.pptxTechSoupConnectLondo
 
YHR Fall 2023 Issue (Joseph Manning Interview) (2).pdf
YHR Fall 2023 Issue (Joseph Manning Interview) (2).pdfYHR Fall 2023 Issue (Joseph Manning Interview) (2).pdf
YHR Fall 2023 Issue (Joseph Manning Interview) (2).pdfyalehistoricalreview
 
Start Donating your Old Clothes to Poor People
Start Donating your Old Clothes to Poor PeopleStart Donating your Old Clothes to Poor People
Start Donating your Old Clothes to Poor PeopleSERUDS INDIA
 
history of 1935 philippine constitution.pptx
history of 1935 philippine constitution.pptxhistory of 1935 philippine constitution.pptx
history of 1935 philippine constitution.pptxhellokittymaearciaga
 
2024: The FAR, Federal Acquisition Regulations - Part 27
2024: The FAR, Federal Acquisition Regulations - Part 272024: The FAR, Federal Acquisition Regulations - Part 27
2024: The FAR, Federal Acquisition Regulations - Part 27JSchaus & Associates
 
call girls in Kirti Nagar DELHI 🔝 >༒9540349809 🔝 genuine Escort Service 🔝✔️✔️
call girls in Kirti Nagar DELHI 🔝 >༒9540349809 🔝 genuine Escort Service 🔝✔️✔️call girls in Kirti Nagar DELHI 🔝 >༒9540349809 🔝 genuine Escort Service 🔝✔️✔️
call girls in Kirti Nagar DELHI 🔝 >༒9540349809 🔝 genuine Escort Service 🔝✔️✔️saminamagar
 
Call Girl Benson Town - Phone No 7001305949 For Ultimate Sexual Urges
Call Girl Benson Town - Phone No 7001305949 For Ultimate Sexual UrgesCall Girl Benson Town - Phone No 7001305949 For Ultimate Sexual Urges
Call Girl Benson Town - Phone No 7001305949 For Ultimate Sexual Urgesnarwatsonia7
 
Action Toolkit - Earth Day 2024 - April 22nd.
Action Toolkit - Earth Day 2024 - April 22nd.Action Toolkit - Earth Day 2024 - April 22nd.
Action Toolkit - Earth Day 2024 - April 22nd.Christina Parmionova
 
“Exploring the world: One page turn at a time.” World Book and Copyright Day ...
“Exploring the world: One page turn at a time.” World Book and Copyright Day ...“Exploring the world: One page turn at a time.” World Book and Copyright Day ...
“Exploring the world: One page turn at a time.” World Book and Copyright Day ...Christina Parmionova
 
call girls in Mehrauli DELHI 🔝 >༒9540349809 🔝 genuine Escort Service 🔝✔️✔️
call girls in Mehrauli  DELHI 🔝 >༒9540349809 🔝 genuine Escort Service 🔝✔️✔️call girls in Mehrauli  DELHI 🔝 >༒9540349809 🔝 genuine Escort Service 🔝✔️✔️
call girls in Mehrauli DELHI 🔝 >༒9540349809 🔝 genuine Escort Service 🔝✔️✔️saminamagar
 
call girls in Vasant Kunj DELHI 🔝 >༒9540349809 🔝 genuine Escort Service 🔝✔️✔️
call girls in Vasant Kunj DELHI 🔝 >༒9540349809 🔝 genuine Escort Service 🔝✔️✔️call girls in Vasant Kunj DELHI 🔝 >༒9540349809 🔝 genuine Escort Service 🔝✔️✔️
call girls in Vasant Kunj DELHI 🔝 >༒9540349809 🔝 genuine Escort Service 🔝✔️✔️saminamagar
 
Call Girls Service AECS Layout Just Call 7001305949 Enjoy College Girls Service
Call Girls Service AECS Layout Just Call 7001305949 Enjoy College Girls ServiceCall Girls Service AECS Layout Just Call 7001305949 Enjoy College Girls Service
Call Girls Service AECS Layout Just Call 7001305949 Enjoy College Girls Servicenarwatsonia7
 
call girls in Mukherjee Nagar DELHI 🔝 >༒9540349809 🔝 genuine Escort Service 🔝...
call girls in Mukherjee Nagar DELHI 🔝 >༒9540349809 🔝 genuine Escort Service 🔝...call girls in Mukherjee Nagar DELHI 🔝 >༒9540349809 🔝 genuine Escort Service 🔝...
call girls in Mukherjee Nagar DELHI 🔝 >༒9540349809 🔝 genuine Escort Service 🔝...saminamagar
 
call girls in Laxmi Nagar DELHI 🔝 >༒9540349809 🔝 genuine Escort Service 🔝✔️✔️
call girls in Laxmi Nagar DELHI 🔝 >༒9540349809 🔝 genuine Escort Service 🔝✔️✔️call girls in Laxmi Nagar DELHI 🔝 >༒9540349809 🔝 genuine Escort Service 🔝✔️✔️
call girls in Laxmi Nagar DELHI 🔝 >༒9540349809 🔝 genuine Escort Service 🔝✔️✔️saminamagar
 

Recently uploaded (20)

Monastic-Supremacy-in-the-Philippines-_20240328_092725_0000.pdf
Monastic-Supremacy-in-the-Philippines-_20240328_092725_0000.pdfMonastic-Supremacy-in-the-Philippines-_20240328_092725_0000.pdf
Monastic-Supremacy-in-the-Philippines-_20240328_092725_0000.pdf
 
productionpost-productiondiary-240320114322-5004daf6.pptx
productionpost-productiondiary-240320114322-5004daf6.pptxproductionpost-productiondiary-240320114322-5004daf6.pptx
productionpost-productiondiary-240320114322-5004daf6.pptx
 
2023 Ecological Profile of Ilocos Norte.pdf
2023 Ecological Profile of Ilocos Norte.pdf2023 Ecological Profile of Ilocos Norte.pdf
2023 Ecological Profile of Ilocos Norte.pdf
 
2024: The FAR, Federal Acquisition Regulations - Part 26
2024: The FAR, Federal Acquisition Regulations - Part 262024: The FAR, Federal Acquisition Regulations - Part 26
2024: The FAR, Federal Acquisition Regulations - Part 26
 
Disciplines-and-Ideas-in-the-Applied-Social-Sciences-DLP-.pdf
Disciplines-and-Ideas-in-the-Applied-Social-Sciences-DLP-.pdfDisciplines-and-Ideas-in-the-Applied-Social-Sciences-DLP-.pdf
Disciplines-and-Ideas-in-the-Applied-Social-Sciences-DLP-.pdf
 
How to design healthy team dynamics to deliver successful digital projects.pptx
How to design healthy team dynamics to deliver successful digital projects.pptxHow to design healthy team dynamics to deliver successful digital projects.pptx
How to design healthy team dynamics to deliver successful digital projects.pptx
 
YHR Fall 2023 Issue (Joseph Manning Interview) (2).pdf
YHR Fall 2023 Issue (Joseph Manning Interview) (2).pdfYHR Fall 2023 Issue (Joseph Manning Interview) (2).pdf
YHR Fall 2023 Issue (Joseph Manning Interview) (2).pdf
 
Start Donating your Old Clothes to Poor People
Start Donating your Old Clothes to Poor PeopleStart Donating your Old Clothes to Poor People
Start Donating your Old Clothes to Poor People
 
history of 1935 philippine constitution.pptx
history of 1935 philippine constitution.pptxhistory of 1935 philippine constitution.pptx
history of 1935 philippine constitution.pptx
 
2024: The FAR, Federal Acquisition Regulations - Part 27
2024: The FAR, Federal Acquisition Regulations - Part 272024: The FAR, Federal Acquisition Regulations - Part 27
2024: The FAR, Federal Acquisition Regulations - Part 27
 
call girls in Kirti Nagar DELHI 🔝 >༒9540349809 🔝 genuine Escort Service 🔝✔️✔️
call girls in Kirti Nagar DELHI 🔝 >༒9540349809 🔝 genuine Escort Service 🔝✔️✔️call girls in Kirti Nagar DELHI 🔝 >༒9540349809 🔝 genuine Escort Service 🔝✔️✔️
call girls in Kirti Nagar DELHI 🔝 >༒9540349809 🔝 genuine Escort Service 🔝✔️✔️
 
Call Girl Benson Town - Phone No 7001305949 For Ultimate Sexual Urges
Call Girl Benson Town - Phone No 7001305949 For Ultimate Sexual UrgesCall Girl Benson Town - Phone No 7001305949 For Ultimate Sexual Urges
Call Girl Benson Town - Phone No 7001305949 For Ultimate Sexual Urges
 
Action Toolkit - Earth Day 2024 - April 22nd.
Action Toolkit - Earth Day 2024 - April 22nd.Action Toolkit - Earth Day 2024 - April 22nd.
Action Toolkit - Earth Day 2024 - April 22nd.
 
“Exploring the world: One page turn at a time.” World Book and Copyright Day ...
“Exploring the world: One page turn at a time.” World Book and Copyright Day ...“Exploring the world: One page turn at a time.” World Book and Copyright Day ...
“Exploring the world: One page turn at a time.” World Book and Copyright Day ...
 
9953330565 Low Rate Call Girls In Adarsh Nagar Delhi NCR
9953330565 Low Rate Call Girls In Adarsh Nagar Delhi NCR9953330565 Low Rate Call Girls In Adarsh Nagar Delhi NCR
9953330565 Low Rate Call Girls In Adarsh Nagar Delhi NCR
 
call girls in Mehrauli DELHI 🔝 >༒9540349809 🔝 genuine Escort Service 🔝✔️✔️
call girls in Mehrauli  DELHI 🔝 >༒9540349809 🔝 genuine Escort Service 🔝✔️✔️call girls in Mehrauli  DELHI 🔝 >༒9540349809 🔝 genuine Escort Service 🔝✔️✔️
call girls in Mehrauli DELHI 🔝 >༒9540349809 🔝 genuine Escort Service 🔝✔️✔️
 
call girls in Vasant Kunj DELHI 🔝 >༒9540349809 🔝 genuine Escort Service 🔝✔️✔️
call girls in Vasant Kunj DELHI 🔝 >༒9540349809 🔝 genuine Escort Service 🔝✔️✔️call girls in Vasant Kunj DELHI 🔝 >༒9540349809 🔝 genuine Escort Service 🔝✔️✔️
call girls in Vasant Kunj DELHI 🔝 >༒9540349809 🔝 genuine Escort Service 🔝✔️✔️
 
Call Girls Service AECS Layout Just Call 7001305949 Enjoy College Girls Service
Call Girls Service AECS Layout Just Call 7001305949 Enjoy College Girls ServiceCall Girls Service AECS Layout Just Call 7001305949 Enjoy College Girls Service
Call Girls Service AECS Layout Just Call 7001305949 Enjoy College Girls Service
 
call girls in Mukherjee Nagar DELHI 🔝 >༒9540349809 🔝 genuine Escort Service 🔝...
call girls in Mukherjee Nagar DELHI 🔝 >༒9540349809 🔝 genuine Escort Service 🔝...call girls in Mukherjee Nagar DELHI 🔝 >༒9540349809 🔝 genuine Escort Service 🔝...
call girls in Mukherjee Nagar DELHI 🔝 >༒9540349809 🔝 genuine Escort Service 🔝...
 
call girls in Laxmi Nagar DELHI 🔝 >༒9540349809 🔝 genuine Escort Service 🔝✔️✔️
call girls in Laxmi Nagar DELHI 🔝 >༒9540349809 🔝 genuine Escort Service 🔝✔️✔️call girls in Laxmi Nagar DELHI 🔝 >༒9540349809 🔝 genuine Escort Service 🔝✔️✔️
call girls in Laxmi Nagar DELHI 🔝 >༒9540349809 🔝 genuine Escort Service 🔝✔️✔️
 

Iems sector report home based workers full report

  • 1. by Martha Alter Chen April 2014 IEMSInformal Economy Monitoring StudyIEMSInformal Economy Monitoring Study Informal Economy Monitoring Study Sector Report: Home-Based Workers
  • 2. Informal Economy Monitoring Study Sector Report: Home-Based Workers Author Martha (Marty) Alter Chen is a co-founder and the International Coordinator of WIEGO, as well as a Lecturer in Public Policy at the Harvard Kennedy School, and an Affiliated Professor at the Harvard Graduate School of Design. An experienced development practitioner and scholar, Marty’s areas of specialization are employment, gender, and poverty with a focus on the working poor in the informal economy. Acknowledgements Special thanks are due to the local research partners and research teams in each city whose knowledge of home- based workers and their respective cities were so critical to the success of the Informal Economy Monitoring Study. In Ahmedabad, the research partner was the Self-Employed Women’s Association (SEWA). Manali Shah, Mansi Shah, and Shalini Trivedi from the SEWA Union coordinated the study. The local research team from CEPT University were Darshini Mahadevia, Aseem Mishra, and Suchita Vyas. In Bangkok, the research partner was HomeNet Thailand. Suanmuang (Poonsap) Tulaphan of HomeNet Thailand coordinated the research and served as one of the qualitative researchers and MBO representatives. The local research team consisted of Sayamol Charoenratan, Amornrat Kaewsing, Boonsom Namsomboon, Chidchanok Samantrakul, and Suanmuang Tulaphan. In Lahore, the research partner was HomeNet Pakistan, represented by Ume-Laila Azhar who coordinated the research. The local research team were Bilal Naqeeb, Rubina Saigol, Kishwar Sultana, and Reema Kamal. Special thanks are also due to Caroline Moser, Angélica Acosta, and Irene Vance who helped design the qualitative tools and train the local research teams. Thanks are also due to the WIEGO team members who served on the IEMS Technical Advisory Committee (TAC) during Years 1 and 2 of the study: Marty Chen (IEMS TAC Chair), Imraan Valodia (IEMS Director), Sally Roever (IEMS Qualitative Research Coordinator), Michael Rogan (IEMS Quantitative Research Coordinator), and Zoe Horn (IEMS MBO Coordinator) as well as Sonia Dias, Rhonda Douglas, Francie Lund, Melanie Samson, Shalini Sinha, and Caroline Skinner. Marty Chen, Zoe Horn, and Imraan Valodia provided special oversight to the field research and data analysis in Ahmedabad, Bangkok and Lahore, respectively. Thanks are also due to Leslie Vryenhoek, WIEGO’s editor, who so ably edited 13 IEMS City Reports and the three IEMS Sector Reports, including this report, and prepared advocacy materials based on each report. Thanks also to Demetria Tsoutouras who oversaw the production of the reports, to Olga Abizaid who edited the three Latin American reports and prepared the advocacy materials based on these, and to other members of the Communications Team involved in all the stages of production. Last, but hardly least, special thanks are due to the home-based workers in Ahmedabad, Bangkok, and Lahore, who opened their lives and work to the research team. Publication date: April 2014 ISBN number: 978-92-95095-82-3 Published by Women in Informal Employment: Globalizing and Organizing (WIEGO). A Charitable Company Limited by Guarantee – Company No. 6273538, Registered Charity No. 1143510 WIEGO Secretariat WIEGO Limited Harvard University 521 Royal Exchange 79 John F. Kennedy Street Manchester M2 7EN Cambridge, MA 02138, USA United Kingdom www.wiego.org Copyright © WIEGO. This report can be replicated for educational, organizing and policy purposes as long as the source is acknowledged. Full citation: Chen, Martha Alter. 2014. Informal Economy Monitoring Study Sector Report: Home-Based Workers. Cambridge, MA, USA: WIEGO. Cover photographs by: HomeNet Pakistan, Ms. Supranee Tubsakul, Martha Chen Design by: Julian Luckham of Luckham Creative
  • 3. About the Informal Economy Monitoring Study The Informal Economy Monitoring Study (IEMS) is a major, longitudinal study of the urban informal economy being undertaken initially at two points in time, 2012 and 2016, in 10 cities around the world: Accra, Ghana; Ahmedabad, India; Bangkok, Thailand; Belo Horizonte, Brazil; Bogota, Colombia; Durban, South Africa; Lahore, Pakistan; Lima, Peru; Nakuru, Kenya; and Pune, India. The study combines qualitative and quantitative research methods to provide an in-depth understanding of how three groups of urban informal workers – home-based workers, street vendors, and waste pickers – are affected by and respond to economic trends, urban policies and practices, value chain dynamics, and other economic and social forces. The IEMS will generate panel data on the urban informal economy. In each city, a team of five researchers worked in collaboration with a local membership-based organization of informal workers from April 2012 to April 2013 to collect and analyze the first round of the data. All city research reports, as well as sector reports (one each for home-based work, street vending and waste picking), a global report, and other information on the study can be found at www.inclusivecities.org and www.wiego.org.
  • 4. iv IEMS Informal Economy Monitoring Study Table of Contents Executive Summary 1 Key Findings 1 Theoretical & Policy Implications 3 Introduction 5 Home-Based Workers 5 IEMS Study 6 Report Structure 8 Part 1: Individual, Household & Enterprise Characteristics 9 1.1 Home-Based Workers 9 1.2 Households of Home-Based Workers 10 1.3 Enterprises of Home-Based Workers 13 1.3.1 Product Categories 13 1.3.2 Type & Structure of Enterprises 14 1.3.3 Market Transactions 16 1.3.4 Seasonality 17 1.3.5 Piece Rates & Earnings 18 Part 2: Drivers & Responses 25 2.1 Drivers 27 2.1.1 Macroeconomic Trends 27 2.1.2 Government Policies & Practices 34 2.1.3 Value Chain Dynamics 47 2.2 Responses 56 Part 3: Institutions, Linkages & Contributions 59 3.1 Mediating Institutions 59 3.1.1 Membership-Based Organizations (MBOs) 60 3.1.2 Welfare Boards 62 3.1.3 Local Government 62 3.2 Production Linkages 63 3.3 Economic & Social Contributions 64 3.3.1 Contributions to Family 64 3.3.2 Contributions to Consumers 64 3.3.3 Contributions to Society 65 3.3.4 Contributions to the Environment 65 3.3.5 Contributions to the Economy 65 3.3.6 Contributions to Taxes 66 Part 4: Key Findings, Theoretical Lessons & Policy Implications 69 4.1 Key Findings 69 4.1.1 Driving Forces 69 4.1.2 Responses & Institutions 70 4.2 Theoretical Lessons 71 4.2.1 Women and Home-Based Work 71 4.2.2 Self-Employment & Wage Employment 71 4.2.3 Informal Economy 73 4.3 Policy Implications 74 Cited References 75
  • 5. vIEMS Sector Report: Home-Based Workers List of Tables Table 1. Sample by Status in Employment (% distribution) 10 Table 2. Formal Source of Household Income & Secondary Source of Individual Income of Self-Employed and Sub-Contracted (%) 11 Table 3. Main Source of Household Income, Formal or Informal, of Self-Employed and Sub-Contracted (% distribution) 11 Table 4. Piece Rates, Daily Output, and Daily Gross Earnings Reported by Sub-Contracted Garment Makers, by City 18 Table 5. Piece Rates, Daily Output, and Daily Gross Earnings Reported by Sub-Contracted Non-Garment Makers, by City 20 Table 6. Range of Gross Daily Earnings Reported by Sub-Contracted Home-Based Workers, by Product Type and City (USD) 21 Table 7. Median Net Monthly Earnings and Work-Related Expenditures by City 22 Table 8. Levels of Net Monthly Earnings, by City (% distribution) 22 Table 9. Levels of Net Monthly Earnings by Self-Employed and Sub-Contracted in Bangkok and Lahore (% distribution) 22 Table 10. City-Level Earnings Distribution by Status in Employment and Product Type (%) 23 Table 11. Median Net Monthly Earnings (unadjusted USD) and Percentage in the Poorest Earnings Quintile by Status in Employment, Age, and Marital Status 23 Table 12. Ranking of Three Sets of Driving Forces as Negative (-) or Positive (+) by City (# of Focus Groups) 26 Table 13. Key Driving Forces by Self-Employed and Sub-Contracted (%) 26 Table 14. GDP Growth Rate and Inflation: India, Pakistan & Thailand 2007-2012 28 Table 15. Wider Economy: Negative and Positive Driving Forces by City (# of focus groups) 28 Table 16. Problems with Orders and Payments of Self-Employed and Sub-Contracted (%) 31 Table 17. Degree of Competition within Same Trade of Self-Employed and Sub-Contracted (%) 31 Table 18. Government Policies & Practices: Negative and Positive Rankings by City (# of focus groups) 35 Table 19. Value Chain Dynamics: Negative and Positive Rankings by City (# of focus groups) 47 Table 20. Who Sets the Selling Price of Finished Goods for the Self-Employed and Sub-Contracted (%) 54 Table 21. Unable to Bargain for Better Prices by Level of Education of Self-Employed and Sub-Contracted (%) 55 Table 22. Types of Responses to Three Sets of Driving Forces (# of focus groups) 57 Table 23. Responses to a Fall in Earnings by Self-Employed and Sub-Contracted (%) 58 Table 24. Institutions Seen as Helpful or Not Helpful by Self-Employed and Sub-Contracted (%) 60 Table 25. Types of Businesses that Buy Home-Based Workers’ Products, by Self-Employed and Sub-Contracted (%) 63 Table 26. Home-Based Workers Along a Continuum of Independent to Dependent Work Arrangements 72
  • 6. vi IEMS Informal Economy Monitoring Study List of Figures, Diagrams and Charts Box 1. Home-Based Worker Sample in Three Study Cities 7 Box 2. Range of Products & Services Produced by Home-Based Workers, by City 13 Diagram 1. Economic Linkages: Cooperative of Home-Based Workers, Bangkok, Thailand 16 Diagram 2. Economic Linkages: Garment Makers & Incense Stick Rollers, Ahmedabad, India 17 Box 3. High Cost of Health & Education in Lahore 29 Box 4. Economic Recovery Undermined by Heavy Floods in Bangkok 34 Box 5. Impact of Small Size and Poor Quality of Housing on Home-Based Work in Ahmedabad 37 Diagram 3. Causal Flow: Impact of and Responses to Lack of Low-Cost Housing Lahore, Pakistan 38 Box 6. Evictions & Relocations in Bangkok 39 Diagram 4. Causal Flow: Impact of and Responses to Electrical Outages & Load Shedding, Lahore, Pakistan 42 Box 7. In Lahore, Energy Crisis Compounds Inflation 42 Box 8. Problems Associated with Lack of Public Transport 46 Box 9. Occupational Health and Safety Hazards of Rolling Incense Sticks 53 Box 10. Types of Support by Membership-Based Organizations (MBOs) of Home-Based Workers 61 Box 11. Overall Contributions: Perceptions of Focus Groups in Lahore 66
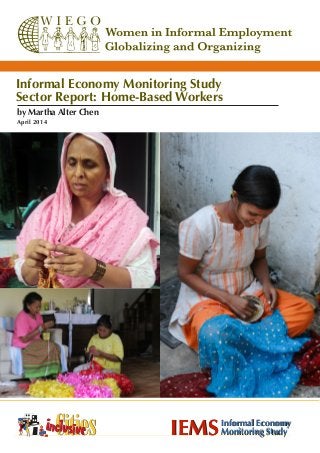
  • 7. 1IEMS Sector Report: Home-Based Workers Executive Summary Home-based workers produce goods or services for the market from within or around their own homes: stitching garments and weaving textiles; producing craft products; processing and preparing food items; assembling or packaging electronics, automobile parts, and pharmaceutical products; selling goods or providing services (laundry, hair-cutting, beautician services); or doing clerical or professional work; among other activities. Although they remain largely invisible, home-based workers are engaged in many branches of industry and represent a significant share of urban employment in some countries, particularly for women and especially in Asia. Home-based workers are one of three urban informal occupational groups – together with street vendors and waste pickers – who are the focus of a 10-city study. The Informal Economy Monitoring Study aims to provide credible, grounded evidence of the range of driving forces, both positive and negative, that affect conditions of home-based work, street vending and waste picking; the responses of informal workers to these driving forces; and the institutions which help or hinder their responses. IEMS uses both qualitative and quantitative methods. The qualitative component consists of a set of focus group tools designed to capture systematically the perceptions and understandings of 75 informal workers (per city), in their own words, in focus group settings. The quantitative component consists of a survey administered to the focus group participants plus another approximately 75 workers who did not participate in focus groups. A total of 447 home-based workers participated in the study. They live in three cities: Ahmedabad, India; Bangkok, Thailand; and Lahore, Pakistan. Key Findings Individuals, Households and Enterprises The home-based workers in the study produce a wide range of products for local, national, and international markets: from prepared food to incense sticks, from flower garlands to soccer balls, and IncenserollerinAhmedabad.Photo:L.Vryenhoek
  • 8. 2 IEMS Informal Economy Monitoring Study from shoes to garments (both traditional and modern). Though most home-based workers have very low and unpredictable earnings, their earnings are essential in fending off extreme poverty: over three quarters of the sample belonged to households where the main source of income is informal. Of the total sample of home-based workers across the three study cities, 71 per cent are sub-contracted and 29 per cent are self-employed. In the Ahmedabad sample, all of the home-based workers are sub-contracted; in both the Bangkok and Lahore samples, around 56 per cent are sub-contracted. The majority of the self-employed are own-account workers, one third are employers, and a small percentage are unpaid contributing family workers or (only in Bangkok) members of cooperatives. Among sub-contracted workers, some sub-contract work to other sub-contracted workers. Among the self-employed, one third hire workers at some point in the year; one third use only unpaid family workers; and one third work entirely on their own throughout the year. Over half of the total sample make garments; the others produce a range of products. Driving Forces The study found that home-based workers, both self-employed and sub-contracted, are affected by the macroeconomic environment, notably by fluctuations in demand and prices. Across the three study cities, nearly half of the survey respondents reported that the high cost of inputs was a problem and over 40 per cent reported that the price of inputs had increased over the past year. Inflation was prioritized as a major driving force by nearly all of the focus groups in Lahore and one third of the focus groups in Bangkok. The study also found that, because their homes are their workplaces, home-based workers are directly affected by basic infrastructure services, or the lack thereof: including, the high cost and irregular supply of electricity. Focus group participants, most prominently in Lahore, reported that power outages and load shedding significantly impacted their ability to get work done; many had to intensify work when the power came on while others switched to laborious manual machines. The accessibility and cost of public transport is also a key factor for home-based workers. The self-employed commute to markets on a regular, if not daily, basis to buy raw materials and other supplies, to negotiate orders, and to sell finished goods. The sub-contracted workers commute to firms or contractors to receive work orders and raw materials, to return finished goods, and to get paid. Significantly, one quarter of those who had to rely on paid transport operated at a loss. Further, the study found that home-based workers are exposed to unpredictable and often unfair value chain dynamics, including: irregular purchase/work orders, irregular supply of raw materials, and delayed payments. In short, most home-based workers are included in markets on unfair terms. In part this is because they work at home: isolated from other workers in their sector (apart from those in their neighbourhood) and with limited knowledge of markets and market prices (especially if they are sub- contracted). These factors limit their ability to bargain in the market for more favourable prices and piece rates or to negotiate with government for basic infrastructure and transport services. While there are important differences in value chain dynamics and relationships between self-employed and sub- contracted home-based workers, a crucial economic factor that both groups face is that they must cover many costs of production including workplace, equipment, and power as well as transport. It is important to note that some of the focus groups in Bangkok identified a number of positive driving forces in their work and lives, including infrastructure services, free education and health, and regular orders/customers; some of the focus groups in Lahore mentioned improved roads, improved water supply, and improved sanitation. It is also important to note that some focus groups in each of the three cities highlighted the value of home-based work to women, including not only the ability to combine paid and unpaid work and to have a flexible work schedule but also to earn and save money, to train children, and to engage family members as needed to help out. Further, many individual home-based workers reported that they like home-based work and feel they are skilled at it. These positive factors notwithstanding, the negative driving forces take a cumulative toll on the earnings of home-based workers, making them both low, on average, and unpredictable. In addition, home-based workers must cover many costs and absorb many risks of production, but they do so from a position of limited leverage: with little or no bargaining power, no policy presence, and limited voice and visibility outside the immediate household or neighbourhood. Considered together, these findings illustrate why so many home-based workers – and other informal workers – are not able to work their way out of poverty, so long as their earnings are low and unstable, their expenditures and risks are high, and their first line of defense is to reduce household consumption, especially nutrition.
  • 9. 3IEMS Sector Report: Home-Based Workers Responses & Mediating Institutions The negative driving forces make both expenditures and earnings unpredictable for home-based workers. Reducing expenditure is the most common coping strategy followed by borrowing money, adjusting current work, and/or taking on new work. Many home-based workers expressed concern about the cumulative toll of physical effort, long hours, stress and frustration that resulted from dealing with these negative forces on themselves, their households and their communities. Many also recognized that as individuals they could not exercise voice – could not bargain for a better deal – as they had no fall-back position, no alternative economic opportunities. But some reported engaging in collective protests or negotiations with the support of their membership-based organizations (MBOs). In both the survey questionnaire and the focus groups, the home-based workers were asked which institutions helped or hindered their ability to respond to the negative driving forces. Among the institutions ranked as helpful by the focus groups, the MBO to which the home-based workers belong was the most prominent, mentioned by well over half of the focus groups, followed by welfare boards and local municipal government. However, there was significant variation in the institutional environment across the three cities. The local municipality, the employment department, and public transport play more prominent positive roles in Bangkok than in the other two cities. Welfare boards play a prominent positive role in Lahore and especially in Ahmedabad, but there is no local equivalent in Bangkok. Among the institutions ranked as negative by the focus groups, by far the most prominent was the private company or government department responsible for providing electricity, followed by the municipal government, police, and public transport. The findings illustrate the importance of being organized – of belonging to an MBO of informal workers. Such organizations represent the only channel for voice for most home-based workers who otherwise lack bargaining power and, also, lack visibility in policy processes. Linkages & Contributions These is a widespread notion that the informal economy is not linked to the formal economy. Although they work from their homes, many home-based workers are linked to formal firms through both backward and forward production linkages. Around 30 per cent of the self-employed home- based workers purchase inputs from formal firms and just under 30 per cent of both groups of home- based workers sell goods to or produce goods for formal firms. There is also a widespread notion that the informal economy does not contribute to the economy. However, home-based workers make significant contributions to their households, to society, and to the economy. They contribute to the household budget but also, by working from home, to the care of children and the elderly, to the quality of family life, and to the social fabric of their communities. They provide goods and services at a low cost to low-income people and the general public. They also produce goods at low prices for domestic and global value chains. They do not commute every day and often go to markets on foot or by bicycle, thus, helping to reduce air pollution and traffic congestion. They create demand by buying supplies, raw materials, and equipment and paying for transport and other services (such as washing, ironing and packaging of garments they product). They pay taxes on the raw materials, supplies, and equipment they purchase; and the firms up the chain who sell their finished goods often charge sales taxes. Theoretical & Policy Implications Theoretical Lessons It is widely assumed that the workforce is comprised of fully independent self-employed and fully dependent employees. However, most home-based workers fall in a grey intermediate zone between being fully independent and being fully dependent. Clearly, sub-contracted home-based workers are neither fully independent self-employed nor fully dependent employees. They typically have to absorb many of the costs and risks of production – including: buying or renting and maintaining equipment; providing workspace and paying for utility costs; buying some inputs; and paying for transport, often without legal protection or help from those who contract work to them. Also, they are not directly supervised by those who contract work to them. However, they are subject to factors beyond their control, namely: irregular work orders, strict delivery deadlines, and quality control of the products or services they deliver. On the other hand, self-employed home-based workers are not fully independent: as they have limited access to capital, limited knowledge of markets, limited bargaining power, and limited control in commercial transactions. Also, both groups have limited
  • 10. 4 IEMS Informal Economy Monitoring Study leverage over public policies and services that are crucial to their productivity, such as land allocation and housing policies, as well as basic infrastructure and transport services. The study findings challenge the common assumptions that the informal economy is not linked to the formal economy or to the modern economy; that informal operators intentionally avoid regulation and taxation; and that the informal economy does not contribute to – or is not affected by – the wider economy. As noted earlier, many self-employed home-based workers buy supplies from formal firms and many self-employed and sub-contracted home-based workers sell goods to or produce goods for formal firms. The study found no evidence that home-based workers are hiding from any regulations. On the contrary, most of the home-based workers in the sample pay taxes and levies of various kinds but do not enjoy the basic infrastructure and transport services they need to be productive. Moreover, few home-based workers hire other workers, and are not therefore avoiding labour regulations, and many of the sub-contracted are concerned about their own working conditions. Further, the productive activities of home-based workers, both self-employed and sub-contracted, are significantly affected by the macroeconomic environment, notably by fluctuations in demand and prices. Policy Lessons A major policy lesson is that home-based workers and their activities are affected by government policies and practices, notably land allocation, housing policies, basic infrastructure services, and public transport. This is because their homes are their workplaces; and they have to commute to markets and transport supplies/goods to and from their homes. Efforts should be made to upgrade settlements with large concentrations of home-based workers to ensure they have adequate shelter, water, sanitation and electricity. If and when home-based workers and their families have to be relocated, efforts should be made to ensure the relocation sites have, from the outset, adequate shelter, basic infrastructure, transport services, and access to markets. A second major policy lesson is that home-based workers need legal rights and protections against unequal and, often, exploitative value chain practices and relationships. To demand and secure their rights, home-based workers need increased bargaining power, which comes with being organized and being invited to have a seat at the policymaking, rule-setting or negotiating table. As the study findings show, home-based workers have limited scope for negotiation or leverage: due in large part to their isolation in their homes but also to exclusionary urban policies or practices and to unequal or exploitative value chain dynamics. The most supportive institution to the home-based workers in each study city is the MBO to which they belong. The final policy lesson from the study is that home-based workers and their activities, like formal workers and formal firms, are impacted by macroeconomic trends and policies. Efforts should be made to increase the visibility of home-based workers and their output in official labour force and other economic statistics and to study the impact of macroeconomic trends and policies on home- based workers and their work. Clearly, improving the terms on which home-based workers, and other informal workers, engage with the market and the state are key pathways to reducing poverty. Improving the terms of engagement with the state and with the market should also be recognized as key dimensions of social-economic inclusion and inclusive growth. Meanwhile, policymakers should recognize that the earnings of home-based workers are essential to the daily cash flow – and the ongoing struggle to ward off extreme poverty – of their households.
  • 11. 5IEMS Sector Report: Home-Based Workers Introduction Home-Based Workers Home-based workers produce goods or services for the market from within or around their own homes:1 stitching garments and weaving textiles; producing craft products; processing and preparing food items; assembling or packaging electronics, automobile parts, and pharmaceutical products; selling goods or providing services (laundry, hair-cutting, beautician); or doing clerical or professional work; among other activities. Although they remain largely invisible, home-based workers are engaged in many branches of industry and represent a significant share of urban employment in some countries, particularly for women and especially in Asia. For example, in India in 2011-12, they represented 14 per cent of total urban employment and 32 per cent of women’s urban employment (Chen and Raveendran 2014); and in Pakistan in 2008-9, they represented 4 per cent of total urban employment and 31 per cent of women’s urban employment (Akhtar and Vanek 2013). Historically, home-based work has been associated with pre-modern manufacturing. But home-based work has persisted and is growing in many sectors and countries around the world. Today, many home-based workers produce under sub-contracts for global value chains and are, thus, a feature of the modern global economy (Carr, Chen and Tate 2000; Kabeer 2004). Many others are self-employed, producing both low- and high-end goods and services. In many countries, a large share of total 1 The Independent Group on Home Based Workers in India constituted by the Ministry of Statistics and Programme Imple- mentation recommended in 2007 the following definitions for “home” and “home-based workers”. “Home” was defined as a) dwelling unit and/or b) structure attached to dwelling unit and/or c) open area adjacent to the dwelling unit. “Home- based workers” were defined as a) own-account workers and contributing family workers helping the own account workers, involved in the production of goods and services in their homes for the market; and b) workers carrying out work in their homes for remuneration, resulting in a product or service as specified by the employer(s), irrespective of who provides the equipment, materials or other inputs used and those contributing family workers helping such workers (Sudarshan and Sinha 2011). GarmentworkerinBangkok.Photo:S.Tubsakal
  • 12. 6 IEMS Informal Economy Monitoring Study production is now home-based. In India in 2005-6, around 75 per cent of all manufacturing firms were informal and, of these, around 75 per cent were home-based (Basole and Basu 2011). These figures suggest that over half of all manufacturing units in modern India are home-based. Debates around home-based work centre on what drives it and how to extend labour protections to home-based workers, particularly those who are sub-contracted. Much of this debate focuses on women home-based workers. But there are male home-based workers, often in retail trade and repair services (ILO and WIEGO 2013). Indeed, men represent one half of all home-based workers in India and one quarter of all home-based workers in Pakistan, in part because the female labour force participation rate is very low in both countries (Raveendran, Sudarshan and Vanek 2013; Akhtar and Vanek 2013). In some societies, gender norms restrict the physical mobility of women, conditioning them to not seek paid work outside the home. In many societies, the gender division of labour – whereby women are seen as the primary housekeepers and caregivers – conditions women to work at home in order to juggle paid work with unpaid domestic and care work. But it is also the case that, to cut costs and maximize profits, many firms decide to outsource production to home-based workers, especially women. Further, advances in technology have facilitated the outsourcing of production to home-based workers (Balakrishnan 2002; Balakrishnan and Sayeed 2002; Chen, Sebstad and O’Connell 1999; Bose 2007; Raju 2013). In other words, home-based work in its modern form is driven in large part by changes in production associated with the global economy. Outsourcing of work to home-based workers and the associated lack of power of these workers are both inextricably linked to recent shifts in how global production is organized. Sub-contracted home-based workers are officially referred to as “homeworkers”. In 1996, the International Labour Organization (ILO) adopted an international convention on homework – Convention 177 – which has been ratified by 10 countries. And, in recent years, some corporate social responsibility initiatives have expanded their oversight to encompass homeworkers, the lowest links in global value chains: for instance, the Ethical Trading Initiative in the UK has a working group on homeworkers. There is growing understanding of how home-based workers are inserted into global value chains, from labour-intensive industries such as garments to high-end industries such as automobiles (Balakrishnan 2002; Carr, Chen and Tate 2000; Unni and Rani 2008). There is also growing understanding of how economic crises affect home-based workers, from the Asian financial crisis in the late 1990s to the global recession that started in 2008 (HomeNet Thailand and ILO 2002; Horn 2009, 2011). But far less is known about how broader economic trends and government policies affect home-based workers, especially the self-employed. In particular, few studies trace how inflation and fluctuations in demand, competition and prices affect home-based workers; and few show how urban housing policies, basic infrastructure provision (or the lack thereof), and zoning regulations affect home-based workers whose homes are also their workplaces. Further, few existing studies provide structured comparisons of different sectors of home-based workers across cities. The Informal Economy Monitoring Study (IEMS), of which this report is a part, begins to fill these gaps for home-based workers. Separate reports tracing the impact of economic trends, city policies, and value chain dynamics are available for two other sectors of the informal economy: street vending and waste picking (Roever 2014; Dias and Samson 2014). IEMS Study The objective of the IEMS is to provide credible, grounded evidence of the range of driving forces, both positive and negative, that affect conditions of work in the urban informal economy in 10 cities over time. The study examines not only the impact of these forces across and within sectors, but also informal workers’ responses to them. It is based on a collaborative approach between researchers, both local researchers in each city and researchers from the WIEGO network, and membership- based organizations (MBOs) of home-based workers, street vendors, and waste pickers to monitor the state of the urban working poor in the informal economy. This report synthesizes qualitative and quantitative data from the first (2012) round of IEMS fieldwork in the home-based work sector in three cities: Ahmedabad, India; Bangkok, Thailand; and Lahore, Pakistan. Its focus is on the ways in which three driving forces – macroeconomic trends, government policies and practices (especially but not exclusively at the city level), and value chain dynamics – play out among different segments of home- based work across cities, and how those trends may inform urban policy and planning approaches. The IEMS is based on both qualitative and quantitative methods. The qualitative component consists of participatory informal economy appraisal (PIEA), an innovative method designed to capture
  • 13. 7IEMS Sector Report: Home-Based Workers systematically the perceptions and understandings of informal workers in their own words, in a focus group setting.2 Each city team3 conducted 15 focus groups of five participants each (per sector), in which nine tools – organized around the themes of sector characteristics, market linkages the impact of and responses to driving forces, the institutional environment, and contributions of the sector to the city – were used to generate data related to the conceptual framework. The results of the focus groups were recorded in brief reports (5-10 pages) immediately after each focus group was conducted, and those reports were then analyzed and synthesized into a city report. The quantitative component consists of a survey questionnaire administered to the 75 focus group participants per sector, plus another 75 workers for a total of 150 in each city-sector (with minor variation in the sample size in some cities/sectors). The questionnaire is designed to supplement the data collected through the focus groups by collecting information on the household profile and income sources of the workers; the assets profile of the workers’ households; detailed information on the enterprise or occupation of the workers; and linkages between the informal economy and the formal economy. The questionnaires were administered using a data-capture tool. The sampling approach was designed to maintain comparability in the results across all IEMS cities, on the one hand, and to allow some flexibility as demanded by local circumstances, on the other hand. Each city aimed to include only members of the local MBOs or their affiliates. Research teams in all cities used a common matrix of sector-specific sampling variables: for the home-based work sector, this included status in employment (sub-contracted or self-employed4 ), product category, and (in the case of one city) a spatial variable. Each city research team then developed the most representative sample possible of the population of MBO membership on that matrix. Because only MBO members were sampled, the findings presented here are not designed to be representative of the entire population of home-based workers in each city. In the three cities where home-based workers were studied, only women home-based workers were included in the sample as the membership of the local MBO partner in each study city was all women. Two key variables were used to draw the sample from this pool: status in employment (self-employed or sub-contracted) and product category (garments or non-garments): see box 1. Box 1. Home-Based Worker Sample in Three Study Cities Ahmedabad: • Product Type: Garment + Non-Garment (single product = incense sticks/agarbatti) • Status in Employment: All Sub-Contracted; among sub-contracted, distinction drawn between those who deal directly with a trader and those who deal through a contractor for getting work orders/raw materials and delivering finished goods Bangkok: • Product Type: Garment + Non-Garment (multiple products) • Status in Employment: Sub-Contracted + Self-Employed Lahore: • Product Type: Garment + Non-Garment (multiple products) • Status in Employment: Sub-Contracted + Self-Employed • Additional Location Variable: Center + Periphery 2 The methodology was developed collaboratively with Caroline Moser, Angélica Acosta, and Irene Vance, who also trained the city teams in the data collection methods and later in data analysis. PIEA is an adaptation of earlier participatory research methodologies developed by Chambers (1994), Moser and Holland (1997), Moser and McIlwaine (1999, 2004), and Moser, Acosta and Vásquez (2006). 3 Each city team consisted of an MBO coordinator, two qualitative researchers, and two quantitative researchers. A member of WIEGO’s Technical Advisory Committee supported each city team through data analysis and report writing. 4 In this report, as per the International Classification of Status in Employment, the self-employed include employers, own account operators, unpaid contributing family workers, and members of cooperatives. Most sub-contracted workers are paid by the piece. In Thailand, some reported that they were paid on a daily rate basis. In this report, those who were paid on a daily rate were merged with those who were paid on a piece rate into a single “sub-contracted worker” category.
  • 14. 8 IEMS Informal Economy Monitoring Study Report Structure Part I of the report analyzes the individual, household, and enterprise characteristics of the 447 home-based workers who participated in the study. It describes the products they produce as well as their status in employment and associated contractual arrangements and market transactions. Part II analyzes the quantitative and qualitative data related to driving forces, showing especially how fluctuating demand and prices affect home-based workers, how infrastructure services, notably electricity supply, affect the productivity of home-based workers whose homes double as workplaces, and how value chain dynamics affect the earnings of home-based workers. It also examines the range of responses to these driving forces, with particular attention to whether the home-based workers modify their existing work, reduce expenditures and/or borrow money, and the mediating role of institutions, especially MBOs. Part III analyzes the institutions that support the home-based workers; the linkages between home-based workers, formal firms, and the urban economy; and the contributions of home-based workers to their families, society, environment and the economy. Part IV summarizes key findings and offers theoretical lessons and policy implications derived from the first round of study.
  • 15. 9IEMS Sector Report: Home-Based Workers Part 1: Individual, Household & Enterprise Characteristics The home-based workers in the study sample produce a wide range of goods from their homes for domestic and global markets: stitching garments, shoes, or soccer balls; rolling incense sticks; cooking food for sale; weaving or carving craft items out of bamboo, horn, and wood; threading flower garlands; and more. Some sell goods or provide services from their homes. This heterogeneity of products can be found among both categories of home-based workers: self-employed and sub-contracted. The self-employed produce mainly for local customers, buyers and markets but also for domestic markets and, in some cases, international buyers. They buy their own raw materials, supplies, and equipment and sell their own finished goods. The sub-contracted workers produce goods for firms up the value chain, both domestic and global value chains: but typically do not know the backward or forward links of the chain they are engaged in beyond the firm or its contractor which directly outsources work to them. This is because they do not buy their own raw materials or sell their own finished goods. However, as the study findings clearly illustrate, both sub-contracted and self-employed home-based workers cover many of the non-wage costs of production (workplace, equipment, utilities, transport) and absorb many of the risks of production (delayed or cancelled orders, unreliable supply of raw materials, delayed payments, rejected goods). 1.1 Home-Based Workers The home-based workers in the IEMS study sample, as noted above, are all women. They have been working as home-based workers for, on average, 12.5 years. All but 14 are currently members of a local MBO of informal workers. Those who are currently MBO members have been members for, on average, six years. But around one third have been an MBO member for less than a year. GarmentworkerinLahore.Photo:HomeNetPakistan
  • 16. 10 IEMS Informal Economy Monitoring Study Of the 447 women in the sample,5 11 per cent are 25 or younger; two thirds are between 26 and 50 years of age, and 22 per cent are aged 50 or older. Around two thirds are married, 16 per cent are never-married, 12 per cent are widowed, and 7 per cent are separated or divorced. Nearly one quarter (23 per cent) of the sample have no education, around 45 per cent have some primary education, and one third have some secondary education or higher. Among the three cities, the home-based workers in Bangkok have the highest levels of education (over half have some primary education and over 40 per cent have some secondary education or above); and those in Lahore have the lowest levels of education (just under 40 per cent have no education). Whether or not they have formal education, many home-based workers feel they have the requisite skills for their work: some acquired these skills from their parents or communities; others learned on the job; and still others attended training courses run by the government or non-governmental organizations. A dress maker and embroiderer in Bangkok stated that she was destined to be a dress maker: “I was born among garment workers. Formerly, most of the people who were living in this area, worked on garments. Thus the skills for garment making including sewing and embroidering were taught from generation to generation” (FG 11). Another dress maker in Bangkok, now in her mid-40s, said: “I have known how to make dresses since I was 15-16 years old. During that time, parents usually allowed their young girls to learn about dress making, which was popular as a woman’s occupation” (FG 8). Of the total sample of home-based workers across the three study cities, 71 per cent are sub- contracted and 29 per cent are self-employed: see table 1. The majority of the self-employed are own-account workers (without paid employees), one third hire workers for some part of the year, and a small percentage are unpaid contributing family workers or (only in Bangkok) members of cooperatives. In the Ahmedabad sample, all of the home-based workers are sub-contracted; in both the Bangkok and Lahore samples, around 56 per cent are sub-contracted. Table 1. Sample by Status in Employment (% distribution) Ahmedabad Bangkok Lahore Total Self-Employed 0.00 43.34 44.08 29.40 Employers - for some part of the year --- 18.00 13.16 10.47 Own account workers --- 22.00 28.29 16.93 Contributing family workers --- 0.67 2.63 1.11 Cooperative members --- 2.67 0.00 0.89 Sub-Contracted 100.00 56.66 55.92 70.60 N 147 150 150 447 Source: IEMS survey data (2012) 1.2 Households of Home-Based Workers With the low average earnings associated with home-based work (see section 1.3.5 below), the welfare of home-based workers and their families depends on whether they are the sole or main earner in the family; whether they have secondary sources of income; and whether other earning members, if any, in the household are informally or formally employed. The poverty risk also depends on whether the home-based worker or her family has access to sources of income other than what they earn. While a very low percentage of the home-based workers are sole earners in their households, over three quarters (78 per cent) of home-based workers across all three cities live in households where the main source of income was informal. While only 6 per cent of the home-based workers are the sole income earners of their families, over one quarter (27 per cent) are the main earners of their families. Also, over two thirds (68 per cent) belong to households that do not have a formal source of income; and over three-quarters (78 per cent) belong to households where the main source of income is informal: see table 3. Finally, nearly one quarter (22 per cent) of the home-based workers have a secondary source of income: see table 2. A far higher percentage of home-based workers in Bangkok, compared to the other two cities, have a formal source of income (55 per cent) and a secondary source of income (33 per cent). Home-based worker 5 Although the sample design called for 150 workers to be interviewed in each of the three cities, for a total of 450 workers, the total interviewed was 447.
  • 17. 11IEMS Sector Report: Home-Based Workers households are least likely (13 per cent) to have a formal source of income in Lahore and home-based workers are least likely (12 per cent) to have a secondary source of income in Ahmedabad. Table 2. Formal Source of Household Income & Secondary Source of Individual Income of Self-Employed and Sub-Contracted (%) Self-Employed Sub-Contracted All HBWs Formal source of income 33.08 31.86 32.21 Secondary source of income 22.31 21.77 21.92 N 130 317 447 Bangkok Formal source of income 55.38 55.29 55.33 Secondary source of income 35.38 31.76 33.33 N 65 85 150 Lahore Formal source of income 10.77 15.29 13.33 Secondary source of income 9.23* 29.41 20.67 N 65 85 150 Ahmedabad Formal source of income --- 27.89 27.89 Secondary source of income --- 11.56 11.56 N --- 147 147 *Statistically significant at the .05 level. Home-based workers in Bangkok are significantly more likely to report at least one source of income from formal work in their household (X2 = 61.73; p = 0.000) and to have a secondary income source (X2 = 20.76; p = 0.000) in addition to their main activity – at the .05 level of confidence. Source: IEMS survey data (2012) Table 3. Main Source of Household Income, Formal or Informal, of Self-Employed and Sub-Contracted (% distribution) Employment Status Self-Employed Sub-Contracted All HBWs Formal - main income 11.54* 26.18 21.92 Informal - main income 88.46 73.82 78.08 N 130 317 447 Bangkok Formal - main income 18.46* 56.47 40.00 Informal - main income 81.54 43.53 60.00 N 65 85 150 Lahore Formal - main income 4.62* 0.00 2.00 Informal - main income 95.38 100.00 98.00 N 65 85 150
  • 18. 12 IEMS Informal Economy Monitoring Study Table 3. Main Source of Household Income, Formal or Informal, of Self-Employed and Sub-Contracted (% distribution) (continued) Employment Status Self-Employed Sub-Contracted All HBWs Ahmedabad Formal - main income --- 23.81 23.81 Informal - main income --- 76.19 76.19 N --- 147 147 *Statistically significant at the .05 level for all cells for that specific city. Home-based workers in Bangkok are significantly more likely to report income from formal work as their main source of household income at the .05 level of confidence (X2 = 63.72; p = 0.000) Source: IEMS survey data (2012) Survey results confirm that whether the main breadwinner in the household has a formal or informal source of income has an impact on the status of the household. Home-based workers who live in a household where the main source of income is formal are significantly more likely to have a credit card, a bank account, and a private toilet. Households in which the main source of income is formal are twice as likely to perceive themselves as reasonably or very comfortable. Conversely, households in which the main source of income is informal are more likely to perceive themselves as very poor, poor, or just getting by. In Ahmedabad and Lahore, few of the sample households enjoy social protection, social assistance, or sources of income other than what they earn. In Thailand, the universal health system extends coverage to informal workers and other disadvantaged groups: so all of the home-based workers in Bangkok reported that they have health insurance.6 In the other two cities, a very low percentage of sample households have health insurance: 7 per cent in Ahmedabad and 3 per cent in Lahore. Also, a far higher percentage of households in Bangkok (28 per cent) than in Ahmedabad (7 per cent) and Lahore (3 per cent) reported that they have a pension.7 Around 7 per cent of households in both Bangkok and Lahore, but less than 1 per cent in Ahmedabad, reported that they receive remittances from family members who are migrant workers. Less than 15 per cent of households in Bangkok and less than 10 per cent in Ahmedabad and Lahore receive any of the following forms of social assistance: government grants, unemployment insurance, retrenchment packages, or workers’ compensation. Yet most home-based workers and their families would be eligible for and should be targeted by social assistance schemes. To sum up, over three quarters of the home-based worker sample belong to households that rely entirely on earnings from informal work and over one quarter are the main earners in their families; their earnings play a critical role, as will be shown later on, in maintaining household consumption, including very basic food consumption. So although they earn little and have no policy visibility or voice, the earnings of home-based workers are essential in fending off extreme poverty. 6 In Thailand under the universal health coverage scheme, the informal workers do not have health insurance per se but, rather, are entitled to free health care services financed by the government. Since 2007, when a co-payment of Baht 30.00 (about US$1.00) per visit to accredited hospitals and health centers for inpatient or outpatient care (including drugs) was dropped, these services have been free. 7 In Thailand, under article 40 of the Social Security Scheme, the informal workforce is entitled to old age pensions as well as compensation for disability, hospitalization, and death.
  • 19. 13IEMS Sector Report: Home-Based Workers 1.3 Enterprises of Home-Based Workers8 Despite their heterogeneity, home-based workers can be meaningfully differentiated, for policy and other purposes, by their status in employment and associated contractual arrangements. Other important policy-relevant variables are what they produce, the conditions of their home-cum-workplace, and the distance of their home-cum-workplace from their customers, markets, or contractors. 1.3.1 Product Categories Home-based workers can be found in a wide variety of sectors: from traditional labour-intensive sectors such as textiles and garments, artisan production, and food processing to more capital-intensive sectors such as automobile parts and electronic assembly. In the study sample, all of the home-based workers work in labour-intensive sectors. Over half of the total sample, as well as of the Ahmedabad and Bangkok samples, are garment makers while in Lahore, the sample divides evenly between those who make garments and those who make other products. Among the self-employed, the majority in Bangkok are garment makers while the majority in Lahore make products other than garments. In all three cities, the garment makers produce a range of garment items, traditional and modern: and some are involved in ancillary work, such as embroidery, in addition to stitching: see box 2. In Bangkok and Lahore, the home-based workers also produce a variety of products other than garments: shoes and accessories; craft items; household goods; cooked and processed food. In Bangkok, a few home- based workers provide services or engage in trade: ironing for local customers, filling bottles with oil under a sub-contract, or running a small grocery store in their home. In Ahmedabad, as per the sample design, the majority of the non-garment home-based workers roll incense sticks (agarbatti); a few make cushion and pillow covers or apply lace edgings to handkerchiefs. Box 2. Range of Products & Services Produced by Home-Based Workers, by City City Garments Other products & services Ahmedabad Traditional Garments: Tunics - kameez, punjabi Pants - salwar Skirts - lehnga Petticoats - for saris Modern Garments: Skirts Pants Frocks - for girls Incense sticks - agarbatti Cushion covers Pillow covers Handkerchiefs - lace edgings 8 In this report on home-based workers, we use the term “enterprise” advisedly for several reasons. First, most home-based workers, even the self-employed, earn below the prevailing minimum wage or poverty line in their countries. Second, most home-based workers, even the self-employed, invest relatively large amounts of their labour, compared to capital, into their activities. Of the self-employed home-based workers in the study sample, one third hired workers at some point during the year. Very few are employers who hire others on a regular basis. Finally, nearly three quarters of the sample were sub- contracted workers who cover a lot of the non-wage costs of production (workspace, equipment, utilities) and absorb many of the risks of value chain production (through delayed or cancelled work orders, delayed payments, or rejected goods) but have limited (if any) knowledge of the product markets and limited autonomy or power to negotiate a better deal for themselves.
  • 20. 14 IEMS Informal Economy Monitoring Study Box 2. Range of Products & Services Produced by Home-Based Workers, by City (continued) City Garments Other products & services Bangkok Traditional Garments: Shirts - for Muslim men Prayer hats - for Muslim men Modern Garments: Dresses Shirts - some brand-name T-shirts Ancillary Work: Embroidery Shoes & Accessories: Handbags Shoes Cloth diapers Craft: Woven baskets Carved buffalo horn Flower garlands - for Buddhist rituals Plastic products Lottery games Food Items: Cooked food, including smoked pork Processed food, including chili paste Services & Trade: Ironing Filling oil bottles Grocery store Lahore Traditional Garments: Bridal outfits Modern Garments: Shirts Pants Dresses Ancillary Work: Embroidery Bead work Ironing & packaging Shoes & Accessories: Handbags & purses Jewelry Shoe uppers Shoe boxes Household Goods: Napkins Sheets & bedspreads, including block-printing Paper bags Scrap cloth bags - for shopping Foam mattresses Food Items: Cooked food, including coffee, rice porridge (congee), & stuffed patties (samosas) Processed food, including spices & dried fruit Source: IEMS Focus Groups (2012) 1.3.2 Type & Structure of Enterprises Self-employed and sub-contracted workers can be further distinguished by whether they hire others, work on their own or with unpaid family help, or are members of producer groups. Among sub-contracted workers, some sub-contract work to other sub-contracted workers; thus acting as intermediaries between a contractor or firm that outsources work and other sub-contracted workers, often in their own neighbourhood or community. Among the self-employed in the study sample, one third hire workers at some point in the year; one third use only unpaid family workers; and one third work entirely on their own. Among both groups in Bangkok, there are several cooperatives or producer groups. Sub-Contracted Home-Based Workers Classic Sub-Contracted Workers – Under the most common sub-contracting arrangement, the sub-contracted workers provide the workplace, pay for utilities, buy/rent and maintain their own equipment while the contractors provide the work orders and raw materials, specify the product/s to be made, and sell the finished goods or supply them to firms further up the chain. In most cases, the home-based worker goes to the contractor to receive raw materials/deliver finished goods; in some cases, the contractor comes to the home-based worker’s home or lives/works nearby.
  • 21. 15IEMS Sector Report: Home-Based Workers In Ahmedabad, several variations on sub-contracting arrangements were reported. Some home- based workers pick up raw materials and drop off finished goods from/to the shop or factory that outsources production, rather than through a contractor. In Ahmedabad, among both home-based worker product groups – garment makers and incense stick rollers – those who deal directly with a shop or factory earn somewhat more, on average, than those who deal with contractors who take a share of the value added. Sub-Contracted Workers as Intermediaries – In some cases, the home-based worker is herself a sub-contractor who splits the order and raw materials that she receives among other women in her neighbourhood. In Bangkok, several sub-contracted workers also act as contractors: getting raw materials and work orders from the contractors/firms for themselves and other women; distributing the work orders and raw materials to other women in their neighbourhoods; collecting the finished goods from other women and delivering these to the contractor/firm. In a few such cases, the contractors or firms deliver raw materials to and collect finished goods from the designated woman in the neighbourhood. Groups of Sub-Contracted Workers – Some sub-contracted home-based workers work together in groups: either in one woman’s home or in a common space within their neighbourhood. Consider the case of five garment makers from one neighbourhood in Bangkok who made brand-name shirts for a local factory. Two of the five are sisters. One of the sisters is the designated leader of the group. The manager of the factory delivers work orders and raw materials to the local leader at her home; she distributes the work orders and raw materials to the other women, who return finished goods to her home, which the factory manager then picks up. According to the women, a brand-name firm had designed the shirts and outsourced production to the local factory, which in turn outsourced production to them (Bangkok FG 1). Whatever the arrangement, many of the sub-contracted home-based workers have limited knowledge of the markets and prices for raw materials and finished goods because they do not deal in these markets. However, members of one group in Bangkok (FG 1), who embroider garments for a local self-employed contractor, know where he buys his raw materials and how much he spends on transport going to and from one of the markets. As one of them said: “I know that the owner of our business goes to buy cloth and other materials from three places. These are Pratunam Market, Yaovarat Market and sometimes at Pahurat Market. He takes a taxi to Pratunam Market, which takes him about 1.5 to 2 hours, in order to sell his products on wholesale and bring back home the raw materials for the next orders. He told me that he has to pay 700 baht (USD 23.30) per round trip.” The group added that sometimes their contractor takes a public boat from Pratunam Market to Pahurat Market, where he books a taxi to wait for him (Bangkok FG 11). Similarly, a group in Ahmedabad (FG 6) who produces incense sticks for a factory know where that factory bought raw materials and processed the rolled incense sticks. As one of them said: “My factory owner is a big wholesaler who has 2-3 factories. He purchases the raw materials like jaggery, coal powder, and gum from Popat-bhai who is a big dealer in such raw materials. The factory owner prepares the mixture and keeps it ready for us to make the incense sticks. The scenting, packaging, and branding are done at other factories belonging to the owner.” Knowing the markets for raw materials and finished goods, and especially the prices at which supplies are purchased and finished goods are sold, should help enable sub-contracted workers to negotiate better piece rates. Self-Employed Home-Based Workers Self-employed workers, by contrast, have to know and negotiate the markets for raw materials and finished goods. As a result, they have much greater knowledge of markets and prices. But their knowledge of markets comes at a price. Compared to sub-contacted home-based workers, the self- employed have to spend more time and money on transport. Consider the case of a cooperative in Bangkok, called the Solidarity Group, which makes T-shirts for private firms as well as for NGOs and trade unions. The Solidarity Group is comprised of ex- employees of Bed and Bath, a Thai company which had produced brand-name clothing for export but
  • 22. 16 IEMS Informal Economy Monitoring Study closed in response to worker protests against its hiring practices. After fighting, unsuccessfully, for compensation, some ex-employees decided to work independently and formed the Solidarity Group cooperative. The cooperative members identified four markets where they purchase raw materials, noting that they choose which market to go to after doing comparative research on wholesale prices in different markets. They also make T-shirts for two factories which supply an especially fine fabric. By participating in trade fares and exhibitions, they also receive orders for T-shirts from NGOs and trade unions: see diagram 1. Diagram 1. Economic Linkages:9 Cooperative of Home-Based Workers, Bangkok, Thailand Trade unions NGOs Private firms Yong Udom factory Lanluang Market Kwanthong & Chongsathit factories Pahurat Market Wat Sone Market Solidarity Group Charoenrath Market Finished shirts Linings Net linings Accessories Remnant fabric Fabric Fabric, thread & accessories Source: Bangkok FG 29 1.3.3 Market Transactions Home-based does not necessarily mean home-bound. Often, home-based workers have to move outside the home as part of their work: to buy raw materials or other inputs (self-employed and sub-contracted), to get work orders/raw materials from and return finished goods to a contractor/ firm (sub-contracted), or to sell finished goods (self-employed). So the distance between the market/ contractor and the home-cum-workplace as well as the time and money spent in commuting and transporting goods are of critical importance to the productivity and earnings of the workers. In Ahmedabad, 8 per cent of the sub-contracted home-based workers reported that a contractor comes to their home to give work orders, deliver raw materials, and pick up finished goods; over 75 per cent reported that the contractor or firm/shop/factory which sub-contracts work to them is nearby (often within walking distance); only 16 per cent reported that they have to use transport, usually public transport, to commute to where the contractor/firm is located. In Bangkok, as noted earlier, home-based workers in some neighbourhoods have a local leader who acts as an intermediary for the others, getting raw materials from and delivering finished goods to a contractor, firm, or factory. Consider what a focus group in Ahmedabad, comprised of three garment makers and two incense stick rollers – all sub-contracted workers – described. A contractor or trader delivers the raw materials to two of the garment makers and also collects the stitched garments from them; the third garment maker has to go to the trader’s workshop to collect raw materials and deliver stitched garments. Both incense stick rollers walk daily to their contractor or trader to collect raw materials and return rolled incense sticks. The economic linkages diagram drawn by this focus group shows that the sub- contracted workers have both backward and forward production linkages with the same traders and, also, that the sub-contracted garment workers have to purchase supplies like thread and needles: see diagram 2. The contractors, traders, and supply shops are all near the area where the women live and work (Ahmedabad FG 12). 9 In the focus groups, in an economic linkages exercise, the participants were asked to draw diagrams indicating from whom they bought/received raw materials and other supplies and to whom they sold/supplied finished goods.
  • 23. 17IEMS Sector Report: Home-Based Workers Diagram 2. Economic Linkages: Garment Makers & Incense Stick Rollers, Ahmedabad, India Raju bhai Guddu bhai Ashok bhai Shankar bhai (contractor) Garment Raju bhai, contractor of incense stick Mukesh bhai, trader of garments Guddu bhai garment trader Shankar bhai (contractor) Shops to purchase needle etc at sarangpur, gomtipur, bapunagar Mukesh bhai Home-based workers: Self-employed & Sub-contracted Ashok bhai, trader of incense Walking Auto- Rs 20 Pays Rs 13/1000 sticks Pays Rs 12/piece 12-15/day Pays Rs 13/1000 sticks Per piece Rs 8/- daily 30 pieces stitched Per piece Rs 10-20/- daily 6 pieces stitched Source: Ahmedabad FG 12 Self-employed home-based workers often buy raw materials from and sell finished goods at different markets. Consider the case of one focus group in Lahore, Pakistan where there are strong gender- cum-religious norms restricting women’s mobility. This focus group identified three markets where they buy and sell goods: Shah Alam Market (a wholesale market) and Anarkali Bazaar (a retail market) where they buy beads, needles, and thread and sell shirts decorated with beads; and Landa Bazaar (a second-hand market) where they buy used clothes and sell the thread pulled from the used clothes. These markets are located in North Lahore while the areas where this group of home-based workers live and work, Kahna and Kot Lakhpat, are located in South Lahore. Most members of the group travel long distances – as far as 35 kilometers each way – to buy materials and sell products. It takes them up to two hours and costs them between 350 and 400 rupees to commute from Kahna or Kot Lakhpat to the markets. Some of them work through an intermediary who lives near the markets and who brings raw materials from and takes finished goods to the markets, saving the women significant time and money. What the IEMS findings do not tell us, however, is the net difference, in terms of opportunity and direct costs as well as buying and selling prices, between dealing directly with the markets and working through an intermediary. Also, presumably, relying on an intermediary limits the ability of the home-based workers to diversify what they sell or capture more of the profit. 1.3.4 Seasonality Home-based work is often seasonal due largely to the weather and to festival and holiday shopping. In the survey, 13 per cent of home-based workers reported their work was seasonal: more so in Lahore (28 per cent) than in Ahmedabad (7 per cent) and in Bangkok (5 per cent). Seven focus groups in Ahmedabad (both garment makers and incense stick rollers), four focus groups in Bangkok (garment makers, game board makers, chili paste makers, and plastic waste sorters), and one focus group in Lahore (garment makers and brush makers) reported that the monsoon rains force them to suspend or reduce production. They cited several reasons for this: raw materials or finished goods get damaged when roofs leak or during transport; products (e.g. incense sticks and plastic) cannot dry due to leaks and humidity; factories, firms, or contractors reduce work orders due to decreased demand and/or difficulties associated with transport during the rains. As one home-based worker in Ahmedabad FG 10 – a mixed group of garment makers and incense stick rollers – put it: “The poor [kutcha] quality of our housing creates difficulty for our work during the rainy season. The rain water leaks from the roof into our houses, sometimes causing the cloth or the
  • 24. 18 IEMS Informal Economy Monitoring Study incense sticks to get wet. If the goods are spoiled, the cost is deducted from our wages by the firm owner/contractor. Our sewing machines function poorly during the rainy season - this affects the efficiency of our work. It also affects the output – or quantity – of our work and ultimately our income.” In Bangkok, two home-based workers in Focus Group 15 who staple numbers onto game boards discussed their challenges. The first noted: “I have difficulty to carry the big sheets [3 x 4 ft.] of cardboard, which is our finished stapling work, to our contractor’s house. I am afraid that our finished work might be destroyed by the rain and I will have to pay for the damage. So I put them into a plastic bag.” The second said: “If the rain destroys my work, I have to pay 50 baht per piece for the damage instead of getting 50 baht for my wage. It means that I lose 100 baht per piece.” Festival seasons, in contrast, are periods of high demand and production. A few focus groups and individual workers mentioned that they intensify or diversify their production before and during festival seasons – to take advantage of the increased demand. One incense stick roller in Ahmedabad mentioned that during the rainy season, when she cannot roll incense sticks, she makes sacred thread bracelets (called rakhi) for a Hindu festival called Raksha Bandhan. During this festival, celebrated during the monsoon season, sisters tie rakhi on the wrists of their brothers as a ritual gesture to seek protection. 1.3.5 Piece Rates & Earnings Despite their heterogeneity, home-based workers tend, on average, to have low earnings. In part this is because they work at home: isolated from other workers in their sector (apart from those in their neighbourhood) and with limited knowledge of markets, market prices and the economic value of what they produce (especially if they are sub-contracted). These factors limit their ability to bargain for better prices or higher piece rates. The study findings confirm that the piece rates paid to sub-contracted workers tend to be quite low, especially in Ahmedabad and Lahore. The median piece rate for a specified unit of main products of the home-based worker sample, reported in the survey and converted into US cents, was 27 cents in Ahmedabad, 32 cents in Lahore, and 71 cents in Bangkok. Tables 4 and 5 present the piece rates reported by the focus groups for different garment and non-garment products, including the number of pieces the home-based worker makes per day, with or without help, and her daily gross earnings.10 Table 4. Piece Rates, Daily Output, and Daily Gross Earnings Reported by Sub-Contracted Garment Makers, by City City/Products Piece/Unit rate Pieces/Units Per Day (unless otherwise specified) & Without Help Unless Specified Gross Earnings Per Day (unless otherwise specified)* Ahmedabad Tunic (kameez) 6-7 rupees per piece 30 rupees per dozen 20 (with 1 helper) 1 dozen 140 rupees (USD 2.52) 30 rupees (USD 0.54) Tunic (punjabi) 6 rupees per piece 30 (with 1 helper) 180 rupees (USD 3.24) Pant (salwar) 6-7 rupees per piece 40 rupees per dozen 12 NA 72-84 rupees (USD 1.29-1.51) NA Skirt (lehnga) 40 rupees per dozen 6 dozen (with 3 helpers) 240 rupees (USD 4.32) Petticoat (chania) 2-2.25 rupees per piece 1 dozen 24-27 rupees (USD 0.43-0.49) 10 It is important to note that the reported daily earnings should be seen as gross earnings, not net earnings, since sub- contracted home-based workers have to cover many of the non-wage costs of production – including workplace, equipment, supplies, power and transport – out of their piece-rate earnings.
  • 25. 19IEMS Sector Report: Home-Based Workers Shirt 10 rupees per piece 10 100 rupees (USD 1.80) Pant 10 rupees per piece 8 80 rupees (USD 1.44) Frock 80-120 per dozen (depending on size & whether patterned) 1 dozen patterned or 2 dozen plain 160-240 rupees (USD 2.88-4.32) Women’s garments 8-20 per piece 6-30 pieces 48-600 rupees (USD 0.86-10.79) Infant wear 15 per dozen 10 dozen 150 rupees (USD 2.70) Underwear 20 per dozen 20 – 25 dozen 400-500 rupees (USD 7.19-8.99) Bangkok Modern garments 18 – 22 baht per piece 200 pieces per month 3000-4000 baht/month (USD 95.63—127.51) Sandals 5-8 baht per pair 4-100 (depends on other work/family responsibilities) 20-800 baht (USD 0.64-25.50) Lahore Wedding outfits 800-1000 per outfit 1 outfit per 2-3 days 266-500 rupees (USD 2.779-5.21) Shirts & pants 6 rupees per piece 2 dozen 144 rupees (USD 1.50) Embroidery on women’s dresses 10 rupees per piece 10 60-70 (with helper) 100-700 rupees (USD 1.04-7.29) School uniforms: shirts & pants 9 rupees per pant & 20 rupees per shirt 55-122 with help 1100 rupees (USD 11.46) Shirts 120 rupees per shirt 2 (with 1 helper) 240 rupees (USD 2.50) Decorative uppers of shoes 30 rupees per dozen 6 rupees per strip (1.5 yards) of shoe decoration 2 – 3 dozen 18 strips (with help) 60-90 rupees (USD 0.63 -0.94) 108 rupees (USD 1.13) Beadwork on shoe uppers 35 rupees per packet (packet has 1400 beads) 1 – 2 packets (with help) 35-70 rupees (USD 0.36 – 0.73) Shirts 8 – 10 rupees per shirt 3 24 – 30 rupees (USD 0.25 – 0.31) Dresses 100 – 150 rupees per dress 2 200-300 rupees (USD 2.08-3.13) Purses 200 rupees per 12 dozen 12 dozen per 2-3 days 200 rupees/2-3 days (USD 2.14) Beadwork on shirts 10 rupees per shirt 3-4 per day (with help) 30-40 rupees (USD 0.31 – 0.42) * Note: Currency was converted to USD equivalent, not adjusted for purchasing power parity, using the prevailing exchange rates on 01 September 2012 per http://www.oanda.com/currency/converter/ as follows: Indian rupee (55.4834) or 1 rupee = USD .01798 Thai baht (31.2332) or 1 baht = USD .03188 Pakistani rupee (93.4231) or 1 rupee = USD .01042 Source: IEMS Focus Groups (2012)
  • 26. 20 IEMS Informal Economy Monitoring Study Table 5. Piece Rates, Daily Output, and Daily Gross Earnings Reported by Sub-Contracted Non-Garment Makers, by City City/Products Piece/Unit rate Pieces/Units Per Day (un- less otherwise specified) & Without Help (unless specified) Gross Earnings Per Day (unless otherwise specified)* Ahmedabad All incense sticks (not differentiated by type) 12-15 rupees per 1000 (higher if directly from firm; lower if through contractor) 3000-9000 (depending on hours of work, age of worker, whether family helpers) 10,000 – 15,000 (with helpers) 36-105 rupees (USD 0.65-1.89) Oil-based incense sticks 10-17 rupees per 1000 5000-6000 50- 60 rupees (USD 0.90 – 1.08) Water-based incense sticks 12-14 rupees per 1000 4000-6000 48-72 rupees (USD 0.86 – 1.29) Cushion & pillow covers 10 per dozen 5-6 dozen 50-60 rupees (USD 0.90 – 1.08) Handkerchiefs/ lace edging handkerchiefs 2 per dozen 5 – 6 per piece (includes cutting cloth) 20-25 dozen 5 – 7 40-50 rupees (USD 0.72-0.90) 25-42 rupees (USD 0.45 - 0.76) Door hangings (toran) 15 per piece 5 – 7 75-105 rupees (USD 1.35 – 1.89) Curtains 12 per piece 5 – 7 60-84 (USD 1.08 – 1.51) Bangkok Flower garlands 30 baht per 1000 1000 30 baht (USD 0.96) Sorting plastic waste 5 baht per kilo 100 kilo per week 500 baht per week (USD 15.94) Diapers 0.25-0.30 baht per piece up to 1000 pieces 250-300 baht (USD 7.97 – 9.56) Bags 1-1.30 baht per piece 100-200 pieces 100-260 baht (USD 3.19-8.29) Lahore Shoe boxes 100 rupees per 1000 1000 (with help) 100 rupees (USD 1.04) Necklaces 7 rupees per dozen 1 dozen per 10-15 days 84 rupees per 10-15 days (USD 0.88) Pulling threads – from used clothing 70 paisa per yard 1 yard 70 paisa (USD 0.01) Shopping bags (paper) 15 rupees per 1000 bags 3000 (with help) 45 rupees (USD 0.47) Polyester rolls for quilts 10 rupees for 1.25 kilos 3-4 “bundles” = 20 kilos 160 rupees (USD 1.67)
  • 27. 21IEMS Sector Report: Home-Based Workers Quilts 50 rupees per quilt - - Handbags & purses 70 – 80 rupees per 100 bags 100 (with help) 70-80 rupees (USD 0.73 – 0.83) * Note: Currency was converted to USD equivalent, not adjusted for purchasing power parity, using the prevailing exchange rates on 01 September 2012 per http://www.oanda.com/currency/converter/ as follows: Indian rupee (55.4834) or 1 rupee = USD .01798 Thai baht (31.2332) or 1 baht = USD .03188 Pakistani rupee (93.4231) or 1 rupee = USD .01042 Source: IEMS Focus Groups (2012) Table 6 summarizes the range of reported daily gross earnings by city and product category in US dollars at the prevailing exchange rate when the fieldwork was carried out, not adjusted for purchasing power parity. Two outliers in Lahore – USD 0.01 per day for pulling threads from used clothing and USD 0.07 per day for making necklaces – were excluded from the range. Nonetheless, the range is very wide, especially for garments, in all three cities. The piece rates converted into daily gross earnings (by estimating how many pieces a home-based worker can make per day) are mostly between USD 1 and 3 per day. But in each city, some garment makers do very well, presumably because they are able to produce large quantities usually with help from unpaid family workers or hired workers, while others do very poorly. Table 6. Range of Gross Daily Earnings Reported by Sub-Contracted Home-Based Workers, by Product Type and City (USD) City/Product Garment Non-Garment Ahmedabad $0.38 (petticoats) - $9.60 (women's garments) $0.40 (handkerchiefs) - $1.68 (door hangings) Bangkok $0.62 (sandals) - $6.20 (modern garments) $0.93 (flower garlands) - $9.30 (diapers) Lahore $0.22 (shirts) - $9.90 (school uniforms) $0.41 (paper bags) - $1.44 (quilts) Source: IEMS Focus Groups (2012) The survey findings confirm that the median net monthly earnings of home-based workers were very low in Ahmedabad (USD 27) and especially Lahore (USD 16): see table 7. Indeed, 29 per cent of the home-based workers in Lahore operated at a loss: see table 8. Also, among the total sample, one quarter of those who had to pay for transport operated at a loss. Nearly the total sample in Ahmedabad and two-thirds of the sample in Lahore earned less than USD 100 per month, compared to around 30 per cent in Bangkok. A far higher percentage of self-employed than sub-contracted workers earned more than USD 200 per month in both Bangkok and Lahore: see table 9. Also, among the self-employed in Bangkok and Lahore, those who hired workers for some period in the year were more likely to operate at a loss but also far more likely to earn more than USD 200 per month, compared to own account workers or unpaid contributing workers. This finding speaks to both the entrepreneurial risk and the entrepreneurial potential of growing a business. Another way to consider the levels of earnings among the home-based workers is to consider intra- city distributions: specifically, what percentage in each city earns less than two thirds of their city median or are in the poorest earning quintile of their city distribution.11 Nearly one-third of the total sample of home-based workers across the three cities earns less than two thirds of their city median (table 7). In Bangkok, compared to Ahmedabad and Lahore, median earnings are much higher but a far larger percentage (41 per cent) is clustered well below the median. In other words, earnings are 11 Given the diversity of settings and sectors in our sample, earnings are presented in relative terms throughout the report. Where earnings are presented in USD or adjusted for purchasing power parity (PPP), these figures are meant to be indica- tive only and should be treated with caution. Comparisons with the $1/day or $1.25/day poverty lines are not made in this report because the earnings module from the IEMS survey differs significantly from the way in which information on income and earnings is collected in national household surveys, and only limited information on total household income is collected in the IEMS questionnaire.
  • 28. 22 IEMS Informal Economy Monitoring Study higher but more unequally distributed in Bangkok than in the two other cities; while earnings are lower and more unequally distributed in Lahore compared to Ahmedabad. Status in employment or product type does not make much difference to the risk of being in the lowest earnings categories. However, the self-employed are twice as likely to be in the richest earning quintile in their city compared with the sub-contracted; and garment makers are far more likely to be in the richest quintile than non-garment makers (table 10). Table 7. Median Net Monthly Earnings and Work-Related Expenditures by City Ahmedabad Bangkok Lahore Total Median monthly net earnings (unadjusted USD - 2012 prices) 27.36 139.05 15.75 32.30 Median monthly net earnings (PPP adjusted USD- 2012 prices) 68.39 231.75 39.37 78.75 Median total monthly work-related expenditure (USD) 3.80 29.16 21.00 12.08 Earn less than 2/3 of their city-sector median (%) 24.49 41.33 31.33 32.44 N 147 148 139 447 * Median, rather than mean, earnings and expenditures. Work-related expenditures include material inputs, lights and electricity and transport Source: IEMS survey data (2012) Table 8. Levels of Net Monthly Earnings, by City (% distribution) Ahmedabad Bangkok Lahore Total Operating at a loss 0.00 7.19 29.05 12.21 Breaking even 0.00 0.72 0.68 0.46 < USD 100 per month 99.32 29.50 63.51 64.75 USD 100-200 per month 0.68 28.06 2.70 10.14 > USD 200 per month 0.00 34.53 4.05 12.44 Total 100.00 100.00 100.00 100.00 N 147 139 148 434 Source: IEMS survey data (2012) Table 9. Levels of Net Monthly Earnings by Self-Employed and Sub-Contracted in Bangkok and Lahore (% distribution) Bangkok Lahore Self-Employed Sub-Contracted Self-Employed Sub-Contracted Operating at a loss 14.29 2.41 23.81 32.94 Breaking even 1.79 0.00 1.59 0.00 < USD 100 per month 19.64 36.14 60.32 65.88 USD 100-200 per month 19.64 33.73 4.76 1.18 > USD 200 per month 44.64 27.71 9.52 0.00 Total 100.00 100.00 100.00 100.00 N 56 83 63 85 Source: IEMS survey data (2012)
  • 29. 23IEMS Sector Report: Home-Based Workers Table 10. City-Level Earnings Distribution by Status in Employment and Product Type (%) Status in Employment Product Type Self-Employed Sub-Contracted Non-Garment Garment Poorest quintile 20.17 21.59 23.56 19.34 Richest quintile 30.25 15.24 14.66 23.05 N 119 315 191 243 Source: IEMS survey data (2012) Further, it is important to consider earnings variations among home-based workers within each city by their status in employment, their age group, and their marital status: see table 11. In terms of status in employment, median net monthly earnings are lower for sub-contracted workers (USD 28.50) than for the self-employed (USD 63.49). In addition, a slightly higher percentage of sub-contracted workers (22 per cent) than of self-employed workers (20 per cent) are in the poorest earnings quintiles of their cities. In terms of age groups, median net monthly earnings are highest (USD 51.84) among the oldest age group (55+ years); and lowest (USD 25.95) among the 25-34 age group. But the oldest age group also has the highest percentage (31 per cent) in the poorest earning quintile while the 25-34 age group has a relatively low percentage (14 per cent), second only to the youngest age group (8 per cent). In terms of marital status, earnings were lowest among widows (USD 18.48) and highest among divorcees (USD 51.30). Also, widows are disproportionately represented in the poorest earnings quintile. In sum, these findings suggest a significant dispersion of incomes within each category with the exception of widows, suggesting the specific vulnerabilities of widows in some societies, notably in India (Chen 2000). Table 11. Median Net Monthly Earnings (unadjusted USD) and Percentage in the Poorest Earnings Quintile by Status in Employment, Age, and Marital Status Median Monthly Net Earnings (unadjusted USD) Poorest Quintile (%) Status in Employment Self-employed 63.49 20.00 Sub-contracted 28.50 21.59 Age Group 15-24 31.35 7.69 25-34 25.95 14.06 35-44 31.61 21.23 45-54 34.20 23.73 55+ 51.84 30.77 Marital Status Married/cohabit 34.20 21.12 Divorced 51.30 0.00 Widowed 18.48 31.37 Never married 22.80 14.89 Source: IEMS survey data (2012) To sum up, the earnings of the home-based workers in the sample are, on average, quite low and erratic. Sub-contracted workers earn less on average than self-employed workers. Compared to the sub-contracted, a roughly equal percentage of the self-employed are in the poorest earning quintile of their city but a far higher percentage are in the richest earning quintile. These findings reflect the entrepreneurial risk and potential of self-employment. Compared to those who make other products,
  • 30. 24 IEMS Informal Economy Monitoring Study garment makers are less likely to be in the poorest earnings quintile and more likely to be in the richest earning quintile of their city. Among all the home-based workers, in regard to age and marital status, the likelihood of being in the poorest earnings quintile increases with age but the oldest age groups (45-54 and 51+) have the highest net monthly earnings; while those who are divorced are least likely to be in the poorest earnings quintile and enjoy the highest net monthly earnings; followed by married women. One concluding thought about the low level and erratic earnings of home-based workers. If we think of an earnings and expenditure ledger, the net earnings of the home-based workers – both self- employed and sub-contracted – are subject to costs of production (including workplace, equipment, utilities, and transport), risks of production (including fluctuating demand, prices and competition as well as delayed payments), and factors largely out of their control that create work stoppages (including power outages/load shedding, leaks and flooding of their houses-cum-workplaces, competing demands on their time). Moreover, home-based workers have limited scope for negotiation or leverage: due in large part to their isolation but also to exclusionary urban policies or practices as well as unequal or exploitative value chain dynamics. However, there are some home-based workers who do relatively well. It is important to learn from their example what would help other home- based workers earn more. But clearly, reducing the costs and risks of production associated with home-based work and addressing the structural factors that create work stoppages in homes-cum- workplaces are of critical importance to all home-based workers.
  • 31. 25IEMS Sector Report: Home-Based Workers Part 2: Drivers & Responses The IEMS was designed to investigate how three sets of driving forces affect urban informal workers: wider economic trends; government policies and practices (specifically, but not exclusively, at the city- level); and value chain dynamics and relationships. As used in the study, the term “driving forces” refers to systemic factors that may impact, in either positive or negative ways, on the occupations or livelihoods of urban informal workers. The study also explored how the informal workers respond to the various driving forces, and which institutions help or hinder the ability of informal workers to respond effectively to these driving forces. Further, the study tested a set of hypotheses about the nature and behaviour of the urban informal economy and its relationship to the formal economy. Both study methods – focus group tools and the survey questionnaire – were used to investigate the driving forces and responses. In the focus groups, as opposed to the survey questionnaire, the options were not pre-defined: the participants were asked to specify whether and how the three sets of driving forces affected them and then to rank which driving forces had the greatest impact on their work, either negative or positive. The focus groups ranked more driving forces as negative rather than positive. But they also ranked many driving forces as both negative and positive. Table 12 presents the frequency with which the three sets of driving forces – the wider economy, government policies and practices, and value chain dynamics – were ranked as major negative or positive forces by the 15 focus groups in each study city. IncenserollerinAhmedabad.Photo:L.Vryenhoek
  • 32. 26 IEMS Informal Economy Monitoring Study Table 12. Ranking of Three Sets of Driving Forces as Negative (-) or Positive (+) by City (# of Focus Groups) Driving Forces Ahmedabad Bangkok Lahore Total - + - + - + - + Wider economic trends 0 1 16 4 16 0 32 5 Government/City policies 20 10 13 18 24 16 57 44 Value chain dynamics 25 0 11 16 3 0 39 16 Other 0 0 0 1 1 1 1 2 Source: 45 IEMS Focus Groups (2012) The top ranked negative forces were inflation, prioritized by 22 focus groups (14 in Lahore, 5 in Bangkok, 3 in Ahmedabad), and shortages-cum-high cost of electricity, prioritized by 21 focus groups (15 in Lahore, 6 in Ahmedabad). Other major negative forces included: inadequate housing, prioritized by 17 groups (11 in Ahmedabad, 5 in Bangkok, 1 in Lahore); recession or low demand, prioritized by 13 focus groups (11 in Bangkok, 2 in Lahore); and low earnings (for the self-employed) or low piece rates (for the sub-contracted), prioritized by 12 focus groups (11 in Ahmedabad, 1 in Lahore). The top ranked positive forces were infrastructure services (electricity in Bangkok; roads, water and sanitation in Lahore), free education and health (in Bangkok), and regular orders or customers (also only in Bangkok). The survey findings also present a mixed picture: see table 13. Well over two thirds of the respondents (69 per cent) reported the inability to bargain was a key negative force. Over half (53 per cent) reported increased competition. Well over half (57 per cent) reported low prices of finished goods while nearly half (47 per cent) reported high prices of raw materials. One third (33 per cent) reported that the lack of basic infrastructure services was a key negative force. Roughly equal percentages reported increased and decreased work orders (around 30 per cent each) or increased and decreased customers/buyers (around 25 per cent each). Table 13. Key Driving Forces by Self-Employed and Sub-Contracted (%) Self-Employed Sub-Contracted All HBWs Decreased demand (work orders) 31.45 32.26 32.03 Increased demand (work orders) 30.65 30.32 30.41 Decreased demand (customers/buyers) 25.64 22.30 23.83 Increased demand (customers/buyers) 29.06 23.74 26.17 High cost of raw materials 68.22* 37.66 46.52 Low price of finished goods 63.57 54.11 56.85 More competition 38.60* 58.54 52.87 Less competition 12.28 6.97 8.48 Lack of basic infrastructure 26.36* 36.39 33.48 Difficulty transporting goods to market 24.03* 15.24 17.79 Inability to bargain 56.59* 73.42 68.54 N 129 315 444 *Statistically significant at the .05 level. Note: Respondents could identify more than one driving force Source: IEMS survey data (2012)
  • 33. 27IEMS Sector Report: Home-Based Workers To sum up, several key points about the driving forces should be noted. First, while negative findings outweighed positive findings, the results were mixed. Second, the key driving forces prioritized by the focus groups – both negative and positive – differed significantly by city. Indeed, a distinct negative driving force seems emblematic of each city: inadequate housing in Ahmedabad, floods in Bangkok, and an acute electricity crisis in Lahore. The study findings reflect the overall situation in the study cities. In Ahmedabad, there are a number of large-scale urban renewal projects associated with evictions and relocations across the city. Bangkok, the capital city of an upper middle income country, has better infrastructure than the other two cities, both of which are non-capital cities of lower middle income countries.12 But there was severe flooding in much of Thailand in 2011. All of Pakistan, not just Lahore, is facing an acute energy crisis. Finally, from the survey findings, it is clear that the key negative driving forces are different for self-employed and sub-contracted workers. A significantly higher percentage of the self-employed reported the high cost of raw materials and transporting goods as problems. This is because the self-employed have to buy raw materials and supplies (while the sub-contracted have to buy only a limited set of supplies) and, also, the self-employed have to commute/transport goods to markets more frequently than sub-contracted workers. A significantly higher percentage of sub-contracted workers identified increased competition, basic infrastructure problems, and the inability to bargain as key barriers. The sub-contracted have less experience in bargaining than the self-employed who have to bargain with suppliers and buyers on a regular basis. Ahmedabad, where the sample is all sub-contracted, is the one city where the focus groups did not rank any infrastructure services as positive: this may help explain why, in the total sample across the three cities, more sub-contracted than self-employed workers prioritized basic infrastructure problems. This section starts with a discussion of the main negative driving forces prioritized by the focus groups. It analyzes the impact of these forces on the home-based workers, their work, and families, then summarizes the responses by the home-based workers to these forces. 2.1 Drivers 2.1.1 Macroeconomic Trends In all three countries, economic growth slowed down significantly during 2008, the year that marked the beginning of the Great Recession. The Indian economy rebounded significantly during 2009 and 2010, slowed down in 2011 and then declined markedly during 2012. The Pakistan economy recovered slowly but not to its pre-crisis level of growth. The Thai economy proved quite volatile: experiencing negative growth in 2009, a notable rebound in 2010, another slump in 2011 (severe floods inundated much of the country during the second half of the year), and another rebound in 2012 to above its pre-crisis level of growth: see table 14. Inflation increased in all three countries between 2007 and 2012. Inflation in India increased steadily to double-digit levels in 2009 and 2010, went down a bit in 2011 and then up a bit in 2012 to just over 9 per cent. In Pakistan, inflation increased dramatically during 2008 (to over 20 per cent), remained at double-digit levels (in the teens) for three years, and then declined to just under 10 per cent in 2012. In Thailand, inflation went up in 2008, dropped dramatically in 2009 (to -0.9 per cent) and then tapered off at 3 per cent in 2012, slightly higher than the pre-crisis level: see table 14. 12 Thailand is an upper middle income country while India and Pakistan are lower middle income countries, reflected in their gross national income (GNI) per capita. GNI Per Capita GNI Per Capita, adjusted for purchasing power parity India USD 1,580 USD 3,640 Pakistan USD 1,260 USD 2,750 Thailand USD 5,210 USD 8,620 Source: World Bank 2011
  • 34. 28 IEMS Informal Economy Monitoring Study Table 14. GDP Growth Rate and Inflation: India, Pakistan & Thailand 2007-2012 GDP Growth Rate (annual %) Inflation, Consumer Prices (annual %) 2007 2008 2009 2010 2011 2012 2007 2008 2009 2010 2011 2012 India 9.8 3.9 8.5 10.5 6.3 3.2 6.4 8.4 10.9 12 8.9 9.3 Pakistan 5.7 1.6 3.6 3.5 3 4.2 7.6 20.3 13.6 13.9 11.9 9.7 Thailand 5 2.5 -2.3 7.8 0.1 6.4 2.3 5.4 -0.9 3.3 3.8 3 Sources: The World Bank, website: http://data.worldbank.org/indicator/NY.GDP.MKTP.KD.ZG; http://data. worldbank.org/indicator/FP.CPI.TOTL.ZG; and http://data.worldbank.org/indicator/SL.UEM.TOTL.ZS The findings from the focus groups and survey, conducted in August and September 2012, indicate that these aggregate economic patterns were mirrored at the base of the economy. The macroeconomic trends were both experienced by and understood by the home-based workers in the sample. Table 15. Wider Economy: Negative and Positive Driving Forces by City (# of focus groups) Driving Forces Ahmedabad Bangkok Lahore Total Negative Inflation 3 5 14 22 Recession/Low demand 0 11 2 13 Increased competition 0 3 0 3 Totals 3 19 16 38 Positive Strong demand (especially during festivals) 1 4 0 5 Totals 1 4 0 5 Source: 45 IEMS Focus Groups (2012) Inflation Across the three cities, nearly half (47 per cent) of the survey respondents cited the high cost of inputs as a problem: see table 13. In Bangkok and Lahore, where the sample includes both self-employed and sub-contracted workers, over half of the sample reported that the high cost of inputs was a problem. Inflation was prioritized as a major driving force by 14 (93 per cent) of the focus groups in Lahore and 5 (33 per cent) of the focus groups in Bangkok: see table 15. The impact of inflation as a major negative driving force in Lahore was captured in the phrase “inflation is killing us” (Lahore FG 1). Three of the focus groups in Ahmedabad prioritized inflation as a negative driving force and two other focus groups discussed inflation without prioritizing it. The key informants interviewed in Ahmedabad also mentioned that inflation, especially the high cost of food, water, and energy, was forcing many would- be customers to avoid buying clothing and other non-essentials. In other words, according to the key informants, inflation was lowering demand: this may help explain the high percentage of focus groups in Ahmedabad (73 per cent) that ranked low earnings as a significant negative driver. In Bangkok, five focus groups ranked inflation as a major driving force. One group, all self-employed dress makers, discussed the impact of increased prices in their sector (FG 12). One of the women began the discussion with the following observation: “The prices of raw materials and dressmaking equipment and accessories have increased but the wages for dressmaking have still not increased.” Another added ruefully: “The labour cost for making dresses hasn’t increased for almost 20 years.” Two others commented on the need for capital in the dress-making sector. “To order a dress the customer needs a lot of money,” said one. The second noted: “To make a dress we need more money than in the past. On the other hand, our capacity to invest is reduced.”