Aranca views - China Property Market: Prepare for the End Game?
•
1 like•475 views

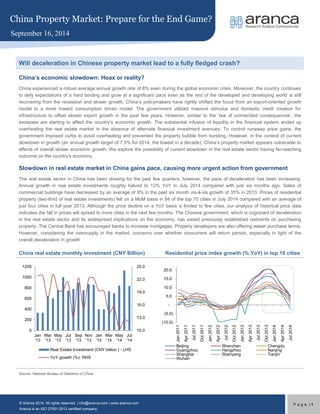
The real estate sector in China has been slowing for the past few quarters; however, the pace of deceleration has been increasing. Aranca's article provides the latest data, statistics, analysis and forecast of the China property market.

Recommended
Recommended
More Related Content
What's hot
What's hot (19)
Viewers also liked
Similar to Aranca views - China Property Market: Prepare for the End Game?
Similar to Aranca views - China Property Market: Prepare for the End Game? (20)
More from Aranca
More from Aranca (20)
Recently uploaded
Recently uploaded (20)
Aranca views - China Property Market: Prepare for the End Game?
- 1. susssussuPoet China Property Market: Prepare for the End Game? September 16, 2014 © Aranca 2014. All rights reserved. | info@aranca.com | www.aranca.com Aranca is an ISO 27001:2013 certified company Page | 1 Will deceleration in Chinese property market lead to a fully fledged crash? China’s economic slowdown: Hoax or reality? China experienced a robust average annual growth rate of 8% even during the global economic crisis. Moreover, the country continues to defy expectations of a hard landing and grow at a significant pace even as the rest of the developed and developing world is still recovering from the recession and slower growth. China’s policymakers have rightly shifted the focus from an export-oriented growth model to a more inward consumption driven model. The government utilized massive stimulus and domestic credit creation for infrastructure to offset slower export growth in the past few years. However, similar to the ‘law of unintended consequences’, the excesses are starting to affect the country’s economic growth. The substantial infusion of liquidity in the financial system ended up overheating the real estate market in the absence of alternate financial investment avenues. To control runaway price gains, the government imposed curbs to avoid overheating and prevented the property bubble from bursting. However, in the context of current slowdown in growth (an annual growth target of 7.5% for 2014, the lowest in a decade), China’s property market appears vulnerable to effects of overall slower economic growth. We explore the possibility of current slowdown in the real estate sector having far-reaching outcome on the country’s economy. Slowdown in real estate market in China gains pace, causing more urgent action from government The real estate sector in China has been slowing for the past few quarters; however, the pace of deceleration has been increasing. Annual growth in real estate investments roughly halved to 12% YoY in July 2014 compared with just six months ago. Sales of commercial buildings have decreased by an average of 9% in the past six month vis-à-vis growth of 35% in 2013. Prices of residential property (two-third of real estate investments) fell on a MoM basis in 64 of the top 70 cities in July 2014 compared with an average of just four cities in full year 2013. Although the price decline on a YoY basis is limited to few cities, our analysis of historical price data indicates the fall in prices will spread to more cities in the next few months. The Chinese government, which is cognizant of deceleration in the real estate sector and its widespread implications on the economy, has eased previously established restraints on purchasing property. The Central Bank has encouraged banks to increase mortgages. Property developers are also offering easier purchase terms. However, considering the oversupply in the market, concerns over whether consumers will return persist, especially in light of the overall deceleration in growth China real estate monthly investment (CNY Billion) Residential price index growth (% YoY) in top 10 cities Source: National Bureau of Statistics of China 10.0 13.0 16.0 19.0 22.0 25.0 0 200 400 600 800 1000 1200 Jan '13 Mar '13 May '13 Jul '13 Sep '13 Nov '13 Jan '14 Mar '14 May '14 Jul '14 Real Estate Investment (CNY billion ) - LHS YoY growth (%)- RHS (10.0) (5.0) - 5.0 10.0 15.0 20.0 Jan 2011 Apr 2011 Jul 2011 Oct 2011 Jan 2012 Apr 2012 Jul 2012 Oct 2012 Jan 2013 Apr 2013 Jul 2013 Oct 2013 Jan 2014 Apr 2014 Jul 2014 Beijing Shenzhen Chengdu Guangzhou Hangzhou Nanjing Shanghai Shenyang Tianjin Wuhan
- 2. susssussuPoet China Property Market: Prepare for the End Game? September 16, 2014 © Aranca 2014. All rights reserved. | info@aranca.com | www.aranca.com Aranca is an ISO 27001:2013 certified company Page | 2 Unstable demand factors, whereas supply abounds Real estate demand in China is dominated by the residential segment (two-third of real estate investments). Demand for residential real estate is driven by socioeconomic factors, such as demographics, increased urbanization, and subsequent migration to urban centers; social norms (self-owned property prior to marriage); and demand due to the absence of viable alternate investment opportunities for the increasingly affluent Chinese population. Due to structural financial suppression (cap on deposit rates) and low real returns (post inflation), Chinese consumers opt for short-term investment avenues, including shadow banking products, such as wealth management and trust products. Investment in real estate represents an alternate to shadow banking. Speculative short-term demand accounts for up to 20% of demand in tier-1 cities, according to research by JP Morgan. Owing to the current overall slowdown in economic growth rate (7.5%) and the crackdown on corruption, real demand for property has been decreasing, as reflected in the residential price indices of 70 cities. In addition, Chinese property developers face concerns over unsold inventory, leading to financial stress. Residential prices decline in 64 of top 70 cities in July on MoM basis; YoY fall to follow over next six months? The monthly price index of 70 cities published by the National Bureau of Statistics of China indicates a rapid decline in the real estate sector, especially the residential segment. Compared with price increases (on a MoM basis) in 65 of the 70 cities in December 2013, prices declined in 64 cities in July 2014. In the previous instance of a similar deterioration in MoM price changes (starting June 2011), the sector required an entire year to recover (by July 2012). Furthermore, our analysis indicates that on a YoY basis, the fall in prices takes place with a lag of ~6 months, which implies we expect the YoY fall in prices to extend to more cities during the next six months. MoM vis-à-vis YoY price changes in 70 cities (lag factor of ~6 months) Source: National Bureau of Statistics of China 0 10 20 30 40 50 60 70 Jan-11 Jun-11 Nov-11 Apr-12 Sep-12 Feb-13 Jul-13 Dec-13 May-14 Oct-14 Number of cities with price changes on MoM basis 0 10 20 30 40 50 60 70 Jan-11 Jun-11 Nov-11 Apr-12 Sep-12 Feb-13 Jul-13 Dec-13 May-14 Oct-14 Number of cities with price changes on a YoY basis Increase in prices Decrease in prices Constant 6 months Past bottom of property price decline on a MoM basis Past bottom of property price decline on a YoY basis Recent bottom of property price decline on a MoM basis 6 months months New bottom of property price decline on a YoY basis?
- 3. susssussuPoet China Property Market: Prepare for the End Game? September 16, 2014 © Aranca 2014. All rights reserved. | info@aranca.com | www.aranca.com Aranca is an ISO 27001:2013 certified company Page | 3 The changes in severity in price declines on a YoY basis are also of interest. On plotting the maximum increase and decrease in price in any of the 70 cities surveyed, we find price declines of up to 16% YoY occurred during the last real estate slump in China (April– October 2012). Furthermore, the maximum price increases and declines appear to follow a definite trend, with the current trend continuing until it reaches a bottom or a peak. The current trend is that of a decline in prices, with new lows of maximum price increases and maximum price decreases witnessed over the past few months. We believe the trend will continue over the next few months as well, leading to a more widespread slowdown in the real estate sector. Maximum price increases and declines (%YoY) in 70 cities Source: National Bureau of Statistics of China Chinese government and Central Bank keen on arresting slowdown in property market The real estate sector contributed 16% or one-sixth to growth in China’s economy last year, according to the World Bank. Hence, the Chinese government and the Central Bank (People’s Bank of China) are making significant efforts to stem the slump in the real estate market. They have removed several restrictions on property purchases (related to second home purchases, cash requirement for payment, and restrictions on mortgage loans, among others) and continue to encourage purchases of homes. Time/period Action taken by government/regulators/banks August 2014 China to consider allowing listed developers to sell interbank bonds August 2014 Major banks start offering discounts on home loans June 2014 onward Local governments easing restrictions on home purchases, especially second home purchases April 2014 China Securities Regulatory Commission allows four real estate companies to sell mortgage-backed-bonds for the first time since 2009 Source: Media reports (16) (11) (6) (1) 4 9 14 19 24 Jan-11 Apr-11 Jul-11 Oct-11 Jan-12 Apr-12 Jul-12 Oct-12 Jan-13 Apr-13 Jul-13 Oct-13 Jan-14 Apr-14 Jul-14 Maximum Decrease Maximum Increase
- 4. susssussuPoet China Property Market: Prepare for the End Game? September 16, 2014 © Aranca 2014. All rights reserved. | info@aranca.com | www.aranca.com Aranca is an ISO 27001:2013 certified company Page | 4 Property developers offer easier purchase terms, following collapse of Zheijian Xingrun Real Estate In March 2014, the privately owned Zhejiang Xingrun Real Estate Co. reportedly collapsed and its majority shareholder and his son were arrested. The company had assets worth 3 billion yuan; however, the company owed debt of 3.5 billion yuan to more than 15 banks, of which more than 1 billion yuan was owed to China Construction Bank alone. Zhejiang, a relatively small developer, symbolizes the survival challenges faced by hundreds of smaller real estate developers. Soon after the collapse of Zheijian, China’s largest property developers, including the largest China Vanke Co., Greentown China Holdings Ltd., and many more, reportedly reduced prices to enable sales. Considerable impact of ‘shadow banking’ on real estate sector Chinese real estate developers have been one of the major beneficiaries of the shadow banking industry in terms of borrowings; however, they may find it difficult, if not impossible, to repay their debt due to slower sales. Chinese developers need to repay at least $10.4 billion worth of bonds and loans maturing before the end of 2014, and another $23.9 billion by the end of 2015, according to a Bloomberg news report. Despite this debt burden, Chinese developers continue to borrow, even more so now, from the offshore loan market. Property developers have borrowed $5.9 billion (+39% YoY) from foreign banks this year so far, according to a Bloomberg news report. About CNY1.1 trillion or nearly one-tenth of trust investments (a shadow banking product) have already been allocated to real estate. In contrast, banks such as Industrial Bank Co. have suspended mezzanine financing for developers. Chinese developers have responded to the increasing difficulty in raising debt by issuing ‘perpetual notes’ (issuance of securities without set maturity dates) with high base rates of ~8% per annum, which would put further strain on their financials. Chinese real estate to deteriorate further before improving In Q12014, new property construction fell 25% YoY to 291 million square meters, the worst Q1 performance since 2009. Urban real estate investment contributes almost 10% to the Chinese economy. Despite low household leverage toward real estate, owing to the association between Chinese property developers and the banking sector via the shadow banking industry, the decelerating real estate market will put banks’ balance sheets at risk. In addition, the secondary effects of a real estate sector slump on industries such as construction machinery, construction materials, and metals, among others, would further impact the overall industrial growth rate. As the current overall economic growth target is just 7.5%, any deceleration in the industrial sector would imperil the government’s growth target. Although the government has already taken several steps to halt the decline and encourage growth, considering the excess supply scenario and constraints faced by developers in raising capital, we expect the slowdown to persist for some time to come. Chinese property developers’ financials continue to deteriorate; equity markets already factoring in impending crash in property market? The financials of listed Chinese property developers has reflected the continued weakness for the past four quarters. For the 54 listed Chinese real estate companies, revenue growth has slumped to 14% YoY in last quarter from 68% a year ago. Similarly, operating profit growth has crashed to just 4% YoY in latest quarter from 44% a year ago. Operating margins continue to fall yoy, while net income growth too is on a declining trend. The deteriorating financials are also reflected in stock prices with each of 54 listed company shares trading below their 52 week high, with the worst decline at 34% below peak. This contrasts with the Shanghai Composite index trading near its 52 week high. With a multitude of factors converging (overall growth slowdown, credit expansion slowing down, property price declines spreading to more number of cities) we believe it will be an uphill task for the Chinese government to spur growth in the real estate sector at present.
- 5. susssussuPoet China Property Market: Prepare for the End Game? September 16, 2014 © Aranca 2014. All rights reserved. | info@aranca.com | www.aranca.com Aranca is an ISO 27001:2013 certified company Page | 5 China listed developers revenue growth (% yoy) China listed developers net income growth (% yoy) and operating profit growth (%yoy) China real estate developers’ current stock price (% below 52 week high, from -34% to -10%) 68.3 46.8 33.7 14.3 44.1 33.0 20.5 4.3 0 10 20 30 40 50 60 70 80 Q3CY13 Q4CY13 Q1CY14 Q2CY14 Revenue (% YoY) Operating profit (% YoY) (44.9) 52.5 42.4 34.1 -50 -30 -10 10 30 50 Q3CY13 Q4CY13 Q1CY14 Q2CY14 -40 -35 -30 -25 -20 -15 -10 -5 0 China Merchants Property Development Co., Ltd. ShangHai Tianchen Co.,Ltd. Guangzhou R&F Properties Co., Ltd. Shenzhen International Enterprise Co., Ltd. Jiangsu Future Land Co., Ltd. Poly Real Estate Group Co Ltd. Xiamen Insight Investment Co.,Ltd China Enterprise Company Limited Join-In Holding Co.,Ltd Shanghai Industrial Development Co., Ltd. Tianjin Songjiang Co., Ltd. Tianjin Jinbin Development Co., Ltd. Beijing Centergate Technologies Shanghai Shimao Co.,Ltd. YunNan Metropolitan Real Estate Development Co., Ltd Lushang Property Co., Ltd. Beijing Dalong Weiye Real Estate Development Co.,Ltd Shenzhen Properties & Resources Development Group Ltd. DongGuan Winnerway Industrial Zone Ltd. BEIH-Property Co., Ltd Beijing Capital Development Co. Ltd. Gemdale Corp. Beijing Capital Land Ltd. Winsan (Shanghai) Industrial Corporation Ltd Huafa Industrial Co., Ltd. Zhuhai
- 6. susssussuPoet China Property Market: Prepare for the End Game? September 16, 2014 © Aranca 2014. All rights reserved. | info@aranca.com | www.aranca.com Aranca is an ISO 27001:2013 certified company Page | 6 China real estate developers’ current stock price (% below 52 week high, from -9% to -0.1%) Source: CapIQ, Stock Prices as on 15th September 2014 Research Note by: Nikhil Salvi Senior Research Analyst, Aranca -10 -9 -8 -7 -6 -5 -4 -3 -2 -1 0 China Vanke Co. Ltd. Cred-Chongshi Real Estate Corporation Limited Guoxing Rongda Real Estate Co., Ltd. Shanghai Chenghai Enterprise Development Co., Ltd. Tianjin Guangyu Development Co., Ltd. Tianjin Reality Development Shanghai Fenghwa Group Co., Ltd Zhongtian Urban Development Group Company Limited COFCO Property Beijing Urban Construction Investment & Development Co., Ltd. Cinda Real Estate Co., Ltd. Lvjing Holding Co., Ltd. Myhome Real Estate Development Group Co., Ltd. Nanjing Chixia Development Co., Ltd. Beijing Urban Construction Design & Development Group Co., Limited Yango Group Co., Ltd Financial Street Holding Co., Ltd. Beijing HOMEYEAR Real Estate Company Limited Wolong Real Estate Group Co.,Ltd. Jiangxi Zhongjiang Real Estate Co., Ltd Guangzhou Pearl River Industrial Development Co., Ltd. Beijing North Star Company Limited Shenzhen SEZ Real Estate & Properties Group Co. Ltd. Shandong Tyan Home Co., Ltd Jilin Guanghua Holding Group Company Limited Hainan Haide Industry Co.,Ltd. Hefei Urban Construction Development Co., Ltd Cosmos Group Co., Ltd. Greattown Holdings Ltd. Wedge Industrial Co., Ltd.
- 7. susssussuPoet China Property Market: Prepare for the End Game? September 16, 2014 © Aranca 2014. All rights reserved. | info@aranca.com | www.aranca.com Aranca is an ISO 27001:2013 certified company Page | 7 ARANCA DISCLAIMER This report is published by Aranca, Inc. Aranca is a customized research and analytics services provider to global clients. The information contained in this document is confidential and is solely for use of those persons to whom it is addressed and may not be reproduced, further distributed to any other person or published, in whole or in part, for any purpose. This document is based on data sources that are publicly available and are thought to be reliable. Aranca may not have verified all of this information with third parties. Neither Aranca nor its advisors, directors or employees can guarantee the accuracy, reasonableness or completeness of the information received from any sources consulted for this publication, and neither Aranca nor its advisors, directors or employees accepts any liability whatsoever (in negligence or otherwise) for any loss howsoever arising from any use of this document or its contents or otherwise arising in connection with this document. Further, this document is not an offer to buy or sell any security, commodity or currency. This document does not provide individually tailored investment advice. It has been prepared without regard to the individual financial circumstances and objectives of persons who receive it. The appropriateness of a particular investment or currency will depend on an investor’s individual circumstances and objectives. The investments referred to in this document may not be suitable for all investors. This document is not to be relied upon and should not be used in substitution for the exercise of independent judgment. This document may contain certain statements, estimates, and projections with respect to the anticipated future performance of securities, commodities or currencies suggested. Such statements, estimates, and projections are based on information that we consider reliable and may reflect various assumptions made concerning anticipated economic developments, which have not been independently verified and may or may not prove correct. No representation or warranty is made as to the accuracy of such statements, estimates, and projections or as to its fitness for the purpose intended and it should not be relied upon as such. Opinions expressed are our current opinions as of the date appearing on this material only and may change without notice. © 2014, Aranca. All rights reserved.