1. Kuwait Financial Centre “Markaz”
MENA REAL ESTATE RESEARCH
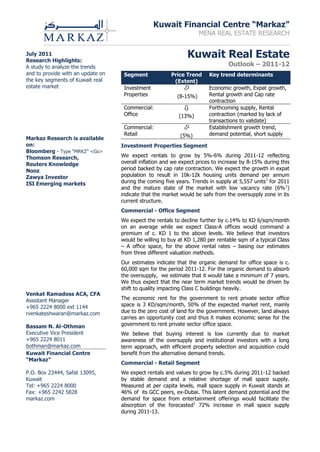
Kuwait Real Estate
Outlook – 2011-12
Segment Price Trend
(Extent)
Key trend determinants
Investment
Properties
(8-15%)
Economic growth, Expat growth,
Rental growth and Cap rate
contraction
Commercial:
Office
(13%)
Forthcoming supply, Rental
contraction (marked by lack of
transactions to validate)
Commercial:
Retail
(5%)
Establishment growth trend,
demand potential, short supply
Investment Properties Segment
We expect rentals to grow by 5%-6% during 2011-12 reflecting
overall inflation and we expect prices to increase by 8-15% during this
period backed by cap rate contraction. We expect the growth in expat
population to result in 10k-12k housing units demand per annum
during the coming five years. Trends in supply at 5,557 units1
for 2011
and the mature state of the market with low vacancy rate (6%1
)
indicate that the market would be safe from the oversupply zone in its
current structure.
Commercial - Office Segment
We expect the rentals to decline further by c.14% to KD 6/sqm/month
on an average while we expect Class-A offices would command a
premium of c. KD 1 to the above levels. We believe that investors
would be willing to buy at KD 1,280 per rentable sqm of a typical Class
– A office space, for the above rental rates – basing our estimates
from three different valuation methods.
Our estimates indicate that the organic demand for office space is c.
60,000 sqm for the period 2011-12. For the organic demand to absorb
the oversupply, we estimate that it would take a minimum of 7 years.
We thus expect that the near term market trends would be driven by
shift to quality impacting Class C buildings heavily.
The economic rent for the government to rent private sector office
space is 3 KD/sqm/month, 50% of the expected market rent, mainly
due to the zero cost of land for the government. However, land always
carries an opportunity cost and thus it makes economic sense for the
government to rent private sector office space.
We believe that buying interest is low currently due to market
awareness of the oversupply and institutional investors with a long
term approach, with efficient property selection and acquisition could
benefit from the alternative demand trends.
Commercial - Retail Segment
We expect rentals and values to grow by c.5% during 2011-12 backed
by stable demand and a relative shortage of mall space supply.
Measured at per capita levels, mall space supply in Kuwait stands at
46% of its GCC peers, ex-Dubai. This latent demand potential and the
demand for space from entertainment offerings would facilitate the
absorption of the forecasted1
72% increase in mall space supply
during 2011-13.
July 2011
Research Highlights:
A study to analyze the trends
and to provide with an update on
the key segments of Kuwait real
estate market
Markaz Research is available
on:
Bloomberg - Type “MRKZ” <Go>
Thomson Research,
Reuters Knowledge
Nooz
Zawya Investor
ISI Emerging markets
Venkat Ramadoss ACA, CFA
Assistant Manager
+965 2224 8000 ext 1144
rvenkateshwaran@markaz.com
Bassam N. Al-Othman
Executive Vice President
+965 2224 8011
bothman@markaz.com
Kuwait Financial Centre
“Markaz”
P.O. Box 23444, Safat 13095,
Kuwait
Tel: +965 2224 8000
Fax: +965 2242 5828
markaz.com
2. MENA REAL ESTATE RESEARCH
July 2011
Kuwait Financial Centre “Markaz” 2
Investment Properties Segment Outlook
Growth in expat population - key source of demand
Investment property segment (Apartments) is a mature market both
among other real estate segments in Kuwait and also within the
region, marked by market information sophistication. This segment is
primarily driven by growth in the expatriate population, in turn driven
by expatriate employment. Statistics provided by Public Authority of
Civil Information (PACI) indicate that expat population grew by c.2.9%
during the year 2010 as against the 2% growth we estimated in our
Dec-2009 report2
.
Exhibit-1 : Economic and expat population growth trends
Source: PACI, IMF, IIF, Markaz estimates
Exhibit-1 above depicts our expectation for the expat population
growth for the forthcoming five years based on the prevailing
expectations of the underlying drivers. Growth in expat population is a
function of total labor force demand (inclusive of domestic workers),
Kuwaiti population & labor force and the government’s targets for
demographic composition and total labor force demand in turn is a
function of economic growth in line with trends discussed earlier. Our
analysis of PACI statistics indicate that the Kuwaiti population grew by
3% during the past five years in line with its long term average.
However, the Kuwaiti labor force grew by 4.7% per annum during the
same period and is expected to maintain the growth rate during the
coming five years backed by the high composition of younger
population.
This growth in Kuwait labor force necessitate a lower growth in expat
labor force, depending on the extent of its skill set levels.
Government’s target for demographic composition aims to increase
the percentage of Kuwaiti nationals to the total population from 31%
in Dec-2008 to 34% by 2014, and the growth in Kuwaiti labor force
would have been one of the primary factors behind the target.
However, we estimate the level to be at 31-32% during the
forthcoming years depending on the extent of economic growth.
Considering these factors, we discounted the statistical estimate for
expat population growth by 30% and arrived at the average growth
rate of 3% per annum during the forthcoming five years.
Apartment segment
driven primarily by
expatriate population
growth
Expat population
expected to grow at
c.3% per annum on
average
Growth in expat
population a function
of labor force demand,
growth in Kuwaiti labor
force and government’s
demographic plans
3. MENA REAL ESTATE RESEARCH
July 2011
Kuwait Financial Centre “Markaz” 3
We believe that 50% of the incremental population constitute the
demand for apartments, discounting mainly for domestic workers, and
with an average household size of 3.5, this translates into a demand
of 10,000 units to 12,000 units per annum in the coming five years.
Exhibit-2 depicts the sensitivity analysis of our estimate for apartment
units demand depending on the extent of growth in expat population.
Exhibit-2 : Apartment units demand sensitivity
Source: PACI, Markaz estimates
Balanced supply scenario – a positive
Official statistics indicates a total supply of c.264,000 apartment units
as of Dec-2009 in c.11,000 buildings, majority of which is located in
Capital and Hawally governorate. Farwaniya and Ahmadi are the other
major governorates where apartment buildings are located.
Construction permit statistics are not easily available and hence the
forthcoming supply is hard to measure. Real Estate Union1
estimates
that 182 apartment buildings are currently under construction adding
5,557 units to the total supply during 2010-11 with current vacancy as
low as 6%.
Exhibit-3 : Investment properties supply scenario
Source: PACI, Real Estate Union, Markaz analysis; U/c – Under Construction
Demand of 10k-12k
units per annum in the
coming five years
Balanced supply with
low vacancies is a
positive
Under construction
units account for c.2%
of total stock and low
vacancies at 6%
4. MENA REAL ESTATE RESEARCH
July 2011
Kuwait Financial Centre “Markaz” 4
The industry is very much aware of the stable and predictable demand
and any excessive supply would immediately be reflected in the rental
trends and thereby on cap rates. Hence there is no incentive for
developers to construct in excess of demand and the mature and
informational efficient market ensures quick supply adjustments.
It is also worth mentioning that the construction standards of typical
apartment buildings are not of highest quality levels and cannot be
considered luxury segment. Significant change in tastes and
preferences could alter the supply scenario, but it is not reasonably
expected to occur to an extent to change the current market
landscape. Hence, we expect the market to be free from the risk of an
oversupply scenario in the medium term .
Rentals growth to reflect overall inflation
We expect the rentals to grow moderately by 4-5% during 2011-12.
This primarily reflects the overall inflation levels which stood at 4%
during 2010 and is expected to be around 5-6% during 2011-12 with
longer term levels projected at around 3%. While the rental growth
would be reflected in new rental contracts, there could be a lag
between inflation and growth in overall realized rental as contractual
rents can be increased only after a period of five years.
We expected the rentals to remain stable during the year 2010 with a
possibility of marginal contraction3
. As Exhibit-4 indicates below,
trends in rentals, depicted based on the analysis of available market
data, remained broadly stable throughout the year 2010. Rentals level
range increased by 7-8% during the latter part of the year and during
Q1-11, except for 1 BHK apartments. Rental trends in other
governorates is depicted in Appendix-1.
Exhibit-4 : Rental trends in Capital and Hawalli
Source: Kuwait Finance House; 2BBHKM – 2 Bed-Bath-Hall-Kitchen-Maid room
Low risk of oversupply
as information efficient
market ensures quick
supply adjustments
4-5% rental growth
during 2011-12
reflecting overall
inflation levels
Broadly stable trends in
rentals during 2010
with 7-8% increase
early 2011
Height of the bars indicates the range
of property rentals from min to max;
colors to differentiate the unit size.
5. MENA REAL ESTATE RESEARCH
July 2011
Kuwait Financial Centre “Markaz” 5
Price growth from cap rate contraction
We expect the cap rates to contract further to 7-8% during 2011-12
and this would lead to an 8-15% increase in price levels. The yield
from investment properties, at an attractive premium compared to
other investment alternatives with relatively lower risk, attracts
continued individual and institutional investment interest which would
lead to further improvement in the liquidity condition for investment
properties thereby having a positive impact on cap-rates and prices.
Exhibit-5 depicts the trends in cap rates which highlights the extent of
contraction materialized during 2010. An analysis of the cap rate data
we obtain from Markaz Real Estate Fund (MREF) along with the
market data on rental trends indicates that investment property prices
increased by c.11% on an average during 2010 for prime properties.
Properties that are attractively located with better placed building
requirements pertaining to convenience such as access, parking etc.
and also with few violations to the approved municipal plans and
requirements are categorized as prime properties. For non-prime
properties, the above analysis indicate that prices increased by c.5%
during the year. This is very much in line with our expectation of a 5-
15% rise in prices for the year2
.
Exhibit-5: Trends in cap rates
Source: MREF, Markaz analysis; * Levels before financial crisis
Cap rates to contract
further backed by
individual and
institutional investment
interest
11% average price
growth during 2010
was in line with our
earlier expectations
Difference in cap rates
for prime and non-
prime properties
6. MENA REAL ESTATE RESEARCH
July 2011
Kuwait Financial Centre “Markaz” 6
Office Segment Outlook
Market Landscape
Exhibit-6 below identifies the five major informal classification of the
CBD office market landscape along with a mention of a zone where
some of government owned and occupied areas are located in Kuwait
City. The accompanied table identifies commonalities between these
sub-markets and the rationale behind their classification apart from
the locational proximity, and also lists a prominent non-CBD zone. It
should be noted that the classification is not suggestive of the zoning
as per the municipal building regulations.
Exhibit-6 : CBD Office Market Landscape
Source : Kuwait Municipality (for the map), MREF, Markaz analysis
Facilitative classification
of CBD office market
landscape
Classification not
suggestive of municipal
zoning
Commonalities to note
apart from the
locational proximity
7. MENA REAL ESTATE RESEARCH
July 2011
Kuwait Financial Centre “Markaz” 7
Organic demand – min. 7 years to absorb the oversupply
Demand for office space is a function of office based employment
generation which again is based on overall economic growth. For the
forthcoming period, we estimate the annual demand for office would
be c.147,000 sqm during 2011-14, averaging c.37,000 sqm per
annum. Appendix-2 has the rationale that derived the above demand
estimate. DTZ estimates the historical office space take up to be c.
289,000 sqm during 2004-09, averaging c.48,000 sqm per annum. As
against this, the current estimate of vacancies and forthcoming supply
of prime office space as mentioned in a survey by Real Estate Union1
adds up to c.358,000 sqm. This clearly indicates that the market
remains highly oversupplied. Our estimates of forthcoming supply of
office space under construction for letting, as listed in Appendix-3
works out to 527,000 sqm in total and adding up office space under
construction for self-occupation increases this by c.20%, noting that
such buildings would increase spare capacity to the market in their
current locations, discounting for possible demolishing. Given the
above estimates, for the organic demand to absorb the forthcoming
supply, it would take a minimum of 7 years before the market needs
new office space development.
Exhibit-7 : Office space demand and supply
Source: DTZ (2004-2009 demand), Real Estate Union ( excess supply) , Markaz
Alternative Demand trend - Shift to quality
While it is clear from the above that organic demand could take a
minimum of 7 years to absorb the current oversupply and the
forthcoming supply, demand for office space would arise from “shift to
quality” from buildings that are relatively old and placed inferior in
terms of access, parking, finishing etc. to the new and relatively
superior buildings. We categorized the prominent existing buildings
and forthcoming developments in each of the zones identified in
Exhibit-7 above to Class-A, B and C based on a subjective analysis of
the buildings taking into consideration the building class definitions
and explanations provided by organizations such as Urban Land
Institute (ULI) and Building Owners and Managers Association
International (BOMA) given in Appendix-4. In general, tenants would
have a tendency to move from Classes (B to A or C to B) depending
on the changes in their financial/business conditions and in an
Organic demand
average c.37,000 sqm
per annum during
2011-14
c. 527,000 sqm of
office space supply
forthcoming
Shift to quality from
inferiorly placed
buildings to superior
ones imminent
8. MENA REAL ESTATE RESEARCH
July 2011
Kuwait Financial Centre “Markaz” 8
oversupplied market with depressed rentals such as Kuwait, the
incentive to move arise from the declining rentals and due to the new
supply being more modern than the existing.
As Exhibit-8 below illustrates, more Class A buildings came into the
market and more is expected in the short term and these buildings
would attract tenants from Class B and C buildings. The size of the
Class A buildings in Exhibit-8 would be different if measured by
rentable area (sqm) as a typical Class-A building would have a larger
floor plate and built up area than other classes. Difference in rental
levels and premium for Class-A office space would depend on the
critical factors such as access, services, building quality and parking.
We estimate that the premium for parking alone would cost 0.5 KD /
rentable sqm/ month and this indicates that the ability of Class-A to
attract would not lead to a complete shift from other classes, mainly
due to the associated rental premium.
However, Class-C buildings would be the most affected as increasingly
the rental premium would be negligible and would make better sense
to move to Class-B. Accordingly we expect the forthcoming supply to
influence and keep Class-B rentals under check, which in turn would
attract demand from Class-C buildings and we expect stiff competition
between peer Class-A buildings to attract tenants based on the quality
and cost parameters.
Exhibit-8 : Class distribution of CBD office space
Source: Markaz; FAS-Fahd Al Salem; FD-Financial District; KH-Khalijia Hamra
Alternative Demand trend – Government renting
Government organizations and departments in Kuwait function in
owner occupied buildings in general. Some of these buildings are aged
and can be comparable to Class C buildings in private owned office
space. In addition to the demand from the incremental net addition to
office based government employment, which we estimate to be c.
10,000 sqm per annum, the replacement need of such government
organizations and departments constitute the total demand. The cost
of land for government is “zero” and we estimate that the equilibrium
rent for government to rent private sector office space would be 3 KD/
sqm/month, c.50% of the current market rentals and hence not
economical to rent at the first glance. However, land always carries an
opportunity cost for the economy at large, and even for the
government and from that perspective, it makes economic sense for
More Class-A buildings
in the market to attract
tenants from other
classes
Class-C buildings would
be most affected
Demand from
government renting
another possible
alternative source of
demand
9. MENA REAL ESTATE RESEARCH
July 2011
Kuwait Financial Centre “Markaz” 9
the government to rent or acquire the private sector office space and
utilize the surplus land for other uses which are more productive.
Rentals to decline to KD 6 per sqm/month
Given the above supply tilted scale, it is natural for the rentals to
decline, as is captured in Exhibit-9. The magnitude of the decline is
more in Kuwait City owing to the concentration of the existing
oversupply and the forthcoming supply. We expect the rentals to
decline further to KD 6/sqm/month during 2011-12 for an average
office property before settling and could continue to remain depressed
during the forthcoming years. The magnitude and extent of decline
depends on the type of building, its Class due to factors discussed
earlier and location, access, parking and service quality between
buildings in the same class. We believe that Class-A offices would
command a minimum premium of c.KD 1/sqm/month compared to the
above levels.
Exhibit-9 : Trends in average office rentals
Source: KFH, Markaz analysis
Prices awaiting transactions
Given our expectations for rental declines and assuming unchanged
cap-rates, the prices are to decline by c.13%. However, there are not
many transactions being reported for the office space and hence
analysis of prices is essentially an exercise of valuation.
We believe that buyers would be willing to pay KD 1,280 per rentable
sqm of a typical Class-A office space based on three different
valuation methodologies. Based on the economic valuation and taking
into account the current market scenario, we believe that investors
would be willing to buy office space at KD 1,191 – KD 1,337 per
rentable square meter of office space, expecting an IRR of 8% at the
above expected rentals between 6 and 7 KD per sqm/month for
average and typical Class-A offices respectively. Exhibit-10 below
provides the window of value given the rentals and the required return
for an investor based on the assumptions laid out in Appendix-5.
Using yield capitalization method of valuation, the price stand at KD
900 and KD 1,050 per rentable sqm for average and Class A offices
with a cap rate of 8%.
Rentals for average
office building to reach
KD 6/sqm/month
Magnitude and extent
of the decline depends
on building specific
features
Lack of transaction
limits analysis of price
trends
We believe buyers
would be willing to pay
KD 1,280 per rentable
sqm for a typical Class-
A office space
10. MENA REAL ESTATE RESEARCH
July 2011
Kuwait Financial Centre “Markaz” 10
Replacement cost based valuation, taking current cost of land, yields a
price of KD 1,421 and KD 1,458 per rentable sqm for average and
Class A offices. These estimates are market level averages and values
for specific properties could vary depending on the location of
property, its zoning and the extent of permitted/acquired floor area
ratio.
Exhibit-10 : Economic price per rentable sqm of office space
Source: Markaz
Buying interest is low currently due to the market awareness of the
forthcoming supply amidst weak demand and the willingness and
ability of the buyer to adopt a patient and long term approach is
critical. Assessing the class of buyers and their current positioning,
corporate sector, which continue to remain weak financially, would not
be the likely potential buyers of office space. Individual investors
(HNIs) typically focus on investment properties and their interest could
be limited to small scale office space. However, the number of such
willing buyers with a long term approach would be few and they might
adopt a wait and watch approach till there is positive developments on
the demand side. Institutional investors, backed mainly by the
announcement of KD 1 Bn portfolio by KIA would likely be the main
buyers of office space. The ability and willingness to adopt a long term
approach is higher with institutional investors than other type of
buyers and they could even take advantage of the demand from
alternative trends discussed earlier if backed by an efficient property
selection and acquisition strategy and process.
We adopt three
different valuation
methodologies for price
estimation
Economic valuation
method indicates a
price range of KD
1,191 – KD 1,337 per
sqm
Oversupplied markets
wanes buying interest
Institutional investors
the likely buyers to
benefit from alternative
demand trends
11. MENA REAL ESTATE RESEARCH
July 2011
Kuwait Financial Centre “Markaz” 11
Retail Segment Outlook
Stable demand conditions
Retail segment is driven by growth in consumption activity and the
consequent demand for retail space from newly formed
establishments. We refer to the trends in trailing twelve month (TTM)
total of monthly number of new establishments that gets registered
with the Kuwait Chamber of Commerce, to infer consumption activity
and it indicates a stable growth trend following the recovery from the
crisis induced by the financial crisis (Exhibit-12).
Exhibit-12 : Trends in establishment formation
Source: Kuwait Chamber of Commerce, Markaz
We also refer to the commercial license statistics provided by the
Ministry of Commerce and Industry, which portrays a similar picture as
well with stable year on year growth albeit the likely seasonal declines
during July to October-2010. Market data reflects these trends with
property values and rentals remained predominantly unchanged
during the year 2010 and cap rates yielding 8-9% based on market
rental rates.
Exhibit-13 : Trends in new commercial licenses issued
Source: Ministry of Commerce and Industry, Markaz
Consumption activity
the main driver for
retail space demand
Demand for retail
space can be inferred
from formation of new
establishments
Trends in
establishment
formation indicative of
a stable demand trend
Trends in new
commercial licenses
issued indicate similar
stability in demand
Stable cap rate trends
reflects the trends in
underlying drivers
12. MENA REAL ESTATE RESEARCH
July 2011
Kuwait Financial Centre “Markaz” 12
Forthcoming mall space supply – a positive
Real Estate Union1
indicates a 72% increase in total supply of mall
space in the coming three years from 425, 371 sqm as of 2010 to
730,871 sqm during 2013. It might appear that unless the growth in
population and economy and therefore in consumption grows in
tandem with the supply, the extent of the forthcoming supply could
lead to an oversupply scenario with consequent impact on real rental
rate.
Exhibit-14 : Mall based retail space supply
Source: Real Estate Union, Markaz
However, retail mall space per capita would be at 0.18 sqm as of
2013, among the lowest in the region currently indicating potential for
further growth. Even after the above supply, retail mall space per
capita stands at 46% of its GCC peers (ex-Dubai) as of 2013 and thus
indicates that the sector is not facing an oversupply scenario.
Exhibit-15 : Shortage of supply compared to GCC peers
Source: JLL, Real Estate Union, Markaz Analysis
Organized retail market landscape is located across main population
centers of Kuwait and can be broadly categorized into major malls
(The Avenues, Marina Mall), Hypermarkets (City Centre, The Sultan
Centre, Lulu Hypermarket), Co-operative Stores, F&B outlets and other
specialty retail outlets. After completion of Avenues Phase IV during
2014 , the mall alone is expected to account for c.40% of the total
mall space supply in Kuwait.
72% increase in
forthcoming mall space
supply estimated
during 2011-12
Mall space per capita at
0.18 sqm as of 2013
the lowest in the region
Retail mall space per
capita stands at 46%
of the level of peer
GCC markets (ex-
Dubai)
The Avenues alone is
expected to account for
40% of the total mall
space supply in Kuwait
13. MENA REAL ESTATE RESEARCH
July 2011
Kuwait Financial Centre “Markaz” 13
Stable price and rental growth
Apart from the low per capita discussed above, malls in Kuwait fall
short in entertainment offerings relative to their peers in the region
and hence we expect the future supply to be absorbed by such
offerings as well. As Exhibit-16 indicates, mall space rentals in Kuwait
is comparable to the levels in GCC and we expect the rental rates to
sustain and grow by 5% during 2011-12 and in line with the growth in
population and the economy in the longer run.
However, in terms of liquidity, corporates are the major investors in
mall space and since the segment of investors are not completely out
of the impact of the slowdown and the financial crisis, we expect a
stable growth in values, at c.5% during 2011-12.
Exhibit-16 : MENA Retail space rental rates
Source: Colliers International, KFH, Markaz
Potential for demand
from mall space
entertainment offering
another source of
demand
Stable 5% growth in
prices and rentals
during 2011-12
Mall space rental levels
comparable to peer
GCC markets
14. MENA REAL ESTATE RESEARCH
July 2011
Kuwait Financial Centre “Markaz” 14
Real Estate Activity Outlook
We analyse the real estate transacation statistics provided by the
Ministry of Justice on a TTM summation basis in order to smooth the
seasonal fluctuations caused by summer and Ramadan slowdown and
the sudden growth in activity levels immediately after these periods.
Exhibit-17 captures the trend as we analyze it and as is clear from the
chart, activity levels sustained its uptrend both in terms of the number
and value of transactions during 2010-11. TTM value transacted grew
by 18% Y-o-Y during 2010 (-32 % during 2009) and 24% Y-o-Y as of
Q1-11 (-15% as of Q1-10) and TTM number of transactions grew by
41% Y-o-Y (-30% during 2009) and 30% Y-o-Y as of Q1-11 (4% as of
Q1-10).
Exhibit-17 : Sustained uptrend in transactions (TTM basis)
Source: MOJ-Kuwait, Markaz analysis
The causal factor behind the sustenance in activity levels is the
recovery in overall economic activity during 2010. IMF estimates that
the Real GDP grew by 3.3% during 2010 (-5.2% during 2009) and
Real Non-oil GDP grew by 3.4% during 2010 (0% during 2009). This
growth in economy positively impacted real estate demand, lowered
risk aversion and increased the price attractiveness thereby improving
transactions. IMF estimates the economic activity to grow at 5% on an
average for the coming 5 years citing growth in government spending
and an increase in private sector activity as part of the implementation
of the Development Plan. For 2011, IMF projects 5.2% growth in real
GDP (6.1% non-oil) and a 5.5% growth for 2012. This would
positively contribute to the sector if it materialized as expected and
lead to further improvement in transaction activity. Citing factors
posing downside risk to the forecasts, IMF identifies the political
gridlock, red tape and bureaucratic hurdles as the internal risk factors,
regional political environment and its financial implications as regional
risk factors and the possibility of oil price contraction in the absence of
sustenance in the current global economic recovery as the
international risk factors. As it stands now, these factors can be
ranked in the same order in terms of its criticality in affecting the
forecasted growth and it would be prudent to discount the growth rate
by 1-2 percentage points from the levels expected by IMF. To
compare, IIF forecasts 4.6% real GDP growth for 2011 (4.7% non-oil)
and 4.7% for 2012 (5.5% non-oil).
TTM summation
analysis to smooth
seasonal fluctuations
18% Y-o-Y growth in
value transacted during
2010
Recovery in overall
economic activity the
causal factor
5% average growth in
economy expected for
the coming 5 years to
improve activity levels
It would be prudent to
discount growth
estimates by 1-2
percentage points to
factor risks involved
15. MENA REAL ESTATE RESEARCH
July 2011
Kuwait Financial Centre “Markaz” 15
Another factor that drives transaction activity, by facilitating both the
demand and the supply side, is the liquidity which can be mainly
measured from bank lending to real estate sector. During the year
2010, we observed the breakdown of the close correlation between
the real estate value transacted and the growth in real estate lending.
This was mainly due to the dire scenario that banks in Kuwait were in
as a fall out of the financial crisis which curtailed the funding source
and eroded the value of the collaterals.
As a result of this, the M-o-M growth in total real estate credit
extended experienced a sustained decline from Feb-08 till Dec-10
(Exhibit-18) and the total real estate credit extended declined by 2%
Y-o-Y during 2010, down from an average growth of 34% during the
preceding 5 years. As of the end of Q1-11 and after continuous
decline for eight months, total extended real estate credit grew
marginally (1% Y-o-Y). Nevertheless, we do not expect credit
extended to the real estate sector to grow significantly due to bank’s
reluctance in general. However, a moderate growth in credit would
positively impact the transaction activity if economic growth
materializes as forecasted.
Exhibit-18 : Trends in real estate financing vis-à-vis activity
Source: MOJ-Kuwait, CBK, Markaz analysis
Another source of liquidity, apart from bank credit is the capital
markets and the renowned announcement by KIA of its plans to invest
KD 1Bn in the real estate market would provide necessary liquidity for
the market. Exhibit-19 charts the trends in the equity market activity
in the real estate sector as per the data provided by the Kuwait Stock
Exchange, which clearly indicates the lack of liquidity and transaction
in the equities of real estate companies in Kuwait despite relative price
stability. It should also be noted that the project/investment portfolios
of real estate companies in Kuwait are regional and hence this trend is
not directly representative of the market’s assessment of the local real
estate market alone.
In summary, we expect the transaction levels to sustain its growth
during 2011-12, backed by economic growth with the possibility of
further growth from the improvement in the liquidity condition from
improved lending by banks and liquidity from other capital providers in
the medium term (2012-14).
Another factor driving
transactions is the
liquidity
Net real estate credit
extended by banks
declined during 2010
Bank credit to real
estate not expected to
growth significantly
Moderate growth in
credit would positively
impact transaction
activity
Liquidity from capital
markets – like KIA’s
announce plans to
invest KD 1 Bn would
boost liquidity
16. MENA REAL ESTATE RESEARCH
July 2011
Kuwait Financial Centre “Markaz” 16
Exhibit-19 : Real Estate equities market liquidity trends
Source: Kuwait Stock Exchange, Markaz analysis
Limited liquidity from
equities market
We expect transactions
to sustain its growth
17. MENA REAL ESTATE RESEARCH
July 2011
Kuwait Financial Centre “Markaz” 17
Appendix-1: Rental trends- Farwaniya, Ahmadi, Mubarak Al Kabeer & Jahra
Source: Kuwait Finance House; 2BBHKM – 2 Bed-Bath-Hall-Kitchen-Maid room
Appendix-2: Office space demand estimation rationale
Demand for office space is a function of office based employment generation which again is primarily
based on overall non-oil economic growth. The average real non-oil GDP growth rate before the crisis
during the period 2004-2008 was 9.7% and the successful execution of the development plan is
expected to result in a 7.5% annual growth rate in the non-oil economic activity. Hence, we assume
that there would not be huge change on the upside in the trends in office based employment
compared to the past cycle.
The age distribution of Kuwaiti population indicates the average number of young people reaching
their graduation years stood at c. 25,000 during the period between 2003-2010 and we expect this
average to remain at the same level during the coming five years as well. Assuming that 60% of such
people seek graduation and 75% of those as graduating , we reach an average of c.13,000 Kuwaiti
graduates per year. Government sector employment statistics indicate an average net addition of
c.9,200 employees per year in the government sector. This indicates that the private sector has to
absorb the c.8,300 graduates every year and net of unemployment, we assume that c.2,000
employees are absorbed by the private sector, of which we assume 30% to be office based
employment, equivalent of c.10,000 sqm of office space demand.
The growth in private sector employment is a function of economic growth and Exhibit-A below maps
the trend for the past 12 years for the total labor force and expatriate labor force in private sector. The
trough to trough average yearly growth rate for the period between 2002-2008, i.e., before the crisis,
stood at 7.5%. We assume a lower growth rate for the forthcoming five year period and expect an
average yearly growth rate of 5%. This is to account for the possibility of lower pace in economic
growth during the forecast period compared to the previous cycle. The lower proportion of expatriate
supervisory employees to workers and the Kuwaitization initiative would lead to a lower growth rate of
office based expatriate employees and hence we assume an average annual growth rate of 2.5% -
3.0% during the forecast period. This results in an average office space demand of c.25,000 to 50,000
sqm per annum, taking the total office space demand to c.35,000 to c.60,000 sqm per annum.
Although, this estimate is based on many assumptions that are considered reasonable, it still need not
be precisely accurate.
Height of the bars indicates the range
of property rentals from min to max;
colors to differentiate the unit size.
18. MENA REAL ESTATE RESEARCH
July 2011
Kuwait Financial Centre “Markaz” 18
Exhibit-A : Trends in labor force
Source: PACI, MOP, Markaz analysis
Appendix-3: Office space supply estimate
Source: Multiple Sources, Markaz Analysis
19. MENA REAL ESTATE RESEARCH
July 2011
Kuwait Financial Centre “Markaz” 19
Appendix-4: Building Class Definitions
Appendix-5: Assumptions for economic value model
Method – I: Economic Valuation
Starting rent (KD/sqm/month) 7
Maintenance Cost (% of rental income) 10%
Occupancy trends
Year – 1 50%
Year – 2 60%
Year – 3 80%
Year – 4 to 10 100%
Cost of Capital/ Required return 8.0%
Rental inflation 2.5%
Investment period 10 Years
Method – II: Economic Valuation
Starting rent (KD/sqm/month) 7
Cap rate 8%
Method – III: Replacement Cost Method
Land Area (sqm) 1,000
Land Cost *(KD/sqm) 6,000
Permitted FAR 520%
Construction cost (KD/sqm) 350.00
Basement Cost (KD/sqm) 120.00
Building Class Definition - BOMA
Class A - Most prestigious buildings competing for premier office users with rents
above average for the area. Buildings have high quality standard finishes, state of the
art systems, exceptional accessibility and a definite market presence.
Class B - Buildings competing for a wide range of users with rents in the average
range for the area. Building finishes are fair to good for the area. Building finishes are
fair to good for the area and systems are adequate, but the building does not compete
with Class A at the same price.
Class C - Buildings competing for tenants requiring functional space at rents below the
average for the area.
Building Class Definition - ULI
Class A space can be characterized as buildings that have excellent location and
access, attract high quality tenants, and are managed professionally. Building materials
are high quality and rents are competitive with other new buildings.
Class B buildings have good locations, management, and construction, and tenant
standards are high. Buildings should have very little functional obsolescence and
deterioration.
Class C buildings are typically 15 to 25 years old but are maintaining steady
occupancy.
20. MENA REAL ESTATE RESEARCH
July 2011
Kuwait Financial Centre “Markaz” 20
Notes
1. Sourced from Real Estate Union’s Al Murshid Al Aqari - Issue Dec 2010 issue by Al Murshid Al Aqari by Liases Foras Middle
East WLL- www.lfmeglobal.com
2. Kuwait Real Estate Outlook (Dec-09)
21. MENA REAL ESTATE RESEARCH
July 2011
Kuwait Financial Centre “Markaz” 21
Disclaimer
This report has been prepared and issued by Kuwait Financial Centre S.A.K (Markaz), which is
regulated by the Central Bank of Kuwait. The report is owned by Markaz and is privileged and
proprietary and is subject to copyrights. Sale of any copies of this report is strictly prohibited. This
report cannot be quoted without the prior written consent of Markaz. Any user after obtaining Markaz
permission to use this report must clearly mention the source as “Markaz”. The report is intended to be
circulated for general information only and should not to be construed as an offer to buy or sell or a
solicitation of an offer to buy or sell any financial instruments or to participate in any particular trading
strategy in any jurisdiction.
The information and statistical data herein have been obtained from sources we believe to be reliable
but no representation or warranty, expressed or implied, is made that such information and data is
accurate or complete, and therefore should not be relied upon as such. Opinions, estimates and
projections in this report constitute the current judgment of the author as of the date of this report.
They do not necessarily reflect the opinion of Markaz and are subject to change without notice. Markaz
has no obligation to update, modify or amend this report or to otherwise notify a reader thereof in the
event that any matter stated herein, or any opinion, projection, forecast or estimate set forth herein,
changes or subsequently becomes inaccurate, or if research on the subject company is withdrawn.
This report may not consider the specific investment objectives, financial situation and the particular
needs of any specific person who may receive this report. Investors are urged to seek financial advice
regarding the appropriateness of investing in any securities or investment strategies discussed or
recommended in this report and to understand that statements regarding future prospects may not be
realized. Investors should note that income from such securities, if any, may fluctuate and that each
security’s price or value may rise or fall. Investors should be able and willing to accept a total or partial
loss of their investment. Accordingly, investors may receive back less than originally invested. Past
performance is not necessarily indicative of future performance.
Kuwait Financial Centre S.A.K (Markaz) does and seeks to do business, including investment banking
deals, with companies covered in its research reports. As a result, investors should be aware that the
firm may have a conflict of interest that could affect the objectivity of this report. This report may
provide the addresses of, or contain hyperlinks to, websites. Except to the extent to which the report
refers to website material of Markaz, Markaz has not reviewed the linked site and takes no
responsibility for the content contained therein. Such address or hyperlink (including addresses or
hyperlinks to Markaz’s own website material) is provided solely for your convenience and information
and the content of the linked site does not in any way form part of this document. Accessing such
website or following such link through this report or Markaz’s website shall be at your own risk.
For further information, please contact Markaz at P.O. Box 23444, Safat 13095, Kuwait; Email:
research@markaz.com; Tel: 00965 1804800; Fax: 00965 22450647.
22. Kuwait Financial Centre “Markaz”
MENA REAL ESTATE RESEARCH
Strategic Research
The New Regulations on Kuwait Investment Sector (Jun-10)
The New Regulations on Kuwait Investment Sector (Jun-10)
Persistence in Performance (Jun-10)
Kuwait Capital Market Law (Mar-10)
What to expect in 2010 (Jan-10)
GCC Banks - Done with Provisions? (Jan-10)
What is left for 2009? (Sept-09)
Kuwait Investment Sector (Jun-09)
Missing The Rally (Jun-09)
Shelter in a Storm (Mar-09)
Diworsification: The GCC Oil Stranglehold (Jan-09)
This Too Shall Pass (Jan-09)
Fishing in Troubled Waters (Dec-08)
Down and Out: Saudi Stock Outlook (Oct-08)
Mr. GCC Market-Manic Depressive (Sept-08)
Global Investment Themes (June-08)
To Yield or Not To Yield (May-08)
The Golden Portfolio (Apr-08)
Banking Sweet spots (Apr-08)
The “Vicious Square” Monetary Policy options for Kuwait (Feb-08)
China and India: Too Much Too Fast (Oct-07)
A Potential USD 140b Industry: Review of Asset Management
Industry in Kuwait (Sep-07)
A Gulf Emerging Portfolio: And Why Not? (Jun-07)
To Leap or To Lag: Choices before GCC Regulators (Apr-07)
Derivatives Market in GCC (Mar-07)
Managing GCC Volatility (Feb-07)
GCC for Fundamentalists (Dec-06)
GCC Leverage Risk (Nov-06)
Periodic Research
Daily
Markaz Daily Morning Brief
Markaz Kuwait Watch
Daily Fixed Income Update
Weekly
KSE Market Weekly Review
International Market Update
Real Estate Market Commentary
Monthly
Mena Mergers & Acquisitions
Option Market Activity
GCC Quants
Market Review
GCC Corporate Earnings
Quarterly
GCC Equity Funds
Thought Speaks
Equity Research Statistics
Infrastructure
GCC Power
GCC Ports
GCC Water
GCC Airports
GCC Roads & Railways
GCC ICT
Real Estate – Market Outlook
Qatar Residential - An Update (Aug-10)
Dubai Real Estate - Trends and Outlook(Apr-10)
Egypt Real Estate - Trends and Outlook(Feb-10)
Kuwait Real Estate Outlook(Dec-09)
Abu Dhabi Residential (Nov-09)
Office Investment in KSA (Jul-09)
Saudi Arabia – Residential Real Estate Outlook (Jun-09)
Saudi Arabia (Sep-08)
Abu Dhabi (July-08)
Algeria (Mar-08)
Jordan (Mar-08)
Kuwait (Feb-08)
Lebanon (Dec-07)
Qatar (Sep-07)
Saudi Arabia (Jul-07)
U.S.A. (May-07)
Syria (Apr-07)
Sector Research
Real Estate Strategic Research
GCC Distressed Real Estate Opportunities (Sep-09)
GCC Real Estate Financing (Sept-09)
Real Estate Earnings -2009 (May-09)
Supply Adjustments Are we done? (Apr-09)
Dubai Real Estate Meltdown (Feb-09)
Markaz Research Offerings
23. MENA REAL ESTATE RESEARCH
July 2011
Bahrain
Gulf Finance House (Oct-08)
Esterad Inv. Company (Aug-08)
Bahrain Islamic Bank (Aug-08)
Ithmaar Bank (July-08)
Tameer (July-08)
Batelco (July-08)
Qatar
Masraf Al-Rayan (Jun-10)
Commercial Bank of Qatar (Mar-10)
Qatar Telecom (Jun-09)
Industries Qatar (Apr-09)
Qatar National Bank (Feb-09)
United Development Co. (Feb-09)
Qatar Fuel Co. (Dec-08)
Qatar Shipping Co (Dec-08)
Barwa Real Estate Co. (Nov-08)
Qatar Int’l Islamic bank (Nov-08)
Qatar Insurance Co. (Nov-08)
Qatar Gas Transport Co. (Oct-08)
Doha Bank (Aug-08)
QEWC (July-08)
QISB (July-08)
UAE
Dubai Financial Market (Sept-09)
ADCB (Jun-09)
DP World (Jun-09)
NBAD (Feb-09)
Sorouh Real Estate (Feb-09)
Aldar Properties (Feb-09)
Gulf Cement Company (Jan-09)
Abu Dhabi National Hotels (Dec-08)
Dubai Investments (Dec-08)
Arabtec Holding (Dec-08)
Air Arabia ( Nov-08)
Union Properties (Nov-08)
Dubai Islamic bank (Oct-08)
Union National Bank (Aug-08)
Emaar Properties (July-08)
Dana Gas (July-08)
FGB (July-08)
Etisalat (Jun-08)
Oman
Shell Oman Marketing (Apr-10)
Galfar Engineering & Cont. (Nov-08)
Oman Telecommunications (Sept-08)
Bank Muscat(Sept-08)
Oman cement (Sept-08)
Raysut Cement Company (Aug-08)
National Bank of Oman (Aug-08)
OIB (July-08)
Egypt
Sidi Kerir Petrochemicals (Jul-10)
Egypt Kuwait Holding (Mar-10)
Commercial Int’l Bank (Oct-08)
Orascom Telecom (Sep-08)
Mobinil (Sep-08)
Telecom Egypt (Aug-08)
EFG-Hermes (Jun-08)
Jordan
Arab Bank (Sept-08)
Cairo Amman Bank (Oct-08)
Morocco
Maroc Telecom (Mar-10)
Saudi Arabia
Jabal Omar Development (Jul-10)
Arabian Cement Co. (Jul-10)
Yanbu Cement Co. (Jun-10)
Saudi Telecom Co. (Jun-10)
Emaar the Economic City (Jun-10)
Qassim Cement Company (Jun-10)
Savola Group (May-10)
Alinma Bank (May-10)
Jarir Marketing (May-10)
Bank Al Bilad (May-10)
Bank Al Jazira (Apr-10)
Makkah Construction (Apr-10)
Saudi Cement Company(Apr-10)
Southern Province Cement Co(Mar-10)
Saudi Electricity Company(Feb-10)
Saudi Arabian Mining Co(Feb-10)
Yamama Saudi Cement (Feb-10)
Etihad Etisalat (Feb-10)
Al Marai Company (Dec-09)
Arab National Bank (Oct-09)
SAFCO (Oct-09)
Al Rajhi Bank (Aug-09)
Riyad Bank (Jul-09)
Saudi Telecom Co. (May-09)
Sabic (Mar-09)
Samba Financial Group (Feb-09)
Saudi Investment Bank (Jan-09)
Kingdom Holding Co. (Dec-08)
Company Research
Markaz Research is available on: Bloomberg Type “MRKZ” <GO>,
Thomson Financial, Reuters Knowledge, Zawya Investor & Noozz.
To obtain a print copy, kindly contact:
Kuwait Financial Centre “Markaz”
Media and Communications Department
Tel: +965 2224 8000 Ext. 1814
Fax: +965 2249 8740
Postal Address: P.O. Box 23444, Safat, 13095, State of Kuwait
Email: info@markaz.com
markaz.com/research
Kuwait
(For Internal Use Only)
Qurain Petrochem. Ind. (Aug-10)
Wataniya (Jul-10)
Boubyan Bank (June-10)
Agility (June-10)
Gulf Bank of Kuwait (May -10)
National Bank of Kuwait (Mar-10)
Al Deera Holding (Aug-09)
Kuwait Finance House (Apr-09)
Kuwait Financial Centre (Dec-08)
Commercial Bank of Kuwait (Oct-08)
National Industries Group (Sept-08)
Zain (Sept-08)
Global Investment House (Sept-08)
Kipco (Sept-08)
The Investment Dar (Sept-08)
Burgan Bank (Sept-08)
Automated Systems Co (Aug-08)
Al Safat Investment Co (July-08)
Markaz Company Research Coverage
MSCI Arabian Markets
Conventional
MSCI Arabian Markets
Islamic Local Index
Saudi Arabia 60% 64% 78%
Kuwait 83% 92% 56%
Qatar 92% 90% 95%
UAE 79% 25% 58%
Bahrain 58% 74% 23%
Oman 63% 100% 50%
Egypt 62% 100% 45%
Jordan 39% 0% 32%
Morocco 50% 70% 24%
MENA 79% 93% 63%
Markaz Research Offerings