The Codex of Business Writing Software for Real-World Solutions 2.pptx
Analysis on a small firm
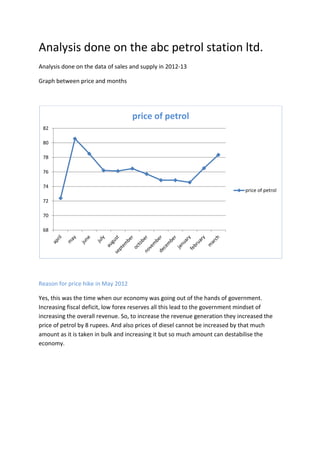
1. Analysis done on the abc petrol station ltd.
Analysis done on the data of sales and supply in 2012-13
Graph between price and months
Reason for price hike in May 2012
Yes, this was the time when our economy was going out of the hands of government.
Increasing fiscal deficit, low forex reserves all this lead to the government mindset of
increasing the overall revenue. So, to increase the revenue generation they increased the
price of petrol by 8 rupees. And also prices of diesel cannot be increased by that much
amount as it is taken in bulk and increasing it but so much amount can destabilise the
economy.
68
70
72
74
76
78
80
82
price of petrol
price of petrol
2. The demand curve
Month Price of petrol Quantity of petrol sold
April 72.39 56426
May 80.57 52816
June 78.5 67834
July 76.21 76953
August 76.13 77131
September 76.46 72773
October 75.72 72593
November 74.87 76357
December 74.87 72493
January 74.56 74715
February 76.52 70045
March 78.35 78990
Reason for rise in demand in June, July????
June, July is a season of holidays. Now at this point of time people travel from one place to
another. This leads to increase in sales of petrol especially and also some of the festival like
raksha-bandhan where brothers go to their sister’s home also leads to increase the sales of
petrol and also diesel but comparatively to a lesser extent.
Reason for decline in demand in winters and in February 2013????
There is no such exact reason for this, but yes one of the competitors just entered the
market at this point of time on a link road that could have decreased the sales of petrol.
3.
4. Demand function
Qx =f (Px,Py, M, H)
Where Px denotes the price of petrol, Py denotes the price of diesel, M denotes the monthly
income as well as H denotes other factors such as marriages.
Reasons for inclusion of these factors???
Basic three factors that we have taken into account are price, monthly income and other
factors like marriages. As petrol is a consumable good and it is necessary for consumer to
take it after a certain period of time. We have plotted a graph between price and demand
but we cannot find any correlation between these two items because the nature of goods
are consumable.
How demand of petrol and diesel are interrelated??
In today’s scenario, with the availability of both petrol and diesel cars and diesel prices
being less( Rs. 34 approx. less per litre),consumer is switching to diesel cars. This leads to
decrease in the overall sales volume of petrol. More is the price gap between petrol and
diesel more will be the demand of diesel and lesser will be the demand of petrol. This also
goes by the rule that we have studied in managerial economics that “lesser the price of the
substitute goods, more will be its demand.”
71
72
73
74
75
76
77
78
79
80
81
0 10000 20000 30000 40000 50000 60000 70000 80000 90000
demand curve
price
5. Graph between supply and sales
How abc petrol pump handles the difference between demand and supply????
The surplus that lefts at the end of a month in oil tankers serves the demand for the next
month and also new inventory receipts are there. This is an ongoing process as opening
stock is taken into account at the start of financial year, so this question cannot be entered
fully from this data.
0
10000
20000
30000
40000
50000
60000
70000
80000
90000
100000
0 20000 40000 60000 80000 100000
supply
supply
Linear (supply)
6. Graph between diesel price and months
Reason for price hike in November 2012????
The reason for price hike of any petroleum product is always because of decrease of value
of rupee as compared to dollar. Now as the rupee decreases, we have to pay extra amount
of money to buy the same quantity of crude oil from other countries and also our
consumption, being a growing economy is also increasing day by day and leads to increase
in prices because the government has to born the cost from the consumer itself.
The demand curve
Month Price of diesel Quantity of diesel sold
April 40.07 538869
May 40.07 562749
June 40.07 548982
July 40.05 526962
August 40.19 471371
September 40.29 480000
October 40.29 533000
November 46.06 518794
December
January
February
march
46.07
46.57
47.06
47.56
524736
553729
499258
569161
36
38
40
42
44
46
48
50
price of diesel
price of diesel
7. Graph between demand and price
Demand function
Qx =f (Px, Py, M, H)
Where Px denotes the price of diesel, Py denotes the price of petrol, M denotes the monthly
income as well as H denotes other factors such as sowing of paddy. here we can also see
there is no correlation between price and demand because the nature of goods are
consumable.
How demand of diesel gets affected in agricultural season????
In agricultural season, farmer does various activities like initially sowing of crops and
afterwards cutting of crops. Now in these operations they use modern equipments like
tractors, harrow, seed drill, cultivator etc. Now most of them require diesel to run and also
when the crops are ready they have to take them to markets, that also increases the
consumption of diesel for that particular time period.
Reason for low demands in august???
Yes, if we see august, September is also considered to be a normal selling period and sales
of diesel should be normally high in these months also but at that time one external factor
came that led to the decrease of sales .Punjab government abolished the octroi on
petroleum products. Now the rates of diesel and petrol became same between the petrol
39
40
41
42
43
44
45
46
47
48
0 100000 200000 300000 400000 500000 600000
Demand
price
8. pumps that were located inside the city to those located on highways. Now those
consumers who take diesel in bulk started preferring the petrol pumps nearby as compared
earlier when they could travel 2 k.m.s extra as there was price difference of about 1.5
rupees per litre.
Supply v/s price
39
40
41
42
43
44
45
46
47
48
0 100000 200000 300000 400000 500000 600000 700000
price
price
9. Market equilibrium
How purchase < sale????
Surplus from previous month and opening stock from previous years.
Xtrapremium
0
100000
200000
300000
400000
500000
600000
700000
38 40 42 44 46 48
sales
purchase
70
72
74
76
78
80
82
84
86
april may june
price
price
10. why it’s costlier???
It is costlier because some extra chemicals are added in this product that enhance the
average as well as decrease the maintenance demand of the vehicle.
Sale vs price
Reason for declining demand of xtrapremium????
Price of xtrapremium was 2.5 rupees higher than the normal petrol. Initially the product
was well received but eventually with the course of time people realized that it is not
providing value according to its price.
Made by-:
Vasu singla-: 401007029
Nikhil taheem-: 401007016
Anmol chawla-: 401057001
0
5000
10000
15000
20000
25000
30000
april may june
sale
sale