Oil Price Drastic Fall Is Not Felt as Drastically at Pump-MAC Energy Advisors
1. 1
Oil Price Drastic Fall Is Not Felt as Drastically at Pump
While consumers are currently enjoying paying less at the pump, many wonder why
there has not been a further drop. The retail gasoline (petrol) price remains relatively
high, given the magnitude of the declining value of oil, its main component. Since
June 2014, the cost of crude oil has fallen by 70 percent.1
Across this same timeframe
in the U.S., the retail price of regular gasoline has fallen by only 47 percent.2
The
evidence suggests gasoline pump prices react more slowly to declining, rather than
rising oil prices: consumers pay the price in either scenario.3
Additionally, energy
bills may not reflect market natural gas pricing because of long-term contracts that fix
long-term prices.
Sticky Pump Prices
Retail gasoline requires oil to be extracted, transported, refined, distributed, marketed
and taxed. The costs incurred and profit margins imposed at each stage in the process
are passed onto the consumer at the pump, where retail margins are included in the
distribution and marketing (D&M) stage. 4
Since crude oil only contributes a
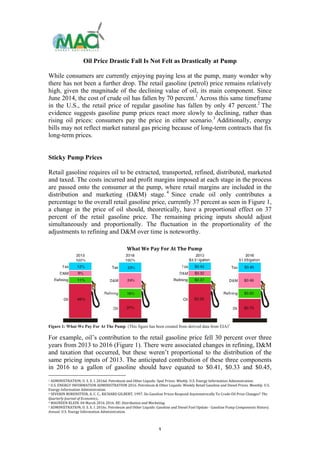
percentage to the overall retail gasoline price, currently 37 percent as seen in Figure 1,
a change in the price of oil should, theoretically, have a proportional effect on 37
percent of the retail gasoline price. The remaining pricing inputs should adjust
simultaneously and proportionally. The fluctuation in the proportionality of the
adjustments to refining and D&M over time is noteworthy.
Figure 1: What We Pay For At The Pump (This figure has been created from derived data from EIA)5
For example, oil’s contribution to the retail gasoline price fell 30 percent over three
years from 2013 to 2016 (Figure 1). There were associated changes in refining, D&M
and taxation that occurred, but these weren’t proportional to the distribution of the
same pricing inputs of 2013. The anticipated contribution of these three components
in 2016 to a gallon of gasoline should have equated to $0.41, $0.33 and $0.45,
1 ADMINISTRATION, U. S. E. I. 2016d. Petroleum and Other Liquids: Spot Prices. Weekly. U.S. Energy Information Administration.
2 U.S. ENERGY INFORMATION ADMINISTRATION 2016. Petroleum & Other Liquids: Weekly Retail Gasoline and Diesel Prices. Monthly. U.S.
Energy Information Administration.
3 SEVERIN BORENSTEIN, A. C. C., RICHARD GILBERT, 1997. Do Gasoline Prices Respond Asymmetrically To Crude Oil Price Changes? The
Quarterly Journal of Economics,.
4 MAUREEN KLEIN. 04 March 2016 2016. RE: Distribution and Marketing.
5 ADMINISTRATION, U. S. E. I. 2016c. Petroleum and Other Liquids: Gasoline and Diesel Fuel Update - Gasoline Pump Components History.
Annual. U.S. Energy Information Administration.
What We Pay For At The Pump
2. 2
respectively. Instead, as shown in Figure 1, this theory only holds true for taxation,
which has consistently contributed approximately $0.43/gallon since the year 2000.6
The contributions to the gasoline price of the less predictable pricing inputs were
more variable in their fluctuations.7
Indeed in 2016, removing oil and tax from the
gasoline price equation, resulted in competition between refining and D&M for their
share of $0.75/gallon. D&M boosted its share by $0.14/gallon, while refining reduced
its share by $0.07/gallon.
Some argue that the struggle between refiners and D&Ms depends upon the price of
the gasoline leaving the refinery.8
Severe weather conditions in the past have severely
impacted refinery operations, often resulting in shutdowns spanning several weeks or
more.9
While demand remains high throughout these times, gasoline supply is limited
and thus, refiners can charge a higher price for their product, and distributers must
compete for greater margins. Conversely, when the gasoline inventories of refiners
are high and demand remains high, distributers hold the bargaining power.
Monthly data reveals that since January 2000, an inverse correlation of 30 percent has
existed between the refiners and the D&M percentage contributions to retail gasoline
prices.10
Importantly, during the global financial crisis (Figure 2) and since the oil
crash of June 2014 (Figure 3), this inverse correlation between the two pricing
contributors has increased to 67 percent and 48 percent respectively.11
$0.00
$0.50
$1.00
$1.50
$2.00
$2.50
$3.00
$3.50
$4.00
$4.50
-10%
-5%
0%
5%
10%
15%
20%
25%
30%
Nov-07 Feb-08 Jun-08 Sep-08 Dec-08 Mar-09 Jul-09 Oct-09
Retail Gasoline
Price&Per&Gallon&
Percentage Contribution
to Gasoline's Price
Retail&Gasoline&Pricing&Components'&
Varia5ons&Throughout&GFC&
Refining D&M Retail Gasoline
Figure 2: Retail Gasoline Pricing Components’ Variation Throughout the Global Financial Crisis (This figure has been
created from derived data from EIA)12
6 Ibid.
7 Ibid.
8 MARK FAHEY. 2016. Refiners are finally sharing more of those oil savings. Available: http://www.cnbc.com/2016/01/22/refiners-are-
finally-sharing-more-of-those-oil-savings.html [Accessed 03/03/2016].
9 LAWRENCE KUMINS & ROBERT BAMBERGER 2005. Oil and Gas Disruption From Hurricanes Katrina and Rita. Congressional Research
Service.
10 ADMINISTRATION, U. S. E. I. 2016c. Petroleum and Other Liquids: Gasoline and Diesel Fuel Update - Gasoline Pump Components History.
Annual. U.S. Energy Information Administration.
11 Ibid.
12 Ibid.
3. 3
$0.00
$0.50
$1.00
$1.50
$2.00
$2.50
$3.00
$3.50
$4.00
0%
5%
10%
15%
20%
25%
30%
Mar-14 Jun-14 Sep-14 Dec-14 Apr-15 Jul-15 Oct-15 Jan-16
Retail Gasoline
Price Per Gallon
Percentage Contribution
to Gasoline's Price
Retail Gasoline Pricing Components'
Variations Since June 2014
Refining D&M Retail Gasoline
Figure 3: Retail Gasoline Pricing Components’ Variations since June 2014 (This figure has been created from derived data
from EIA)13
Other than during the financial crisis, the only times since January 2000 that WTI
(West Texas Intermediate crude oil, U.S. price benchmark) refining contributed less
than zero percent to the U.S. retail gasoline price was in November and December of
2011. Transportation bottlenecks in the U.S. Midwest in September 2011 affected
WTI distribution to the extent that Brent, the international benchmark, gained a record
premium of $30 per barrel over WTI.14
Once transportation issues were resolved,
WTI’s price steadily increased, closing the margin on Brent. Further, WTI’s
inventories were at capacity, leading to market oversupply and this, coupled with high
demand, removed refiners’ bargaining power, such that they contributed less than
zero percent to gasoline prices.
The oil crash in June 2014 resulted in six of the nine S&P 1500 oil refining and
marketing sub index companies bringing in $14.3 billion in earnings before tax and
interest in 2015, up 37 percent from the previous year.15
Clearly the sudden fall in oil
prices in 2014 did not positively impact gasoline prices as much as consumers would
have liked.
The evidence suggests that gasoline pump prices react more slowly to declining,
rather than rising oil prices.16
At the pump, consumers will absorb 75 percent of the
negative costs associated with any rise in the oil price within four weeks of a price
change, but it can be eight weeks or more before the consumer feels an equivalent 75
percent positive effect when the price of oil falls.17
More than twenty months have passed since the commodity crash in June 2014, and
customers are experiencing gasoline prices on which oil is having an all-time limited
flow-on effect. Ironically, data reveals WTI has the largest relative impact on retail
gasoline prices when barrel value is relatively high.18,19
Unfortunately for consumers,
it’s a vicious cycle: an expectation that the declining oil price will relieve the dollars
13 Ibid.
14 ADMINISTRATION, U. S. E. I. Today In Energy: 2011 Brief - Brent crude oil averages over $100 per barrel in 2011 - Transportation
Bottlenecks. Annual. U.S. Energy Information Administration.
15 FAHEY, M. 2015. When crude is far cheaper than gasoline, middlemen win. Available: http://www.cnbc.com/2015/09/03/when-crude-
is-far-cheaper-than-gasoline-middlemen-win.html [Accessed 07 March 2016].
16 SEVERIN BORENSTEIN, A. C. C., RICHARD GILBERT, 1997. Do Gasoline Prices Respond Asymmetrically To Crude Oil Price Changes? The
Quarterly Journal of Economics,.
17 MICHAEL OWYANG & E. KATARINA VERMANN 2014. Rockets and Feathers. Why Don't Gasoline Prices Always Move in Sync with Oil
Prices? The Regional Economist.
18 ADMINISTRATION, U. S. E. I. 2016d. Petroleum and Other Liquids: Spot Prices. Weekly. U.S. Energy Information Administration.
19 ADMINISTRATION, U. S. E. I. 2016c. Petroleum and Other Liquids: Gasoline and Diesel Fuel Update - Gasoline Pump Components History.
Annual. U.S. Energy Information Administration.
4. 4
expended at the pump, offset by the stark reality that when prices crash, the impact on
the household budget is minimal.
Winter, Spring, Summer or Fall; Retail Electricity Continues to Rise
Irrespective of Natural Gas
In the four decades from 1973 to 2013, global electricity sourced from natural gas
increased from 12.1 percent to 21.7 percent.20
In the U.S. in 2014, amid the boom in
shale and coal seam gas extraction, as well as climate change action, 33 percent of
electricity was produced from natural gas, up from 17 percent in 2001 (Figure 4).21
Presently, almost half of all U.S. households use natural gas for heating, while 39
percent rely on electricity.22
Figure 4: U.S Electricity Generation 2001 vs. 2014 (This figure has been created from derived data from EIA)23
Similar to gasoline, in addition to tax, retail electricity pricing bears the costs and
profit margins of producers, generators, transmitters and distributers. Generating
electricity is not the only cost incorporated into the process. In light of the fact that
natural gas accounts for roughly a third of electricity generation, it’s bears to reason
that gas spot price variations proportionally affect retail electricity prices.
Weather Dependent Short-term Pricing
To appreciate the lack of short-term correlation between the natural gas spot price and
retailers’ energy bills, it is important to appreciate the warning that “winter is
coming.”
As fuel consumption is highest in winter, local distribution companies (LDCs) must
purchase and store sufficient supplies of natural gas in anticipation of such to
successfully meet peak demand. The buying and storing of natural gas in anticipation
of winter demand can begin as early as April in the U.S. It is common practice for
LDCs to buy natural gas futures contracts in order to hedge against price fluctuations
expected in future months. Additional hedging may be utilized when LDCs purchase
20 AGENCY, I. E. 2015. Key World Energy Statistics. International Energy Agency.
21 U.S. ENERGY INFORMATION ADMINISTRATION: NET GENERATION FOR ALL SECTORS, A. 2016. Electricity Data Browser. Annual. U.S.
Energy Information Administration.
22 ADMINISTRATION, U. S. E. I. Ibid.Short-term Energy Outlook: Projected Winter Expenditures by Fuel and Region.
23 U.S. ENERGY INFORMATION ADMINISTRATION: NET GENERATION FOR ALL SECTORS, A. Ibid.Electricity Data Browser.
5. 5
natural gas as required, at the current spot rate. As a result, residential prices will
often reflect natural gas prices set many months prior to the current market price.
Furthermore, residential prices are state regulated, causing rate changes to
significantly lag behind the variable costs experienced by LDCs.24
It is noteworthy that while the price of oil is heavily determined by supply and
demand, residential natural gas pricing is more subject to complex weather
constraints, and comprises fixed and variable costs. The fixed component covers the
LDC’s operating and transportation costs associated with delivering natural gas to
consumers, while the variable component represents the natural gas spot rate.25
In the summer months, homes require less heating, thus the LDC’s fixed costs are
spread over lower consumptions, making the price per unit for natural gas higher in
summer and lower in winter, as depicted in Figure 5. Nonetheless, energy bills are
more affected by consumption than by unit price. Since energy consumption is
invariably greater in winter, consumer energy bills are higher in this season than in
the summer.26
[It’s somewhat ironic that extracting natural gas warms the planet, yet
a warmer planet relies less heavily on natural gas.]
Figure 5: Why Does It Always Rain On Me? (This figure has been created from derived data from EIA)27
Long-term Contracts Set Long-term Prices
Geologists have been aware of natural gas in shale formations since the early 1900s,
but only with advances in mining technology over the last two decades has this
method of extraction become economical.28
Between 2008 and 2012, production from
shale formations increased from 11 to 35 percent of total U.S. natural gas
production. 29
Similar to dynamics resulting from Organization of Petroleum
Exporting Countries production levels of oil, cheaper capital expenditure and larger
shale production in the U.S. resulted in the Henry Hub price (primary price set for the
North American natural gas market) falling to record low levels.
24 ADMINISTRATION, U. S. E. I. Ibid.Today In Energy: Changes in natural gas spot prices may not quickly translate to consumer prices.
25 Ibid.
26 Ibid.
27 JOSHUA LINN, L. M., YUSHUANG WANG 2014. How do Natural Gas Prices Affect Electricity Consumers and the Environment? Resources
for the Future,, 11 - 12.
28 Ibid.
29 Ibid.
0.00
1.00
2.00
3.00
4.00
5.00
6.00
7.00
0.00
2.00
4.00
6.00
8.00
10.00
12.00
14.00
16.00
18.00
20.00
Nov 2013 Mar 2014 Jun 2014 Sep 2014 Dec 2014 Apr 2015 Jul 2015 Oct 2015 Jan 2016 May 2016
Natural Gas
($/thousand cubic feet)
Residential Electricity
(cents/kWh)
Why Does It Always Rain On Me?
Residential Electricity Residential Natural Gas Henry Hub Natural Gas
6. 6
As a result of shale providing vast quantities of gas, producers with foresight have
found it easier to mitigate their risk and satisfy financiers, by guaranteeing buyers for
their gas by entering into long-term contracts. However, these contracts have the
capacity to deny producers from reaping any benefit from a rise in the natural gas
price,30
unless the contract ties the agreed-upon gas price to some market variations.
These locked-in purchase agreements for gas may explain the negative 65 percent
correlation between the Henry Hub spot rate and retail electricity pricing since 2005,
which is illustrated in Figure 6.31,32
Clearly, consumers’ energy bills may not reflect
current market natural gas pricing if electricity generators continue to be bound in
contract by previous, higher natural gas prices.
0
2
4
6
8
10
12
14
16
0.00
2.00
4.00
6.00
8.00
10.00
12.00
14.00
Jan-2004 May-2005 Oct-2006 Feb-2008 Jul-2009 Nov-2010 Apr-2012 Aug-2013 Dec-2014 May-2016 Sep-2017
Henry Hub
($/MMBtu)
Residential Electricity
(c/kWh)
Henry Hub Natural Gas vs.
Residential Electricity Price
Residential Electricity Henry Hub Natural Gas
Figure 6: Henry Hub Natural Gas vs. Residential Electricity Price (This figure has been created from derived data from
EIA).33,34
Peaks in the Henry Hub price are often due to extreme weather conditions. Hurricane Katrina and Rita occurred in
2005,17
followed by extreme heat waves later that year.35
The collapse during 2008 was a result of the GFC. In 2014, an extreme
winter freeze caused a spike in the natural gas spot price.36
Cumulatively, coal and natural gas are responsible for 66 percent of electricity
generation in the U.S. and both commodities are often purchased under long-term
contracts.37
If market prices for natural gas and coal rise above the agreed-upon
contract price, consumers benefit; but if market prices fall, consumers could be left
with the bill, a risk that regulators would prefer to avoid.38
30 BEN CASSELMAN, R. S. 2009. Energy Firms Think Long Term. Natural-Gas Producers Want to Lock in Prices After Drop, but Some
Customers Bulk [Online]. Available: http://www.wsj.com/articles/SB10001424052748704134104574624491513755228 [Accessed 07
March 2016].
31 ADMINISTRATION, U. S. E. I. 2016b. Natural Gas: Henry Hub Natural Gas Spot Price. Monthly. U.S. Energy Information Administration.
32 ADMINISTRATION, U. S. E. I. 2016a. Electricity: Sales. Monthly. U.S. Energy Information Administration.
33 ADMINISTRATION, U. S. E. I. 2016b. Natural Gas: Henry Hub Natural Gas Spot Price. Monthly. U.S. Energy Information Administration.
34 ADMINISTRATION, U. S. E. I. 2016a. Electricity: Sales. Monthly. U.S. Energy Information Administration.
35 FEDERAL ENERGY REGULATORY COMMISSION 2005-2006. Natural Gas Market Summary. Spot Henry Hub Gas Prices. Federal Energy
Regulatory Commission.
36 ADMINISTRATION, U. S. E. I. 2014. Today In Energy: Northeast and Mid-Atlantic power prices react to winter freeze and natural gas
constraints. Monthly. U.S. Energy Information Administration.
37 JOSHUA LINN, L. M., YUSHUANG WANG 2014. How do Natural Gas Prices Affect Electricity Consumers and the Environment? Resources
for the Future,, 11 - 12.
38 BEN CASSELMAN, R. S. 2009. Energy Firms Think Long Term. Natural-Gas Producers Want to Lock in Prices After Drop, but Some
Customers Bulk [Online]. Available: http://www.wsj.com/articles/SB10001424052748704134104574624491513755228 [Accessed 07
March 2016].
7. 7
References
ADMINISTRATION, U. S. E. I. Today In Energy: 2011 Brief - Brent crude oil
averages over $100 per barrel in 2011 - Transportation Bottlenecks.
Annual. U.S. Energy Information Administration.
ADMINISTRATION, U. S. E. I. 2014. Today In Energy: Northeast and Mid-Atlantic
power prices react to winter freeze and natural gas constraints. Monthly.
U.S. Energy Information Administration.
ADMINISTRATION, U. S. E. I. 2016a. Electricity: Sales. Monthly. U.S. Energy
Information Administration.
ADMINISTRATION, U. S. E. I. 2016b. Natural Gas: Henry Hub Natural Gas Spot
Price. Monthly. U.S. Energy Information Administration.
ADMINISTRATION, U. S. E. I. 2016c. Petroleum and Other Liquids: Gasoline and
Diesel Fuel Update - Gasoline Pump Components History. Annual. U.S.
Energy Information Administration.
ADMINISTRATION, U. S. E. I. 2016d. Petroleum and Other Liquids: Spot Prices.
Weekly. U.S. Energy Information Administration.
ADMINISTRATION, U. S. E. I. 2016e. Short-term Energy Outlook: Projected
Winter Expenditures by Fuel and Region. Annual. U.S. Energy Information
Administration.
ADMINISTRATION, U. S. E. I. 2016f. Today In Energy: Changes in natural gas spot
prices may not quickly translate to consumer prices. Annual. U.S. Energy
Information Administration.
AGENCY, I. E. 2015. Key World Energy Statistics. International Energy Agency.
BEN CASSELMAN, R. S. 2009. Energy Firms Think Long Term. Natural-Gas
Producers Want to Lock in Prices After Drop, but Some Customers Bulk
[Online]. Available:
http://www.wsj.com/articles/SB1000142405274870413410457462449
1513755228 [Accessed 07 March 2016].
FAHEY, M. 2015. When crude is far cheaper than gasoline, middlemen win.
Available: http://www.cnbc.com/2015/09/03/when-crude-is-far-
cheaper-than-gasoline-middlemen-win.html [Accessed 07 March 2016].
FEDERAL ENERGY REGULATORY COMMISSION 2005-2006. Natural Gas Market
Summary. Spot Henry Hub Gas Prices. Federal Energy Regulatory
Commission.
JOSHUA LINN, L. M., YUSHUANG WANG 2014. How do Natural Gas Prices Affect
Electricity Consumers and the Environment? Resources for the Future,, 11
- 12.
LAWRENCE KUMINS & ROBERT BAMBERGER 2005. Oil and Gas Disruption From
Hurricanes Katrina and Rita. Congressional Research Service.
MARK FAHEY. 2016. Refiners are finally sharing more of those oil savings.
Available: http://www.cnbc.com/2016/01/22/refiners-are-finally-
sharing-more-of-those-oil-savings.html [Accessed 03/03/2016].
MAUREEN KLEIN. 04 March 2016 2016. RE: Distribution and Marketing.
![2
respectively. Instead, as shown in Figure 1, this theory only holds true for taxation,
which has consistently contributed approximately $0.43/gallon since the year 2000.6
The contributions to the gasoline price of the less predictable pricing inputs were
more variable in their fluctuations.7
Indeed in 2016, removing oil and tax from the
gasoline price equation, resulted in competition between refining and D&M for their
share of $0.75/gallon. D&M boosted its share by $0.14/gallon, while refining reduced
its share by $0.07/gallon.
Some argue that the struggle between refiners and D&Ms depends upon the price of
the gasoline leaving the refinery.8
Severe weather conditions in the past have severely
impacted refinery operations, often resulting in shutdowns spanning several weeks or
more.9
While demand remains high throughout these times, gasoline supply is limited
and thus, refiners can charge a higher price for their product, and distributers must
compete for greater margins. Conversely, when the gasoline inventories of refiners
are high and demand remains high, distributers hold the bargaining power.
Monthly data reveals that since January 2000, an inverse correlation of 30 percent has
existed between the refiners and the D&M percentage contributions to retail gasoline
prices.10
Importantly, during the global financial crisis (Figure 2) and since the oil
crash of June 2014 (Figure 3), this inverse correlation between the two pricing
contributors has increased to 67 percent and 48 percent respectively.11
$0.00
$0.50
$1.00
$1.50
$2.00
$2.50
$3.00
$3.50
$4.00
$4.50
-10%
-5%
0%
5%
10%
15%
20%
25%
30%
Nov-07 Feb-08 Jun-08 Sep-08 Dec-08 Mar-09 Jul-09 Oct-09
Retail Gasoline
Price&Per&Gallon&
Percentage Contribution
to Gasoline's Price
Retail&Gasoline&Pricing&Components'&
Varia5ons&Throughout&GFC&
Refining D&M Retail Gasoline
Figure 2: Retail Gasoline Pricing Components’ Variation Throughout the Global Financial Crisis (This figure has been
created from derived data from EIA)12
6 Ibid.
7 Ibid.
8 MARK FAHEY. 2016. Refiners are finally sharing more of those oil savings. Available: http://www.cnbc.com/2016/01/22/refiners-are-
finally-sharing-more-of-those-oil-savings.html [Accessed 03/03/2016].
9 LAWRENCE KUMINS & ROBERT BAMBERGER 2005. Oil and Gas Disruption From Hurricanes Katrina and Rita. Congressional Research
Service.
10 ADMINISTRATION, U. S. E. I. 2016c. Petroleum and Other Liquids: Gasoline and Diesel Fuel Update - Gasoline Pump Components History.
Annual. U.S. Energy Information Administration.
11 Ibid.
12 Ibid.](data:image/gif;base64,R0lGODlhAQABAIAAAAAAAP///yH5BAEAAAAALAAAAAABAAEAAAIBRAA7)