Analysis postgre sql-vs_mongodb_report
•
3 likes•2,196 views

· A comprehensive evaluation of performance of NoSQL DBMS MongoDB with Postgre SQL DBMS using YCSB. · Measured the Benchmarks for Tier1: Performance and Tier2: Scalability using the YCSB tool.

Recommended
Recommended
More Related Content
What's hot
What's hot (20)
Similar to Analysis postgre sql-vs_mongodb_report
Similar to Analysis postgre sql-vs_mongodb_report (20)
Recently uploaded
Recently uploaded (20)
Analysis postgre sql-vs_mongodb_report
- 1. Assignment 3: YCSB, SQL and NoSQL CSCI 599: NewSQL Database Management System CSCI 599: NewSQL Database Management Systems Problem Statement – Compare the performance of a SQL and NoSQL DBMS using YCSB. Overview: In the first two assignments, we analyzed the performance of a NoSQL DBMS and a SQL DBMS independent of one another. In this assignment, we compare the performance of the two systems assigned to you by generating graphs similar to those shown in the YCSB paper: Response time as a function of the throughput. System Configuration – Number of CPU(s) One Physical Processor / 8 Cores / 4 Logical Processors / 64 bits CPU Name Intel(R) Core(TM) i5-2410M CPU @ 2.30GHz Installed RAM ChannelA – 2048 Mbytes + ChannelB – 2048 Mbytes Speed (RAM) 1333MHz Disk Space Disk C: 151 GB Available, 227 GB Total, 151 GB Free Disk Interface IDE SATA-II Controller Buffer Size 16 MBytes Operating System Windows 7 64bit Physical Memory 4011 MB Total, 863 MB Free Virtual Memory 8019 MB Total, 2034 MB Free Memory Load 78% PageFile Size 4010 MB In use 2431 MB Max used 2437 MB Assumptions: Turbo boost and Hyper threading for the processor mentioned above is ON for the whole experiment and may cause some erratic variations in the performance measured values. Benchmark Tiers Tier1 – Performance - Constant Hardware , Increase offered throughput. - Measure the Achieved throughput and the latency/throughput curve. Tier2 – Scalability - Increase the workload (records) and measure the latency and throughput Results of YCSB – The following are the results calculated by the YCSB for the Postgre(JDBC) client on the system described above. Scenario :- Record Count: - 10000 Operation Count: - 50K Offered Throughput: - X-Axis (Knob) Range 10 to 10000 Achieved Throughput: - Y-axis (measured metric) and Average Latency: - Y-axis (measured metric).
- 2. I. Workload A - read 50% update 50% 1. Tier 1 – Performance Benchmarking: For constant hardware, increase Offered Throughput (op/sec) until saturation. Throughput Performance Measure PostgreSQL MongoDB Offered Throughput Achieved Throughput Achieved Throughput 100 96.5 97.7 1000 982.5 981.2 2500 2370 2382 5000 4610 4549.5 7500 4620 6587.6 10000 4670 8438.8 12500 5420 10150 15000 5330 11560 17500 6330 13000 20000 6190 13980 22500 6350 15670 25000 7260 16660 30000 7030 16310 50000 7100 17100 70000 7150 16900 100000 6960 16980
- 3. Fig A.1: WorkloadA Offered Throughput vs Achieved Throughput Observation- In the above graph, we can observe that PostgreSQL is not able to match up with the consistent increase in achieved throughput as mongoDB does. MongoDB shows higher achieved throughput values for offered load. Conclusion – MongoDB actually does behave like an RDMS system for workload A. It shows overall good performance than PostgreSQL for workload A, as reading and writing is conducted within the usable memory and use of memory mapped files for data storage which hence achieves high-performance. a. Update Latency Measurement UPDATE PostgreSQL MongoDB Offered Throughput Avg Latency Avg Latency 100 1.919 0.86 1000 1.793 0.489 2500 1.683 0.356 5000 1.83 0.376 7500 1.887 0.383 10000 1.91 0.4 12500 1.87 0.436 15000 1.98 0.44 17500 2.54 0.52 20000 3.292 0.64 22500 3.6 0.74 25000 4.23 1.056 30000 4.95 1.21 Fig A.2: WorkloadA Performance Benchmarking - Update Records
- 4. a. Read Latency Measurement READ PostgreSQL MongoDB Offered Throughput Avg Latency Avg Latency 100 0.947 0.419 1000 0.812 0.326 2500 0.869 0.232 5000 0.88 0.257 7500 0.95 0.28 10000 0.96 0.298 12500 0.972 0.31 15000 0.979 0.314 17500 1.008 0.319 20000 1.26 0.432 22500 2.289 0.795 25000 2.805 1.03 30000 3.466 1.45 Fig A.3: WorkloadA Performance Benchmarking - Read Records Observation – PostgreSQL show higher avg latencies for Workload A Updates & Reads compared to MongoDB. For updates we can see that Mongodb shows stable avg latencies. The latency starts to climb up a bit at higher offered load. But Postgres latency remains stable for some initial low loads and then shoots up. Same is observed for Read. Mongodb latency measure is a bit higher for reads than updates. Conclusion – MongoDB actually does behave like an RDMS system for workload A. It shows overall good performance than PostgreSQL for workload A, as reading and writing is conducted within the usable memory, and hence high-performance is possible. As MongoDB makes use of memory mapped files for data storage it shows fast performance and low latencies than SQL counterpart. PostgreSQL cannot handle updates after certain amount of offered load and reached a threshold and shoots up. Mongo is stable for both operations and shows extremely good performance due to mmap read and writes.
- 5. 2. Tier 2 – Scalability: Scaleup – Increase hardware, data size and workload proportionally. Measure latency; should be constant for constant hardware, increase Offered Throughput (op/sec) until saturation a. Update Update Record Count Offered Throughpu t Threads (DB per client) Runtim e Achieved Throughput Operatio ns Avg Latency us Min Latenc y Max Latenc y 1000 1000 default 1517 659.19 514 1660.19 578 10602 0 10000 1000 default 1148 871.08 504 1300.34 604 90786 100000 1000 default 1504 664.89 475 2006.14 643 35379 7 100000 0 1000 default 6893 145.07 494 8273.98 909 30965 3 Record Count Offered Throughpu t Threads (DB per client) Runtim e Achieved Throughput Operatio ns Avg Latency ms Min Latenc y Max Latenc y 1000 1000 default 1213 824.402 495 0.319 0 6 10000 1000 default 1191 839.63 458 0.364 0 58 100000 1000 default 1198 834.724 488 0.247 0 4 100000 0 1000 default 8801 113.623 501 5.92 0 316 b. Read Read Record Count Offered Throughpu t Threads (DB per client) Runtim e Achieved Throughpu t Operation s Avg Latency us Min Latenc y Max Latenc y 1000 1000 default 1517 659.19 486 926.02 196 28179 10000 1000 default 1148 871.08 496 518.19 183 25832 100000 1000 default 1504 664.89 525 463.69 1 200 18230 100000 0 1000 default 6893 145.07 506 4965.1 3 224 39424 Record Count Offered Throughpu t Threads (DB per client) Runtim e Achieved Throughpu t Operation s Avg Latency ms Min Latenc y Max Latenc y
- 6. 1000 1000 default 1213 824.402 505 0.411 0 64 10000 1000 default 1191 839.63 542 0.25 0 6 100000 1000 default 1198 834.724 512 0.347 0 62 100000 0 1000 default 8801 113.623 499 9.18 0 1787 Observation- This too behaves the same as the update operation. When we increase the record count, the Achieved Throughput (op/sec) and the Avg Latency (usec) remains stable until 1 million records. But when we do transactions on 1 million records the Achieved Throughput (op/sec) plummets. Even the Avg Latency (usec) has a steep increase. Conclusion – The read and update for the workload A show similar results in terms of throughput. This is because the reads and updates have 50% distribution each. Here, if we compare the avg latencies for the read and update operations, updates perform well than read operations. Compared to MongoDb – In lower record counts, Postgre max achieved throughput is lesser than MongoDB. Even the Avg Latency (usec) of Postgre is much higher than MongoDB. MongoDB performs better for WorkloadA. But when Postgre performs on 1 million records even its throughput decline, it shows higher throughput and good latency measure than MongoDB. II. Workload B - read 95% update 5% (read intensive) 1. Tier 1 – Performance Benchmarking: For constant hardware, increase Offered Throughput (op/sec) until saturation Throughput Performance Measure PostgreSQL MongoDB Offered Throughput Achieved Throughput Achieved Throughput 100 97.8 96.4 1000 983.9 971.2 2500 2446 2382 5000 4659 4549.5 7500 6710 6587.6 10000 7540 8438.8 12500 9810 10150 15000 11080 11560 17500 11640 13000 20000 12640 13980 22500 13260 15670 25000 14020 16310 30000 15020 17760 50000 15550 17900
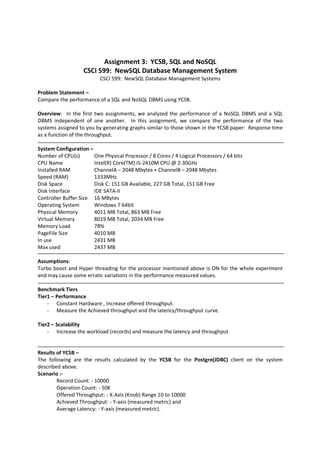
- 7. Fig B.1: WorkloadB Offered Throughput vs Achieved Throughput Observation- In the above graph, we can observe that PostgreSQL throughput is good for lower offered throughput values. But it is not able to match up with the consistent increase in achieved throughput as mongoDB does. MongoDB shows higher achieved throughput values for higher offered throughput. Conclusion – MongoDB actually does behave like an RDMS system for workload B. It shows overall good performance than PostgreSQL for workload B, as reading and writing is conducted within the usable memory and use of memory mapped files for data storage which hence achieves high-performance. PostgreSQL show good performance for less offered load but as we gradually increase the offered load, its performance start to decline. On other hand, mongodb shows consistent growth in achieved throughput for WorkloadB (95%Read). a. Update Average Latency UPDATE PostgreSQL MongoDB Offered Throughput Avg Latency Avg Latency 100 1.919 0.86 1000 1.793 0.489 2500 1.683 0.356 5000 1.83 0.376 7500 1.887 0.383 10000 1.91 0.4 12500 1.87 0.436
- 8. 15000 1.98 0.44 17500 2.54 0.52 20000 3.292 0.64 22500 3.6 0.74 25000 4.23 1.056 30000 4.95 1.21 Fig B.2: WorkloadB Performance Benchmarking - Update Records b. Read Average Latency READ PostgreSQL MongoDB Offered Throughput Avg Latency Avg Latency 100 0.947 0.419 1000 0.812 0.326 2500 0.869 0.232 5000 0.88 0.257 7500 0.95 0.28 10000 0.96 0.298 12500 0.972 0.31 15000 0.979 0.314 17500 1.008 0.319 20000 1.26 0.432 22500 2.289 0.795 25000 2.805 1.03 30000 3.466 1.45
- 9. Fig B.3: WorkloadB Performance Benchmarking - Read Records Observation – PostgreSQL show higher avg latencies for Workload B Updates & Reads compared to MongoDB. For updates we can see that Mongodb shows comparatively stable avg latencies. The latency starts to climb up a bit at higher offered load. But Postgres latency remains stable for some initial low loads during Reads and then shoots up. It shows consistent increase in avg latency for Updates though. Mongodb latency measure for Reads is better than Updates in this case. Conclusion – MongoDB actually does behave like an RDMS system for workload B. It shows overall good performance than PostgreSQL for workload B, as reading and writing is conducted within the usable memory, and hence high-performance is possible. As MongoDB makes use of memory mapped files for data storage it shows fast performance and low latencies than SQL counterpart. Postgres show good latencies for Reads than MongoDB. But when the load increases to higher levels the latencies shoots up. In this case the update latencies for Postgre is consistently increased. Mongo is stable for both operations and shows extremely good performance due to mmap read and writes. Though for updates Mongodb update latencies are not that good as compared to latencies for Workload B. This may be because mongod process uses a modified reader/writer lock with dynamic yielding on page faults and long operations. Any number of concurrent read operations are allowed, but a write operation can block all other operations. Write lock acquisition is greedy and will prevent further read lock acquisitions until fulfilled. Thus yielding by reads can be important. So it gives priority to Reads than Updates. 2. Tier 2 – Scalability: Scaleup – Increase hardware, data size and workload proportionally. Measure latency; should be constant for constant hardware, increase Offered Throughput (op/sec) until saturation a. Update Postgre Record Count Offered Throughpu t Threads (DB per client) Runtim e Achieved Throughput Operatio ns Avg Latenc y Min Latenc y Max Latenc y 1000 1000 default 1219 820.34 51 0.803 0 9
- 10. 10000 1000 default 1211 825.76 48 0.437 0 5 100000 1000 default 1201 832.63 40 1 0 15 100000 0 1000 default 6710 149.03 55 19.2 0 146 Mongo Record Count Offered Throughpu t Threads (DB per client) Runtim e Achieved Throughput Operatio ns Avg Latenc y Min Latenc y Max Latenc y 1000 1000 default 1219 820.34 51 0.803 0 9 10000 1000 default 1211 825.76 48 0.437 0 5 100000 1000 default 1201 832.63 40 1 0 15 100000 0 1000 default 6710 149.03 55 19.2 0 146 b. Read Postgre Record Count Offered Throughpu t Threads (DB per client) Runtim e Achieved Throughput Operatio ns Avg Latenc y Min Latenc y Max Latenc y 1000 1000 default 1219 820.3 949 0.6 0 126 10000 1000 default 1211 825.8 952 0.3 0 58 100000 1000 default 1201 832.6 960 0.36 0 59 100000 0 1000 default 6710 149 945 5.68 0 461 Mongo Record Count Offered Throughpu t Threads (DB per client) Runtim e Achieved Throughput Operatio ns Avg Latenc y Min Latenc y Max Latenc y 1000 1000 default 1219 820.3 949 0.6 0 126 10000 1000 default 1211 825.8 952 0.3 0 58 100000 1000 default 1201 832.6 960 0.36 0 59 100000 0 1000 default 6710 149 945 5.68 0 461 Observation- This too behaves the same as the update operation. When we increase the record count, the Achieved Throughput (op/sec) and the Avg Latency (usec) remains stable until 1 million records. But when we do transactions on 1 million records the Achieved Throughput (op/sec) plummets. Even the Avg Latency (usec) has a steep increase.
- 11. Conclusion – The read and update for the workload B show similar results in terms of throughput. Here update operations show more latency than reads. Hence postgre performs well in reads for workloadB Compared to MongoDb –Posgre shows slightly better achieved throughput values than Mongodb. The Avg Latency (usec) of Postgre is higher than MongoDB for updates but Postgre does really well during 95% reads. It shows good throughput and even less avg latency. According the above result Posgre performs well for WorkloadB for reads when it scales up. III. Workload C – Read 100% 1. Tier 1 – Performance Benchmarking: For constant hardware, increase Offered Throughput (op/sec) until saturation Throughput Performance Measure PostgreSQL MongoDB Offered Throughput Achieved Throughput Achieved Throughput 100 98.8 97.3 1000 996.9 985 2500 2467 2409.8 5000 4780 4680 7500 6890 8902 10000 9980 10203 17500 11890 13630 22500 13560 15708 30000 15390 17950 50000 16100 17084 100000 15930 17401
- 12. Fig C.1: WorkloadC Offered Throughput vs Achieved Throughput Observation- In the above graph, we can observe that PostgreSQL throughput is good for lower offered throughput values. But it is not able to match up with the consistent increase in achieved throughput as mongoDB does. MongoDB shows higher achieved throughput values for higher offered throughput. Conclusion – MongoDB actually does behave like an RDMS system for workload C. It shows overall good performance than PostgreSQL for workload C, as reading and writing is conducted within the usable memory and use of memory mapped files for data storage which hence achieves high- performance. Postgre is better than Mongdb for lower load values. But show slight lower performance than Mongod for higher offered load. It seems Postgre in this case for Workload C tries to match up with MongoDB for 100% Reads. And it succeeds in that! a. Average Read Latency READ PostgreSQL MongoDB Offered Throughput Avg Latency Avg Latency 100 0.442 0.318 1000 0.395 0.36 2500 0.385 0.33 5000 0.393 0.33 7500 0.407 0.33 10000 0.457 0.344 17500 0.466 0.35 22500 0.578 0.49 30000 0.87 0.53 50000 1.08 0.63
- 13. Fig C.2: WorkloadC Performance Benchmarking - Read Records Observation – PostgreSQL show higher avg latencies for Workload C Reads compared to MongoDB. We can see that Mongodb shows stable avg latencies for low loads. The latency starts to climb up a bit at higher offered load. But Postgres latency remains stable for some initial low loads and then shoots up. Conclusion – MongoDB actually does behave like an RDMS system for workload C. It shows overall good performance than PostgreSQL for workload C, as reading and writing is conducted within the usable memory, and hence high-performance is possible. As MongoDB makes use of memory mapped files for data storage it shows fast performance and low latencies than SQL counterpart. PostgreSQL cannot handle reads after certain amount of offered load and reached a threshold and shoots up. Mongo is stable and the latencies does not show any linear rise. Postgre tries to much with mongodb but fails to do that for higher loads. Tier 2: Scalability : The results pretty similar to WorkloadB with 95% Reads. IV. Workload D – read 95% insert 5% (read intensive) The Output for this Workload is similar to Workload C output. So we can refer the results from Workload C for Workload D. For Insert query performance, please refer the figure below – Throughput Performance Measure Offered Throughput Achieved Throughput Achieved Throughput 100 98.74 99.56 1000 997.2 995.44 5000 3785.29 4892.84 10000 3761.37 9035.056 50000 3752.9 9172.62
- 14. Fig D.1: WorkloadA Offered Throughput vs Achieved Throughput Observation- In the above graph PostgreSQL is not able to match up with the consistent increase in achieved throughput as mongoDB does. MongoDB shows higher achieved throughput values for higher offered throughput. The achieved throughput increases and then gets stable at some threshold points. The threshold point for postgre is less than mongodb for workload D. Conclusion – MongoDB actually does behave like an RDMS system for workload D. It shows overall good performance than PostgreSQL for workload D, as reading and writing is conducted within the usable memory and use of memory mapped files for data storage which hence achieves high-performance. Mongodb performs effeciently for inserts as well than SQL because, MongoDB uses a format called BSON which is a binary representation of this data. MongoDB is quite fast at a series of singleton inserts as it is a document oriented DBMS. a. Insert INSERT PostgreSQL MongoDB Offered Throughput Avg Latency Avg Latency 100 1.05 0.22 1000 1.094 0.23 5000 1.12 0.24 10000 1.636 0.42 50000 3.96 1.34
- 15. Fig D.2: WorkloadD Performance Benchmarking - Insert Records b. Read READ PostgreSQL MongoDB Offered Throughput Avg Latency Avg Latency 100 0.2 0.08 1000 0.21 0.089 5000 0.215 0.09 10000 0.5 0.12 50000 1.42 0.46 Fig D.3: WorkloadD Performance Benchmarking - Read Records
- 16. Observation – PostgreSQL show higher avg latencies for Workload D Inserts & Reads compared to MongoDB. MongoDB insert and reads show similar avg latencies and are stable and then increase slightly. Postgre shows linear increase in latencies when load is increased. Conclusion – MongoDB actually does behave like an RDMS system for workload D. It shows overall good performance than PostgreSQL for workload D, as reading and writing is conducted within the usable memory, and hence high-performance is possible. As MongoDB makes use of memory mapped files for data storage it shows fast performance and low latencies than SQL counterpart. Mongodb performs effeciently for inserts as well than SQL because, MongoDB uses a format called BSON which is a binary representation of this data. MongoDB is quite fast at a series of singleton inserts as it is a document oriented DBMS. Postgres have higher latencies for inserts as indexing is done on a field. Here we can see - a. Only Insert - 1,00,000 records PostgrSQL => Record Count Offered Throughput (op/sec) Threads (DB per client) Runtime (msec) Achieved Throughput (op/sec) Operations Avg Latency (usec) Min Latency (usec) Max Latency (usec) 100000 1000 default 117366 852.03 100000 1.16148 447 308977 Fig 1.d.1: WorkloadD Performance Benchmarking – Insert Bulk Records PostgreSQL MongoDB Record Count Offered Throughpu t (op/sec) Threads (DB per client) Runtim e (msec) Achieved Throughpu t (op/sec) Operation s Avg Latency (usec) Min Latency (usec) Max Latency (usec) 100000 1000 default 100189 998.113 100000 0.0566 9 0 591 Compared to MongoDb – Posgre shows has a slight less throughput for inserting 1 Lac records. And even the latency is higher than mongodb as index is created on a key. Mongodb shows good results for inserting records. V. Workload E – scan 95% insert 5% (scan intensive) 1. Tier 1 – Performance Benchmarking: For constant hardware, increase Offered Throughput (op/sec) until saturation Throughput Performance Measure Offered Throughput Achieved Throughput Achieved Throughput 100 99.71 99.54 1000 917.29 815.95 2000 1989.57 853.43 5000 2287.2 894.71 10000 9511.6 809.17 30000 11755.3 824.34
- 17. 50000 13073.9 903 Fig E.1: WorkloadE Offered Throughput vs Achieved Throughput Observation- In the above graph, we can observe that PostgreSQL throughput is performance very efficiently than Mongodb. Its indexing helps it a lot to achieve higher throughput. Mongodb performance cannot even match SQL for scan opeartions. Conclusion – Postgres shows better results as it has indexing on a key which helps to search efficiently than mongodb. We haven’t created indexes on Mongodb for this experiment. May be mongodb will do well if indexes are created. The throughput remains stable at around 900 for mongodb. Postgre show linear increase in the throughput as the load increases. a. Scan 95% SCAN READ PostgreSQL MongoDB Offered Throughput Avg Latency Avg Latency 100 0.227 1.12 1000 0.349 1.13 2000 0.391 1.2 5000 0.736 1.25 10000 0.819 1.34 30000 0.945 1.53 50000 1.02 2.57
- 18. Fig E.2: WorkloadE Performance Benchmarking - Scan Records Observation – PostgreSQL show very stable and low avg latency than mongodb. Mongodb latency increases gradually as load increase. Conclusion – Mongodb shows superb performance for scan intensive operations. Indexing helps Postgre to maintain high achieved throughput and low latencies. Mongodb struggles to keep up with postgre for scan operations. VI. Workload F – Read 50% & ReadModifyWrite 50% 1. Tier 1 – Performance Benchmarking: For constant hardware, increase Offered Throughput (op/sec) until saturation Throughput Performance Measure PostgreSQL Mongodb Offered Throughput Achieved Throughput Achieved Throughput 100 99.96 99.54 1000 971.28 995.48 5000 1025.97 4892.36 10000 1003.81 7392.07 50000 1027.96 7237.98
- 19. Fig F.1: WorkloadF Offered Throughput vs Achieved Throughput Observation- In the above graph, we can observe that PostgreSQL throughput show poor performance than Mogodb. Mongodb throughput increases and becomes stable higher than postgre. Conclusion – MongoDB actually does behave like an RDMS system for workload F. It shows overall good performance than PostgreSQL for workload F, as reading and writing is conducted within the usable memory and use of memory mapped files for data storage which hence achieves high-performance. Postgre follows consistency (atomic operations) in read modifies and hence hampers the throughput. a. Read-Modify-Write READ/Modified READ PostgreSQL MongoDB Offered Throughput Avg Latency Avg Latency 100 0.0013 1.34 1000 0.0011 0.21 5000 0.0015 0.14 10000 0.0018 0.15 50000 0.0014 0.16
- 20. Fig A.2: WorkloadF Performance Benchmarking – Read/Modify Records b. Read READ READ PostgreSQL MongoDB Offered Throughput Avg Latency Avg Latency 100 0.951 0.65 1000 0.517 0.08 5000 0.514 0.07 10000 0.519 0.07 50000 0.507 0.08 Fig A.3: WorkloadF Performance Benchmarking – Read Records
- 21. Observation – Postgre show very low latencies for read/modifies than Mongodb. Mongodb initially it has high latency but then drops and remains stable. But mongodb has higher latencies than sql. For reads, mongo shows better latency values than postgre. Conclusion – The mongod process uses a modified reader/writer lock with dynamic yielding on page faults and long operations. Any number of concurrent read operations is allowed, but a write operation can block all other operations. Write lock acquisition is greed and a pending write lock acquisition will prevent further read lock acquisitions until fulfilled. Thus yielding by reads can be important. Hence mongodb show higher latencies than postgre. Reads have higher priority than updates and modify and hence show lower latencies than postgre. Conclusion - In this experiment, we did performance analysis of a NoSQL DBMS with a SQL DBMS. We compared PostregreSQL with MongoDB on Tier: Performance and Tier2: Scalability. MongoDB showed better performance measure in most cases like workload A , B, C,D and F. PostgreSQL tried to match with MongoDB in Workload B and C. Postgre showed way better performance than Mongodb for Workload E (Scan) due to indexing. Hence we can conclude that MongoDB is in general a better DBMS system if consistency and atomicity is not main primary goal. In transactional systems like Banking we need to care of consistency and it will a huge task to measure and compare the performance and behavior of NoSQL and SQL DBMS. But on basis of this experiment, in that case SQL will perform superior than NOSQL it seems. Anways, for a small scale application which can scale up in future, NoSQL’s are very good choice to design the DBMS architecture. We can think of using Documen type and key value pair stores for such applications than RDMS which involves indexing and joins which tend to show higher average latency value as seen in this experiment. In last three assignments we have even learnt about how to use YCSB tool to observe the tradeoffs between the write and read performance of database systems NoSQL and SQL under different kind of workloads.