The document is a survey commissioned by Zipcar that examines attitudes of millennials (ages 18-34) around transportation and car ownership compared to older generations. Some key findings:
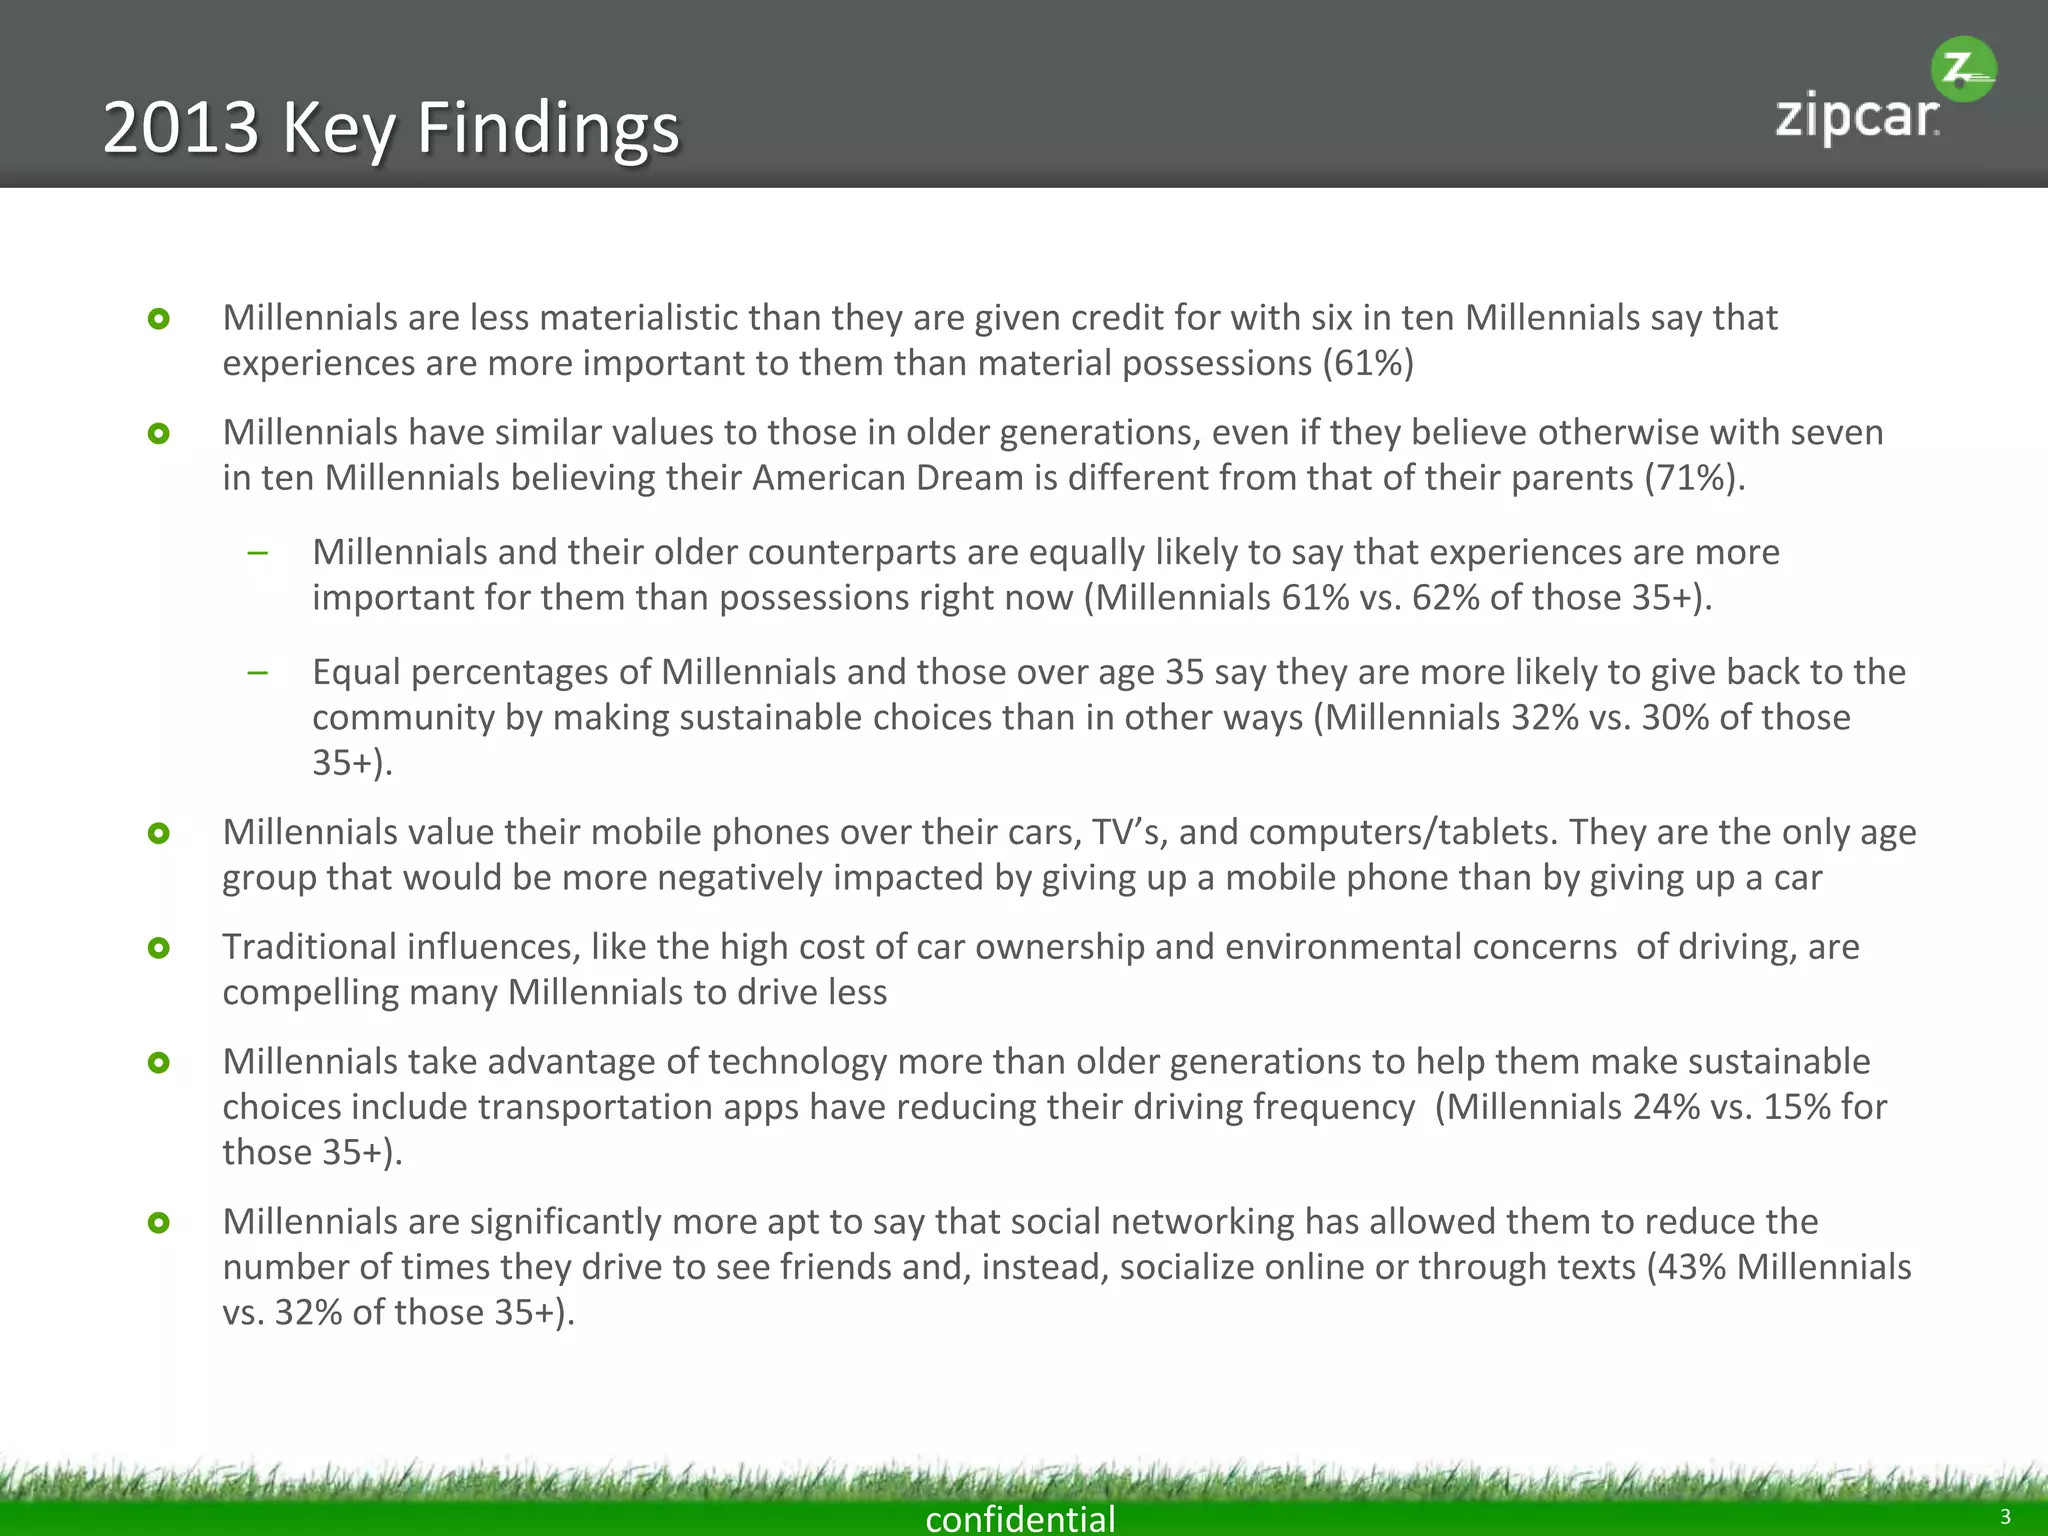
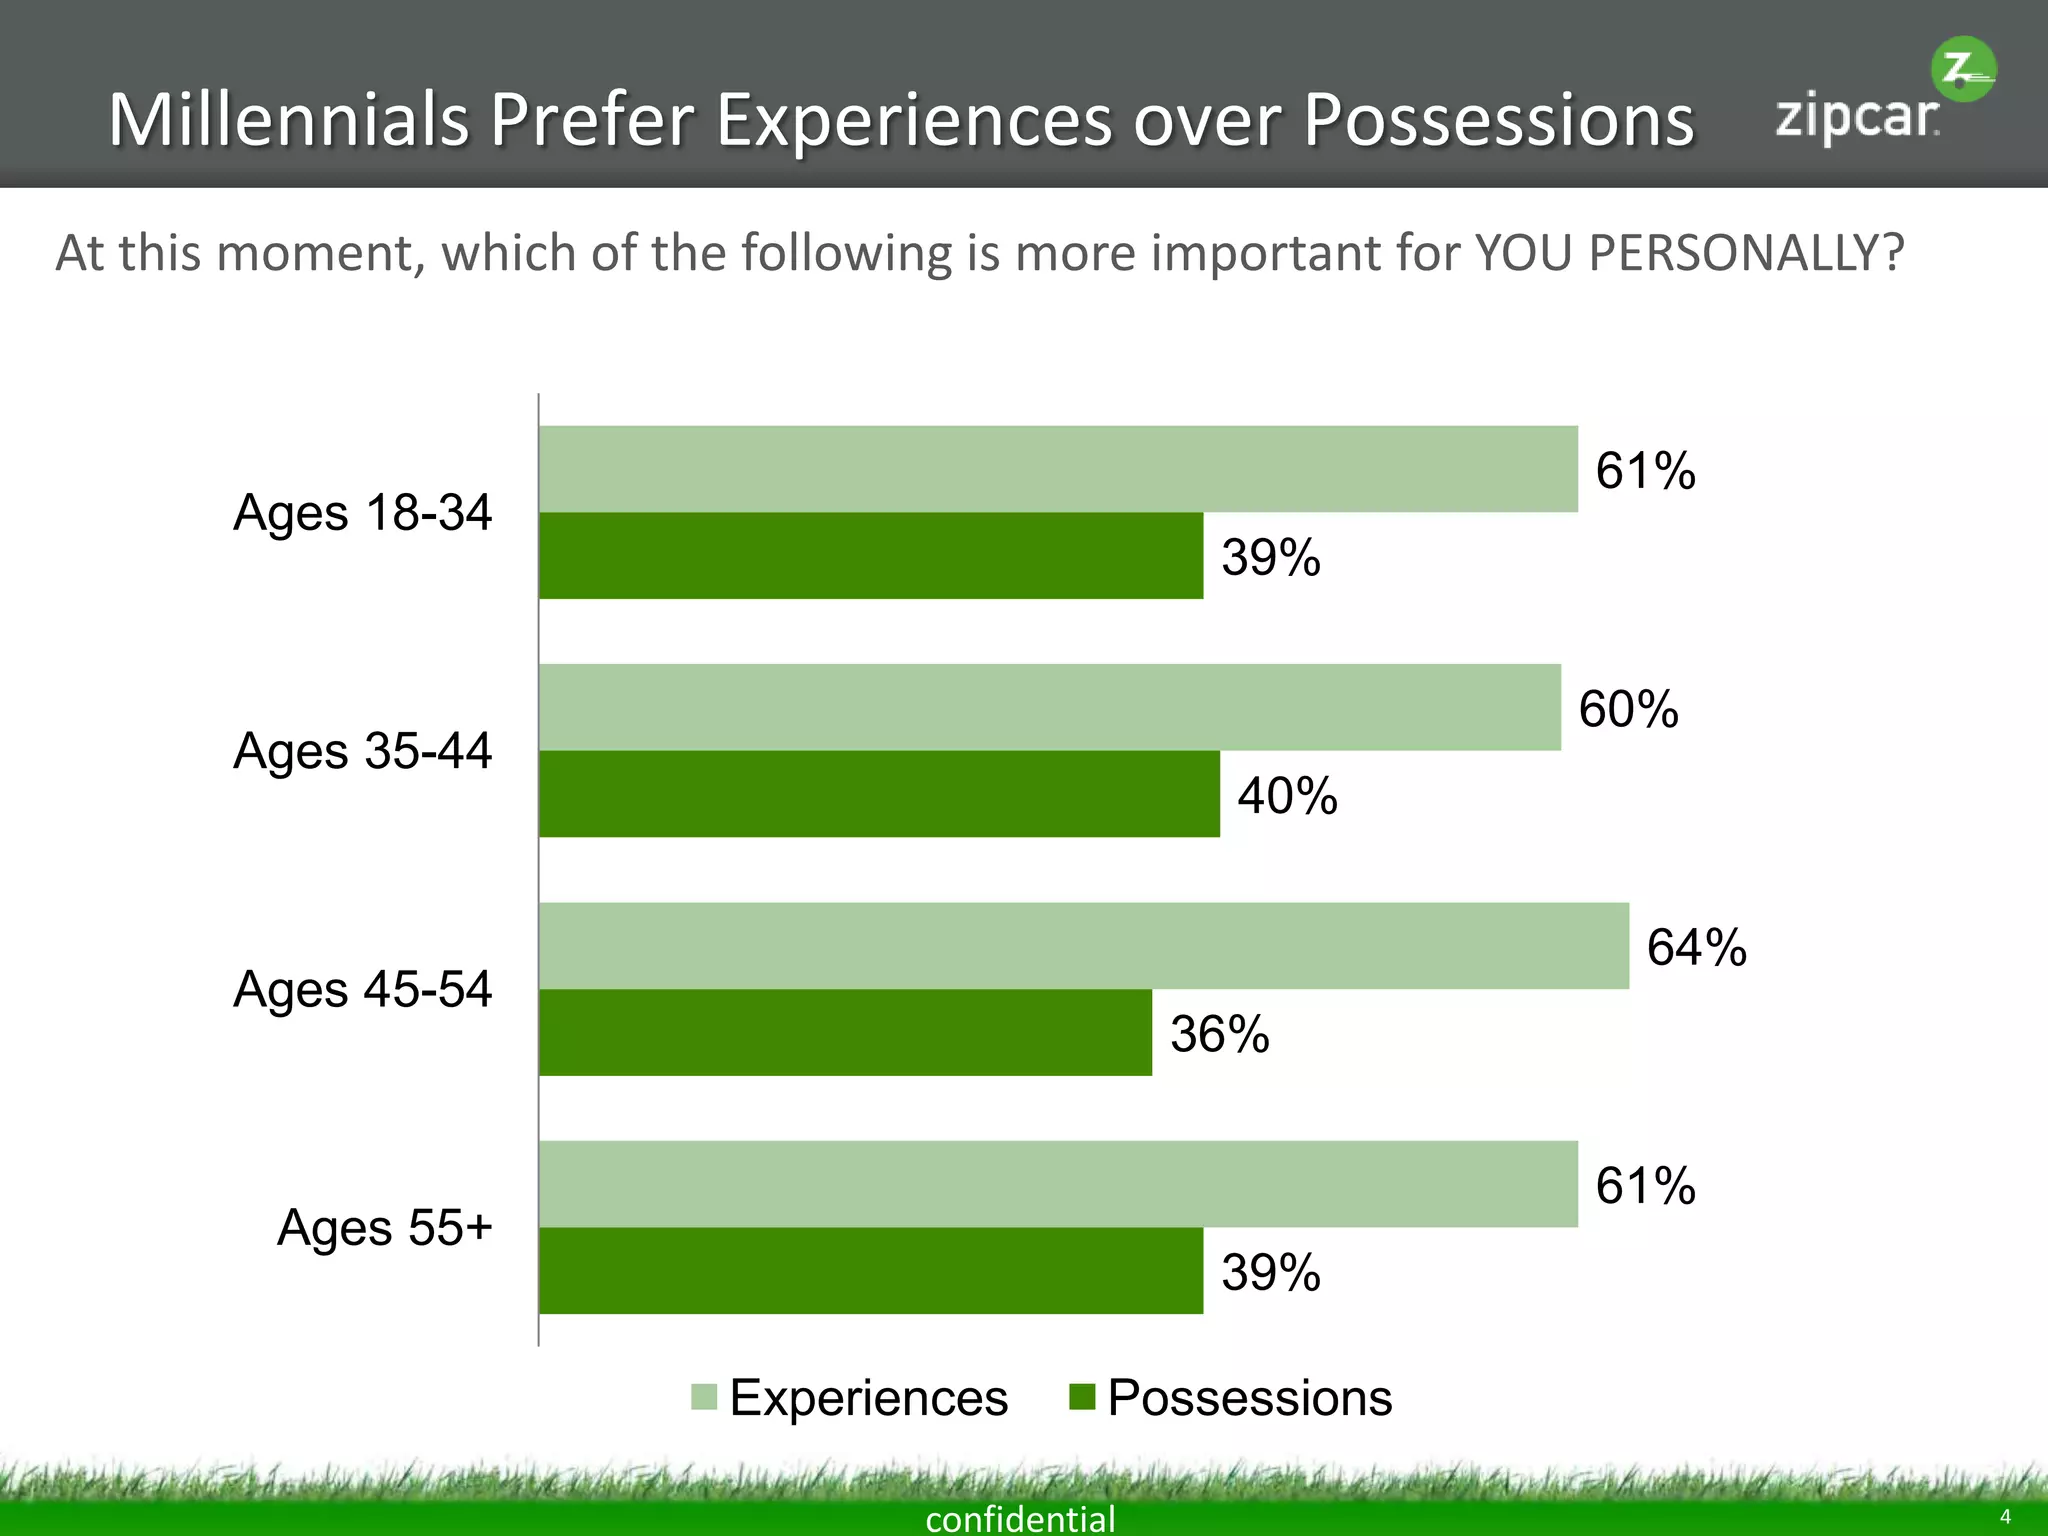
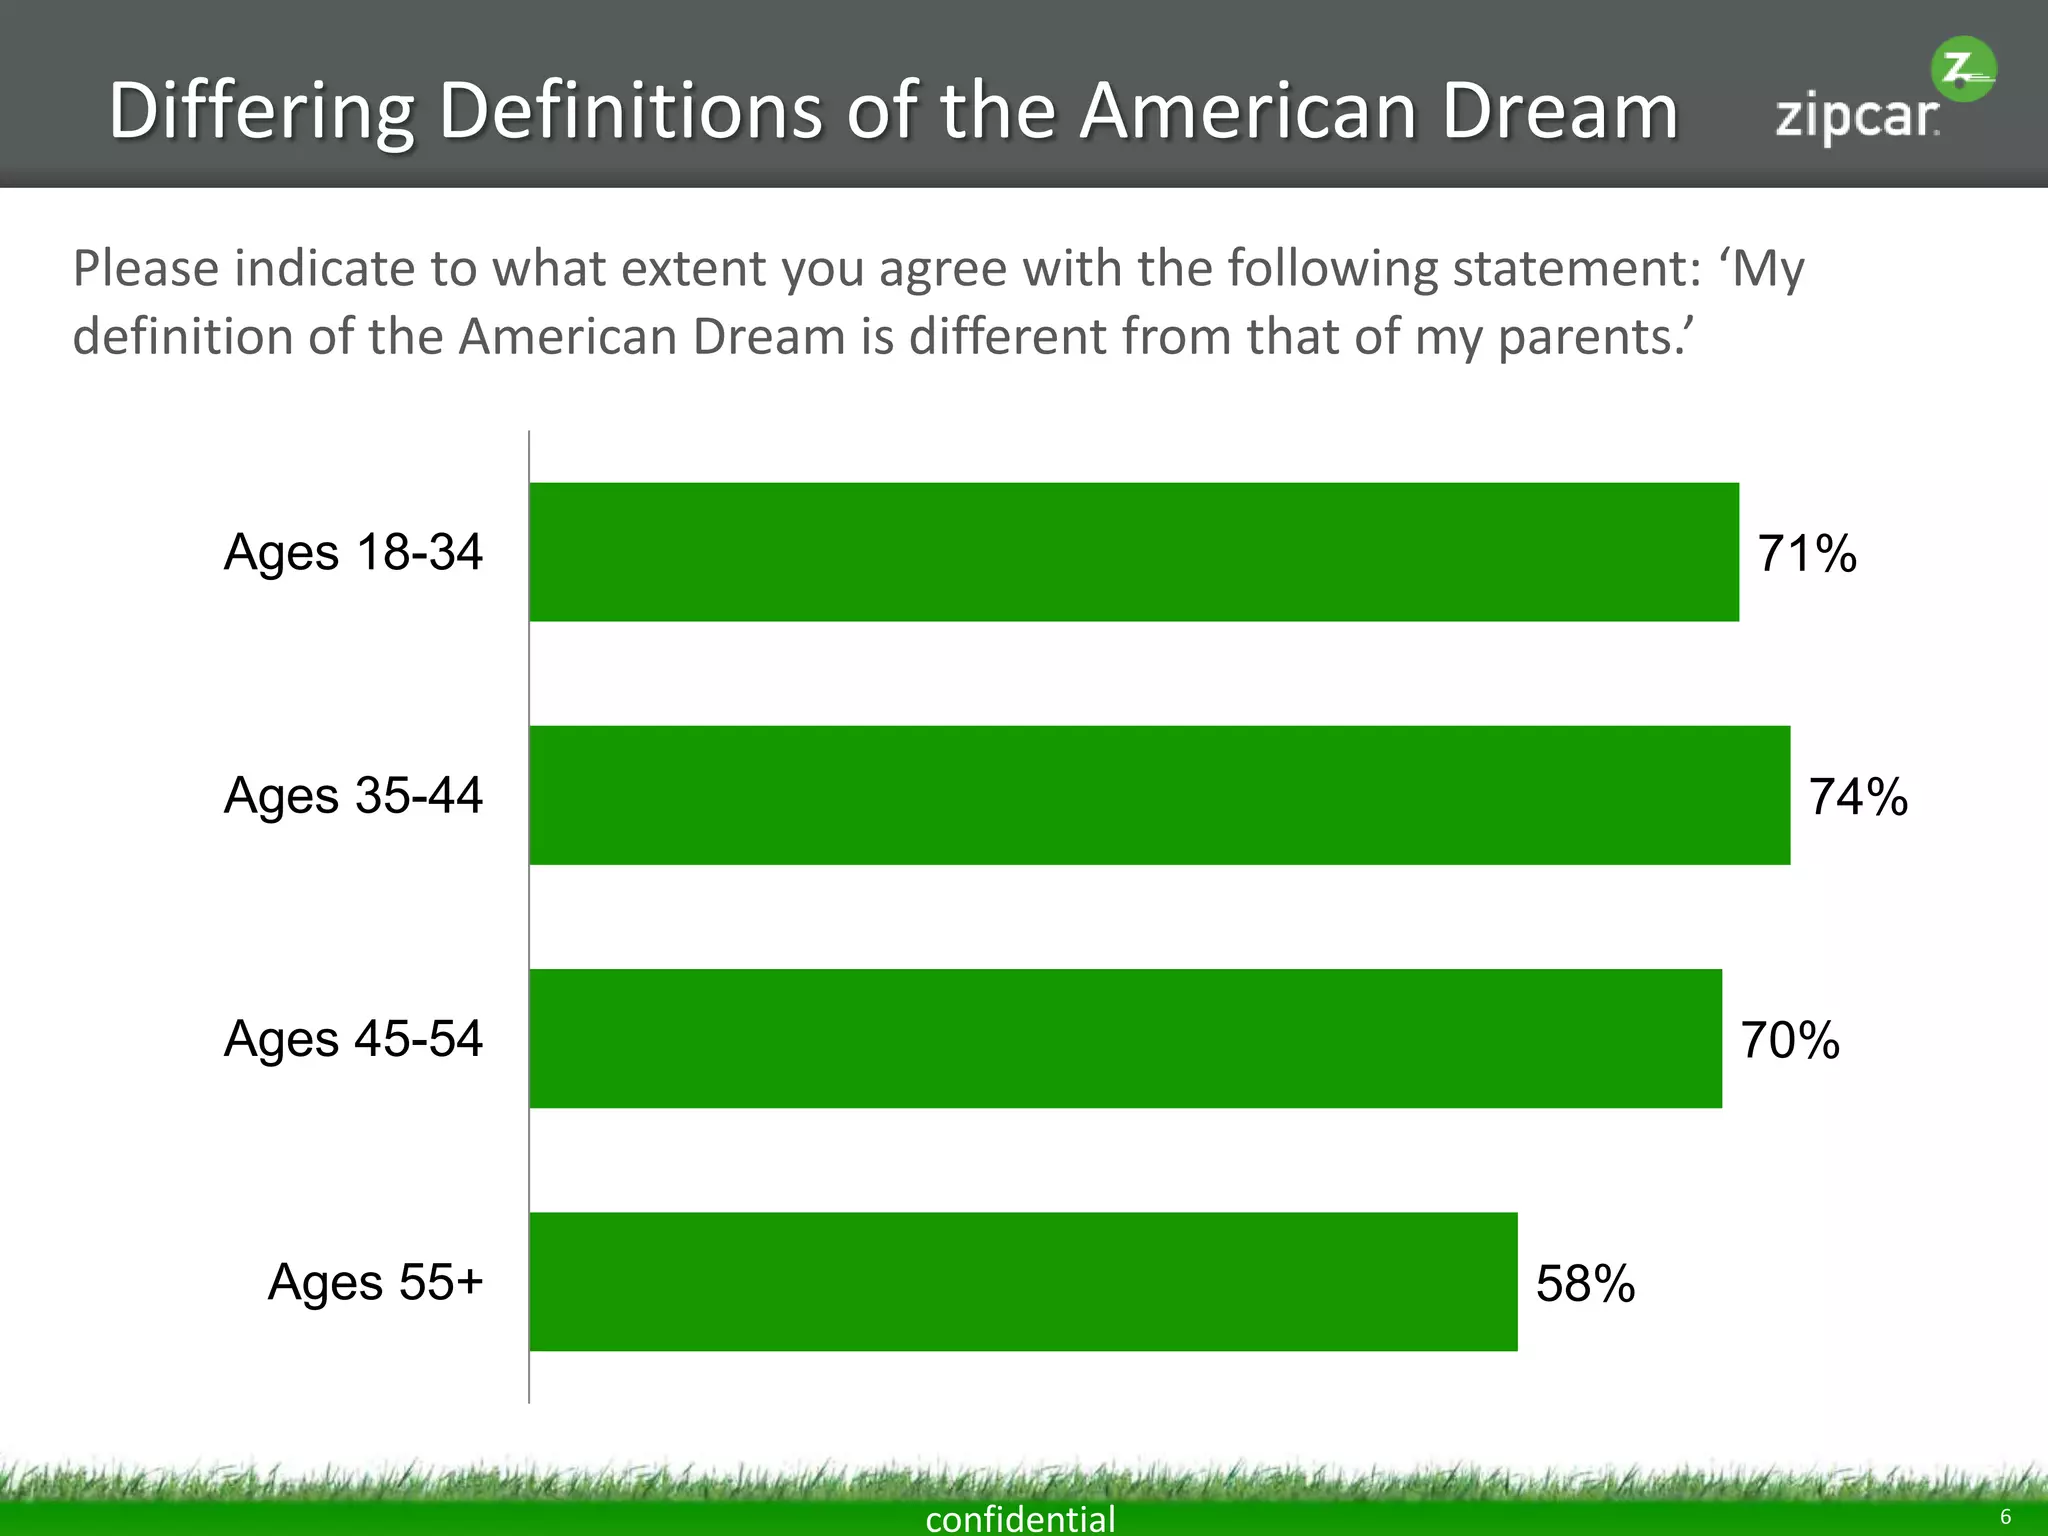
- Millennials value experiences over possessions similarly to older groups, though 71% think their American Dream definition differs from parents'
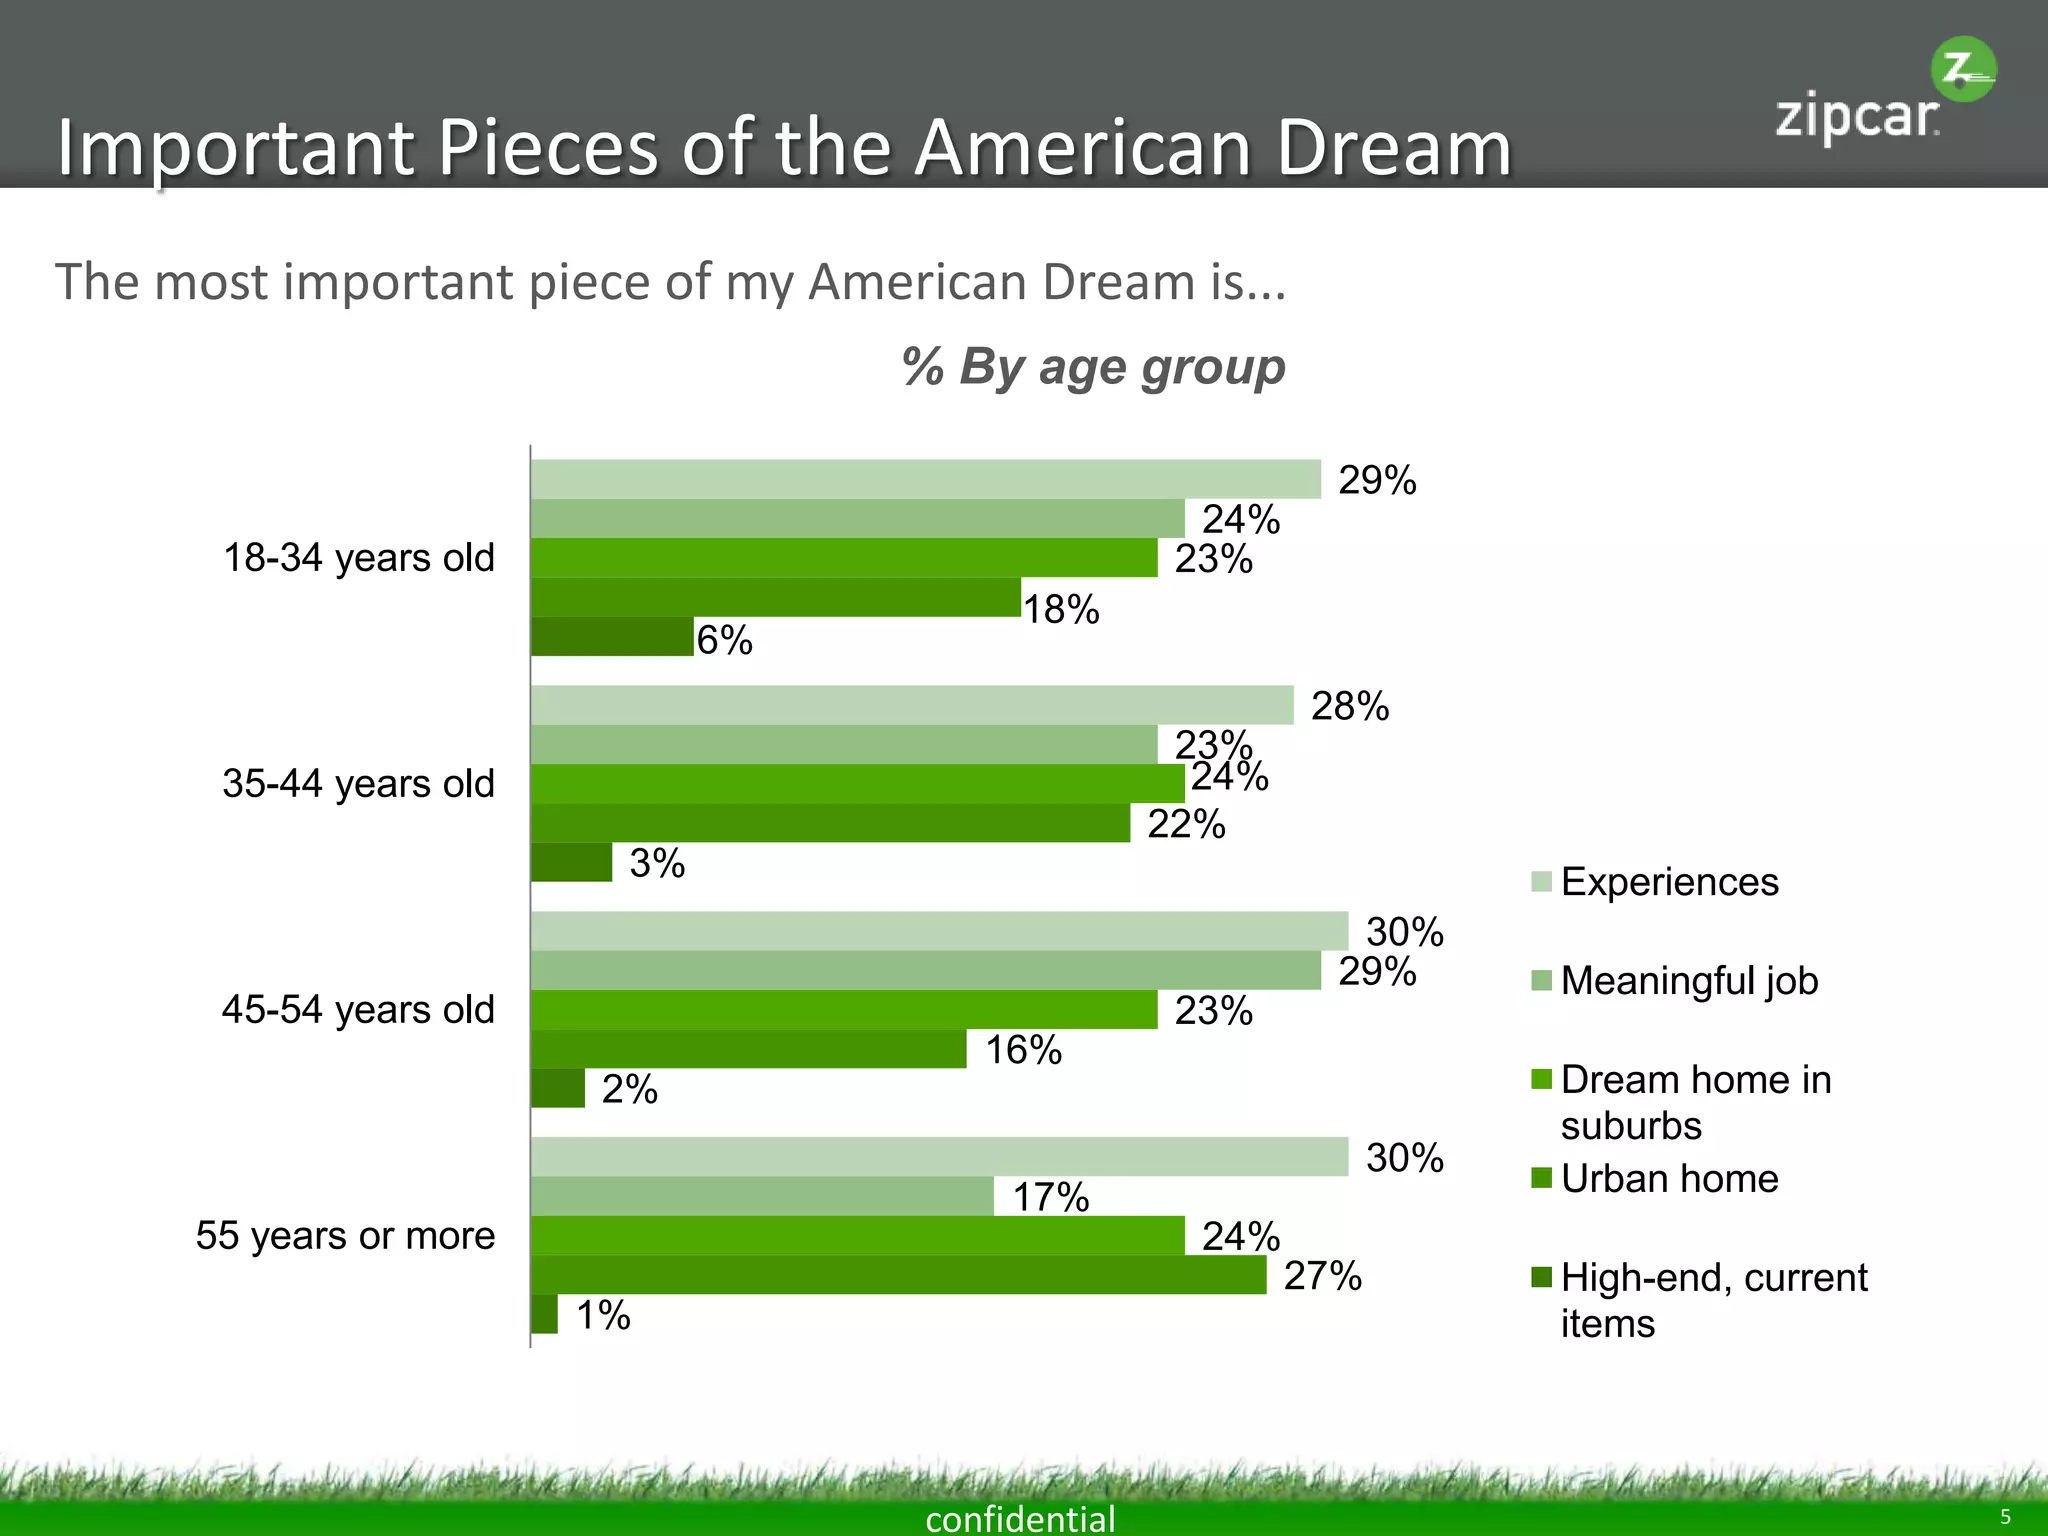
- Top American Dream elements for millennials are experiences (29%) and meaningful jobs (23%) rather than homes or possessions
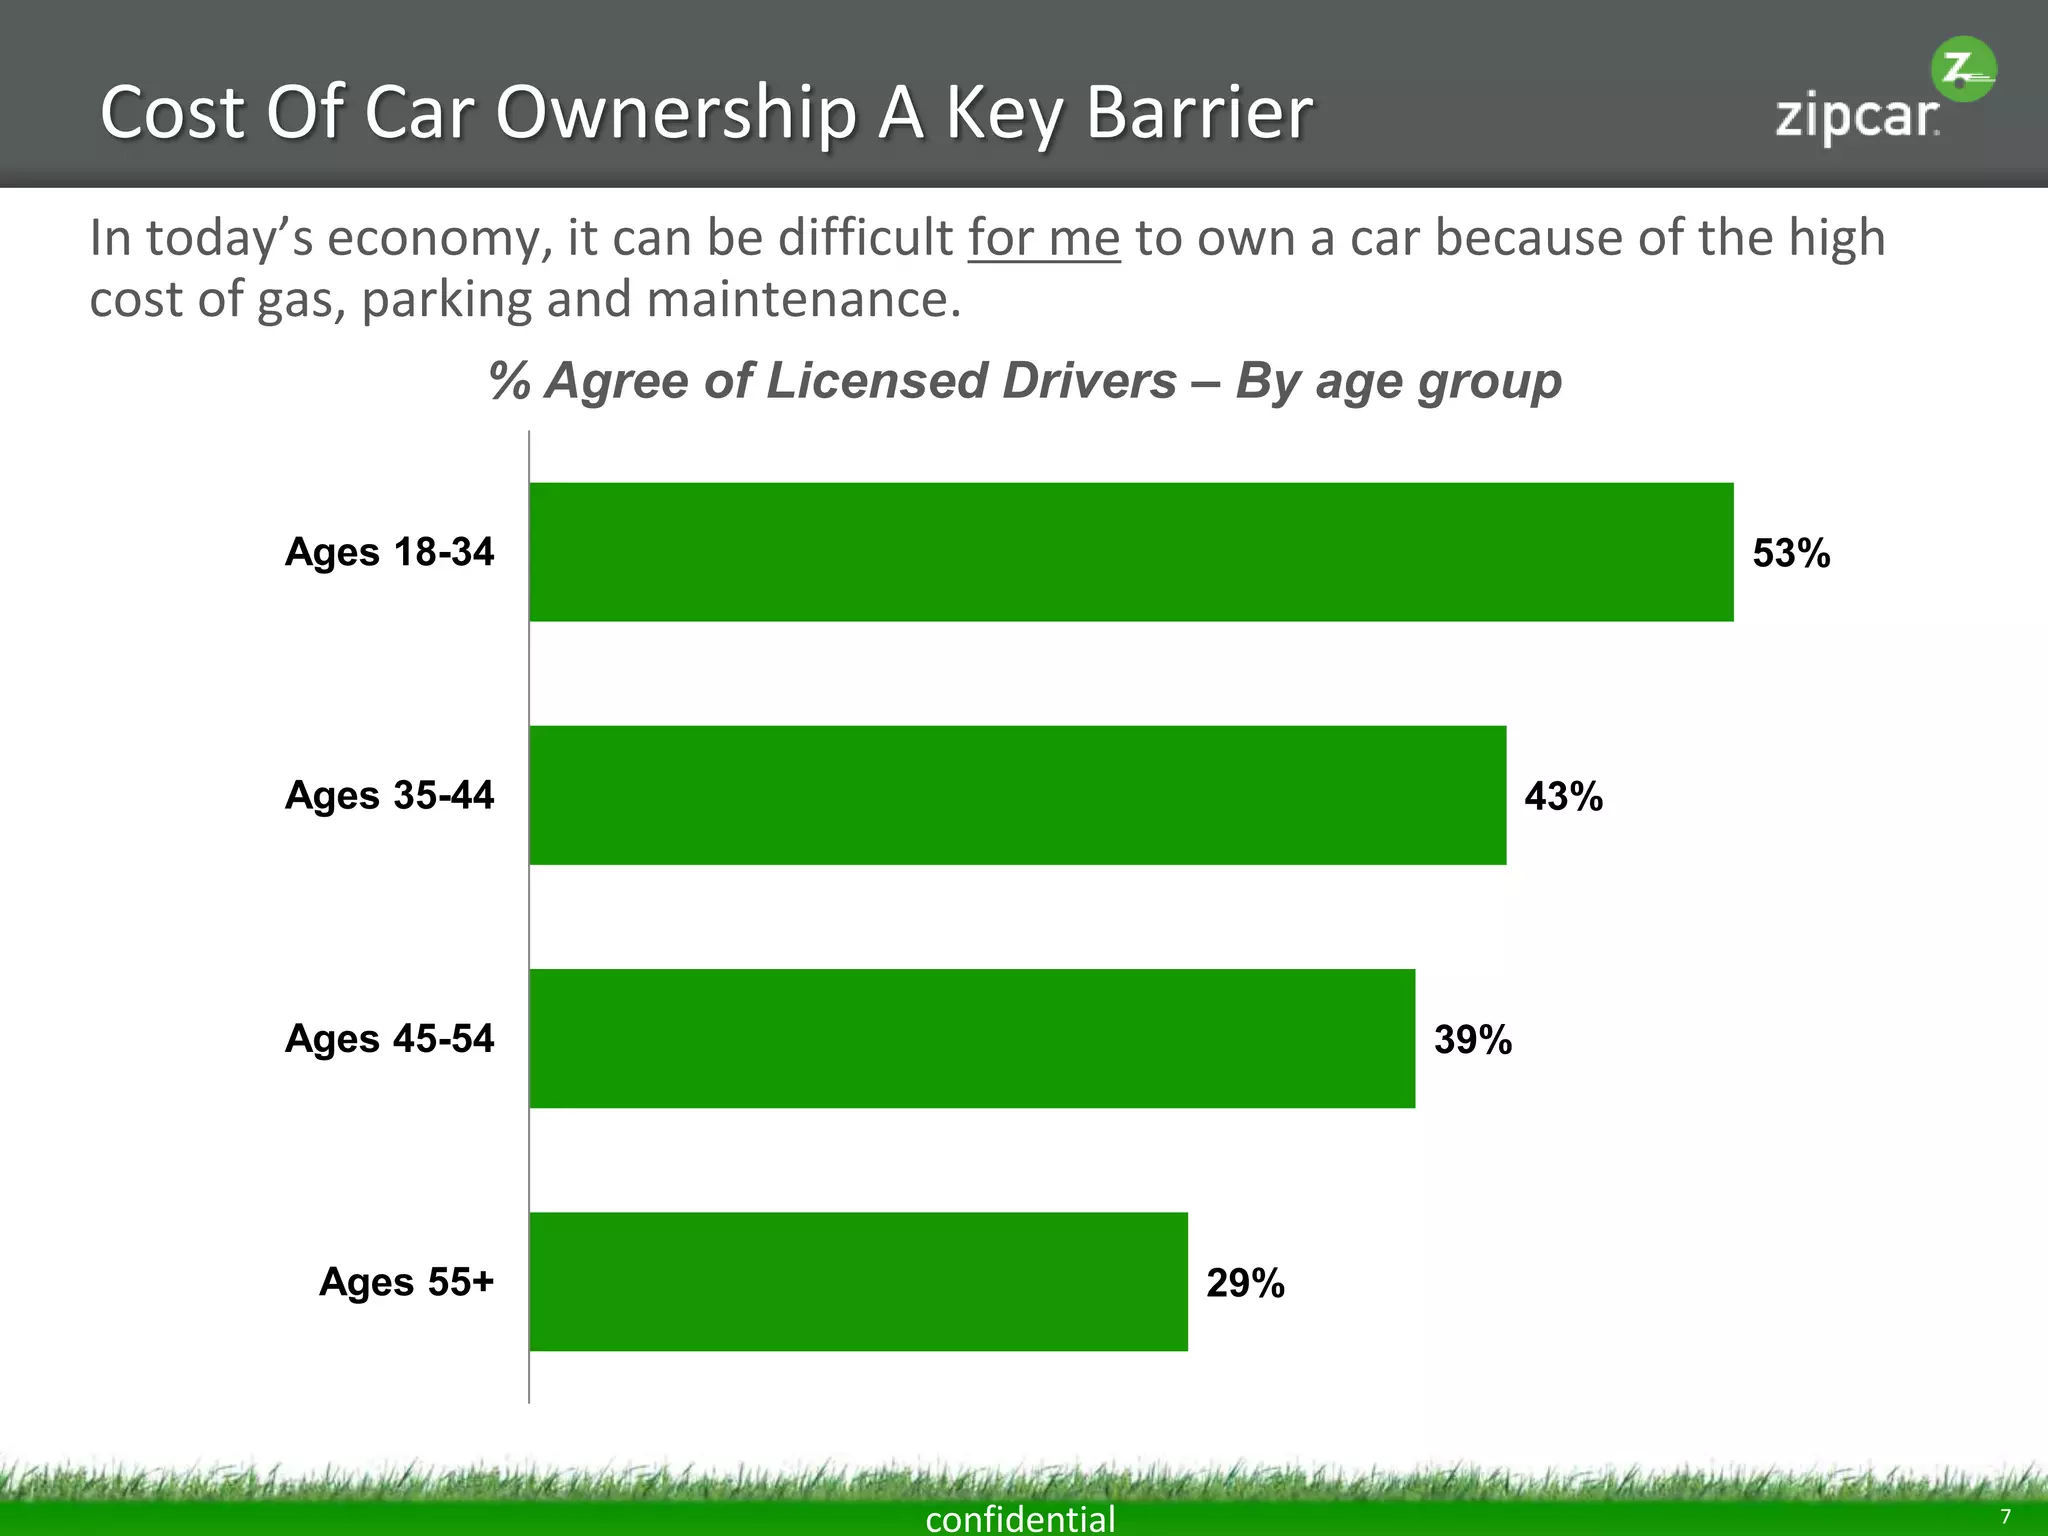
- 53% of millennials say high car costs make ownership difficult compared to 29% of those 55+
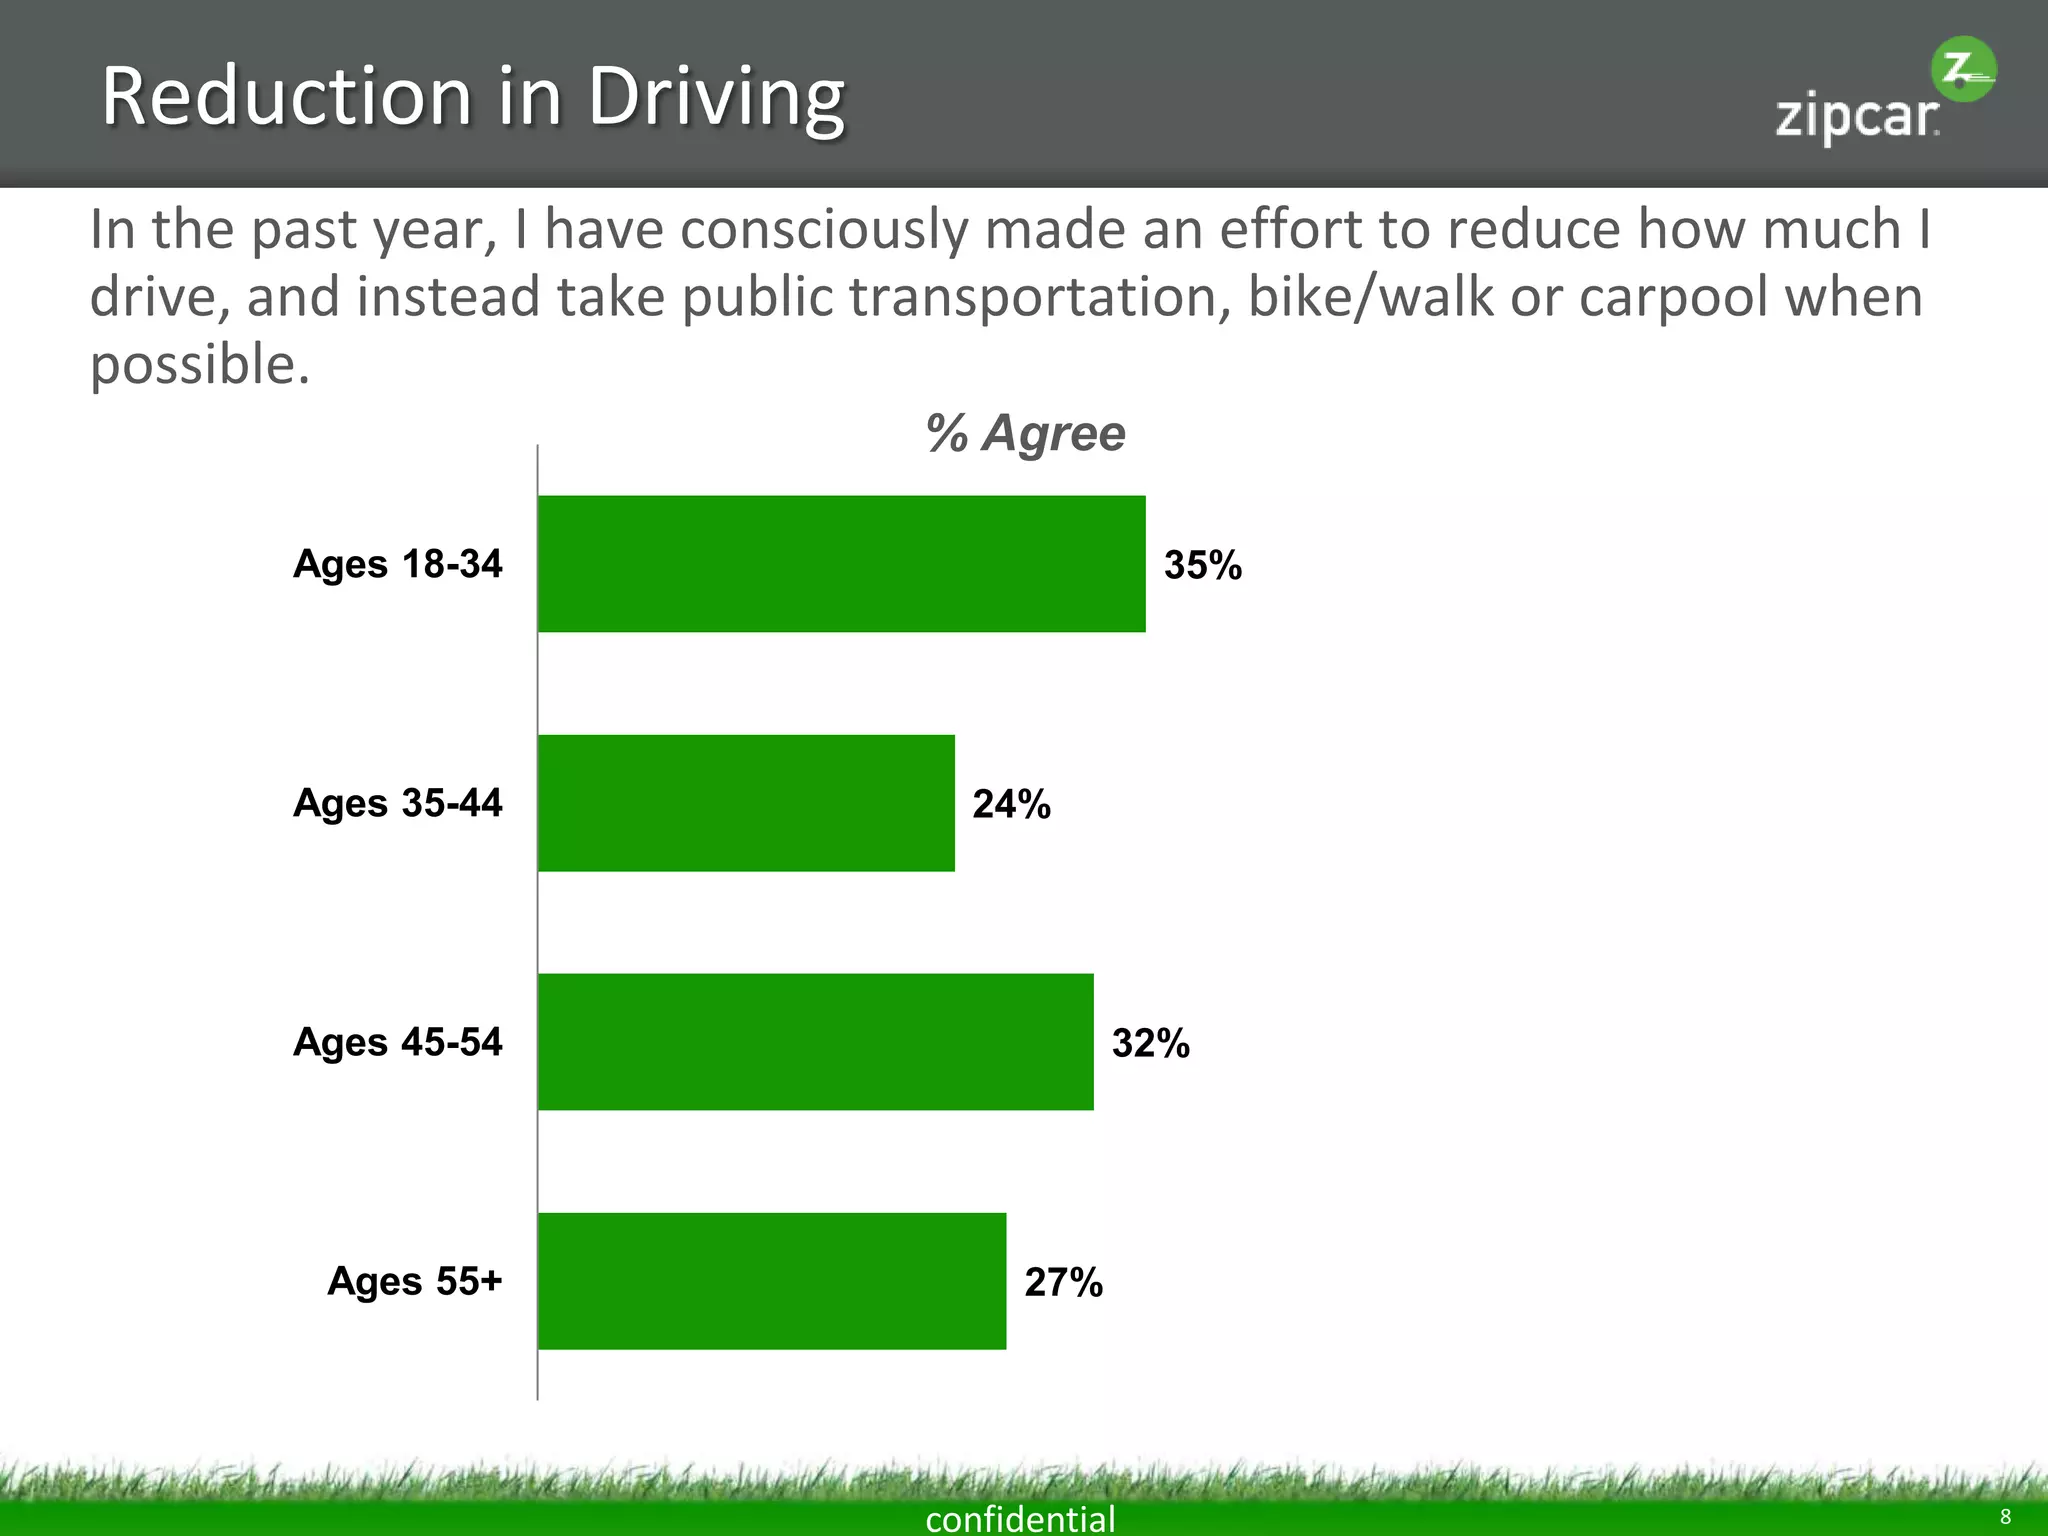
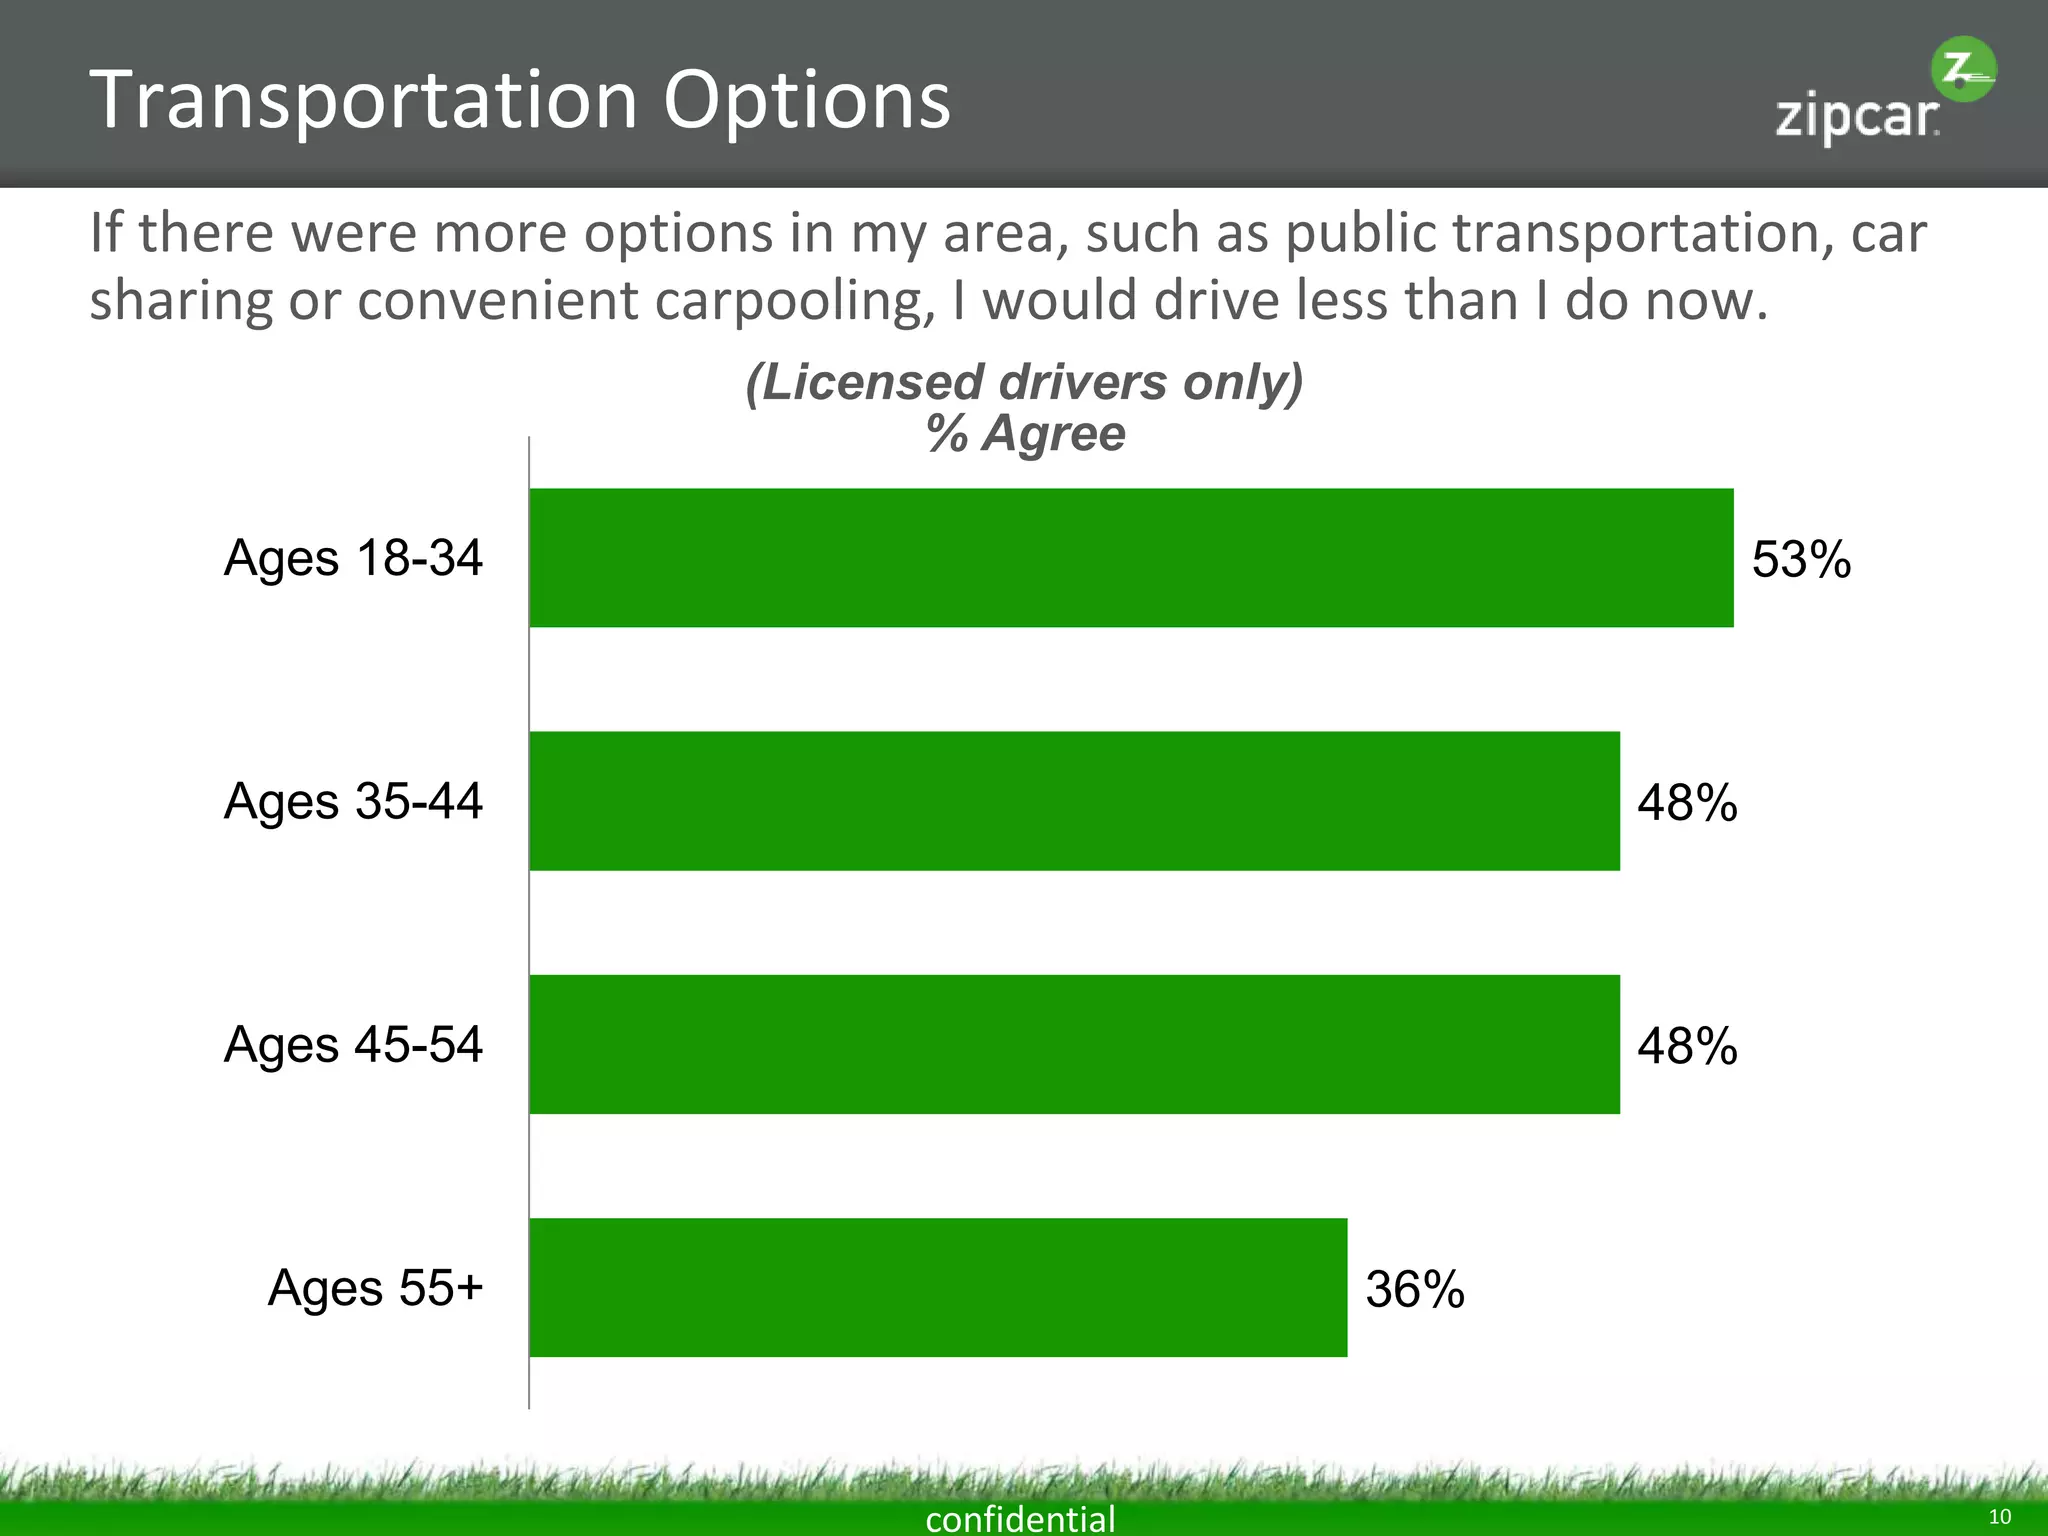
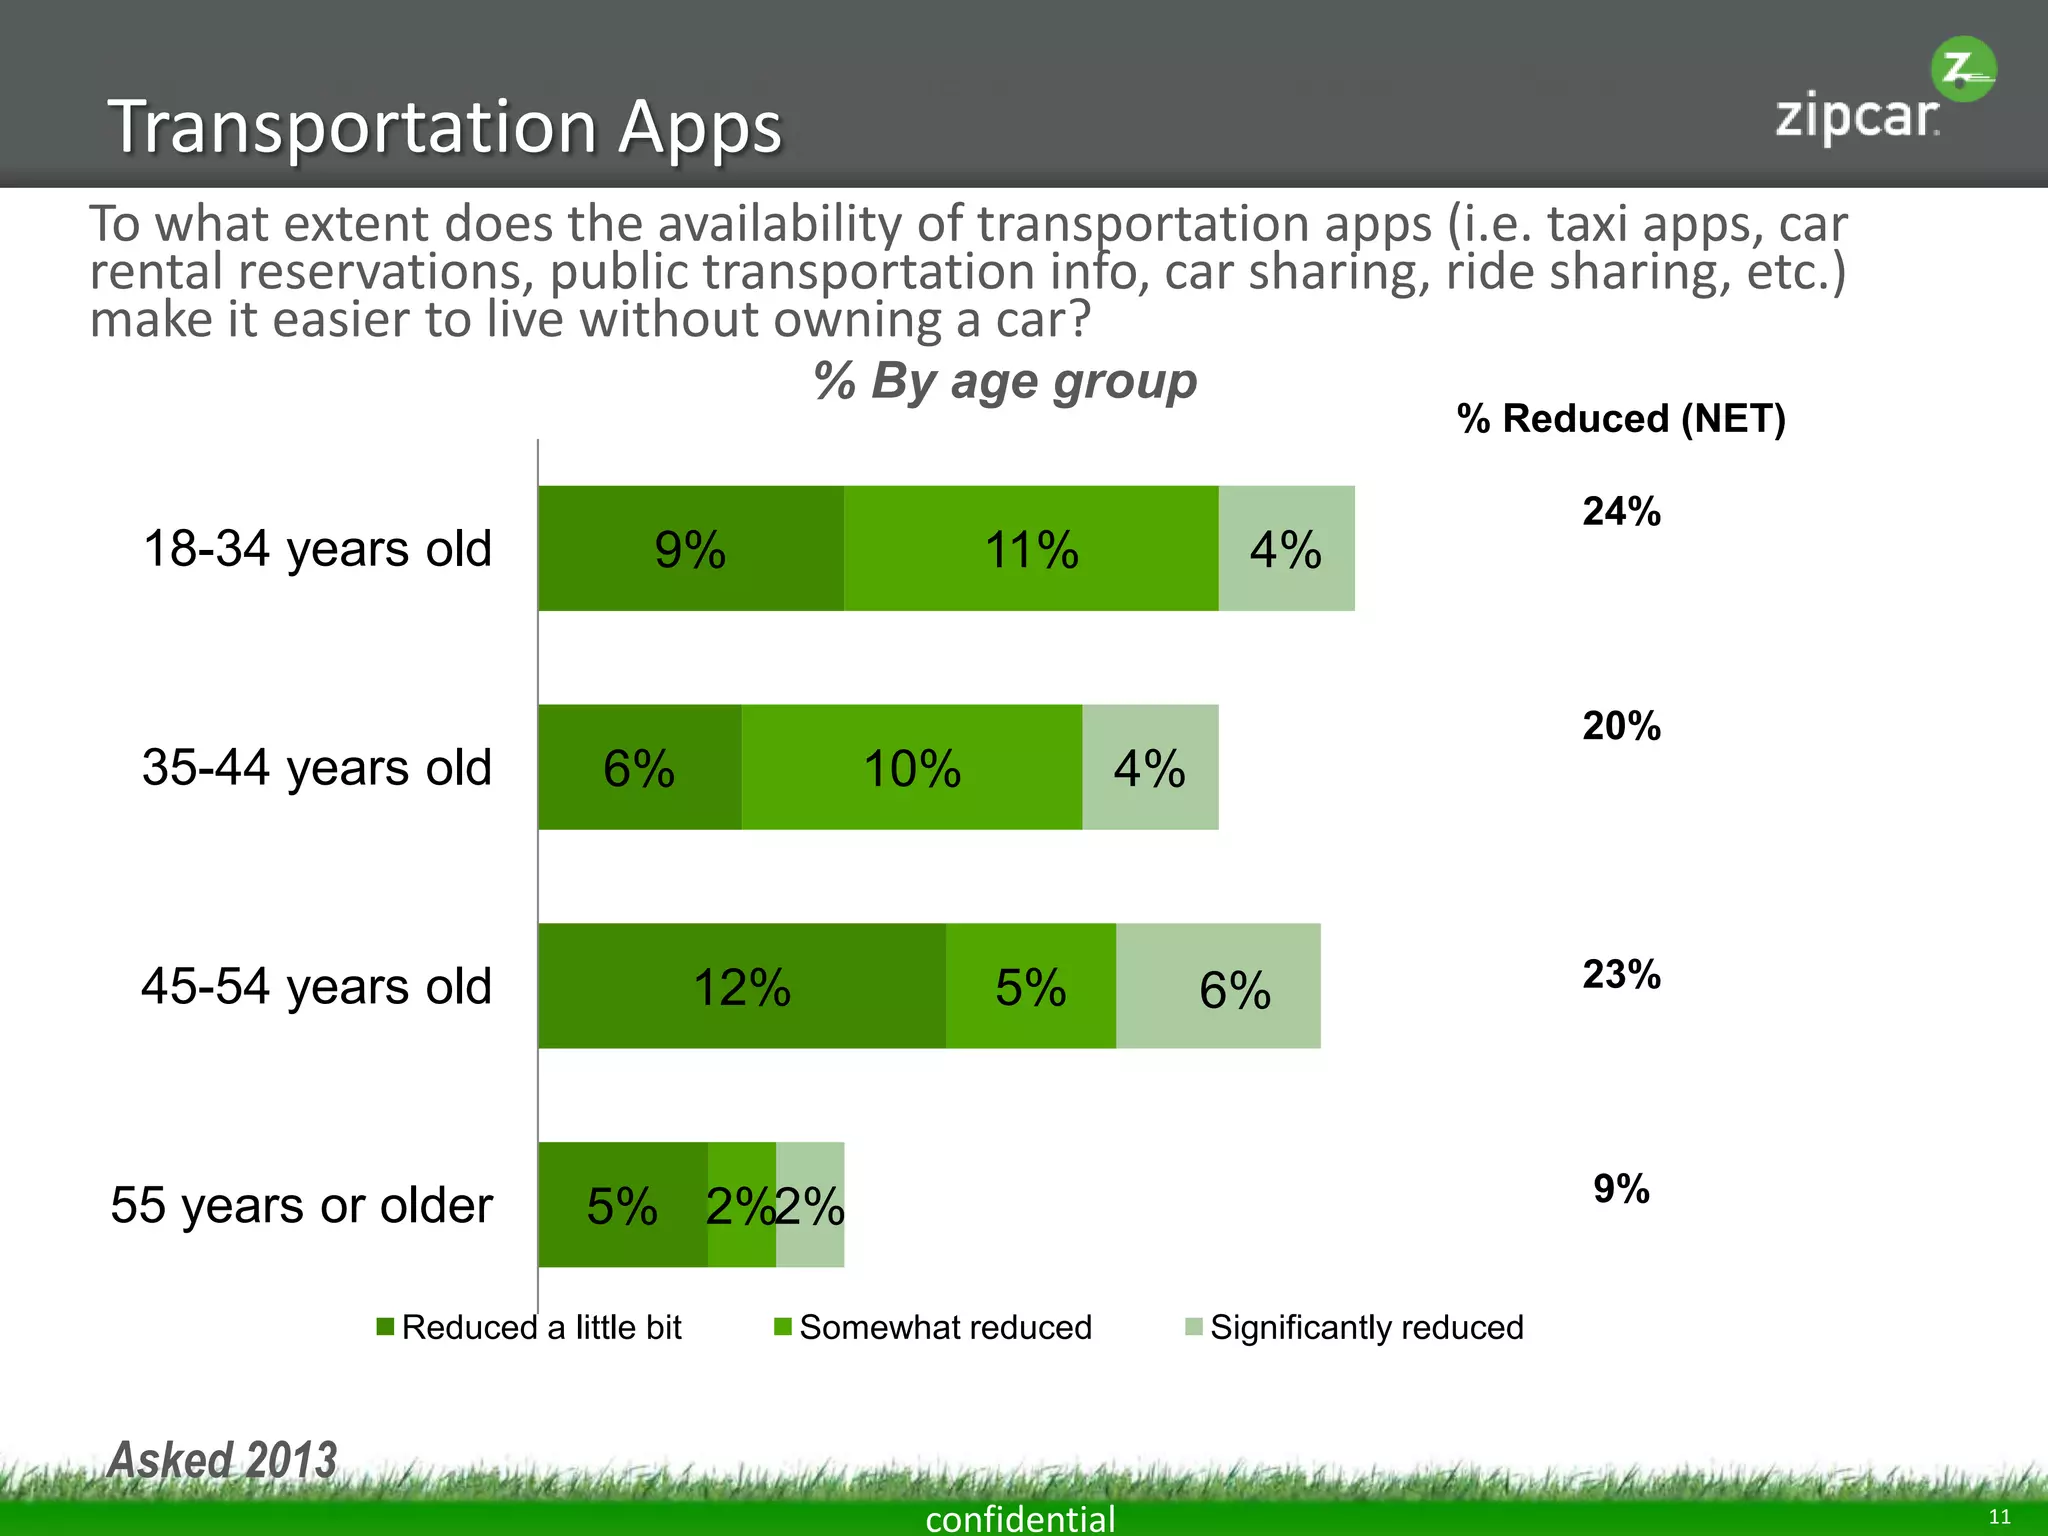
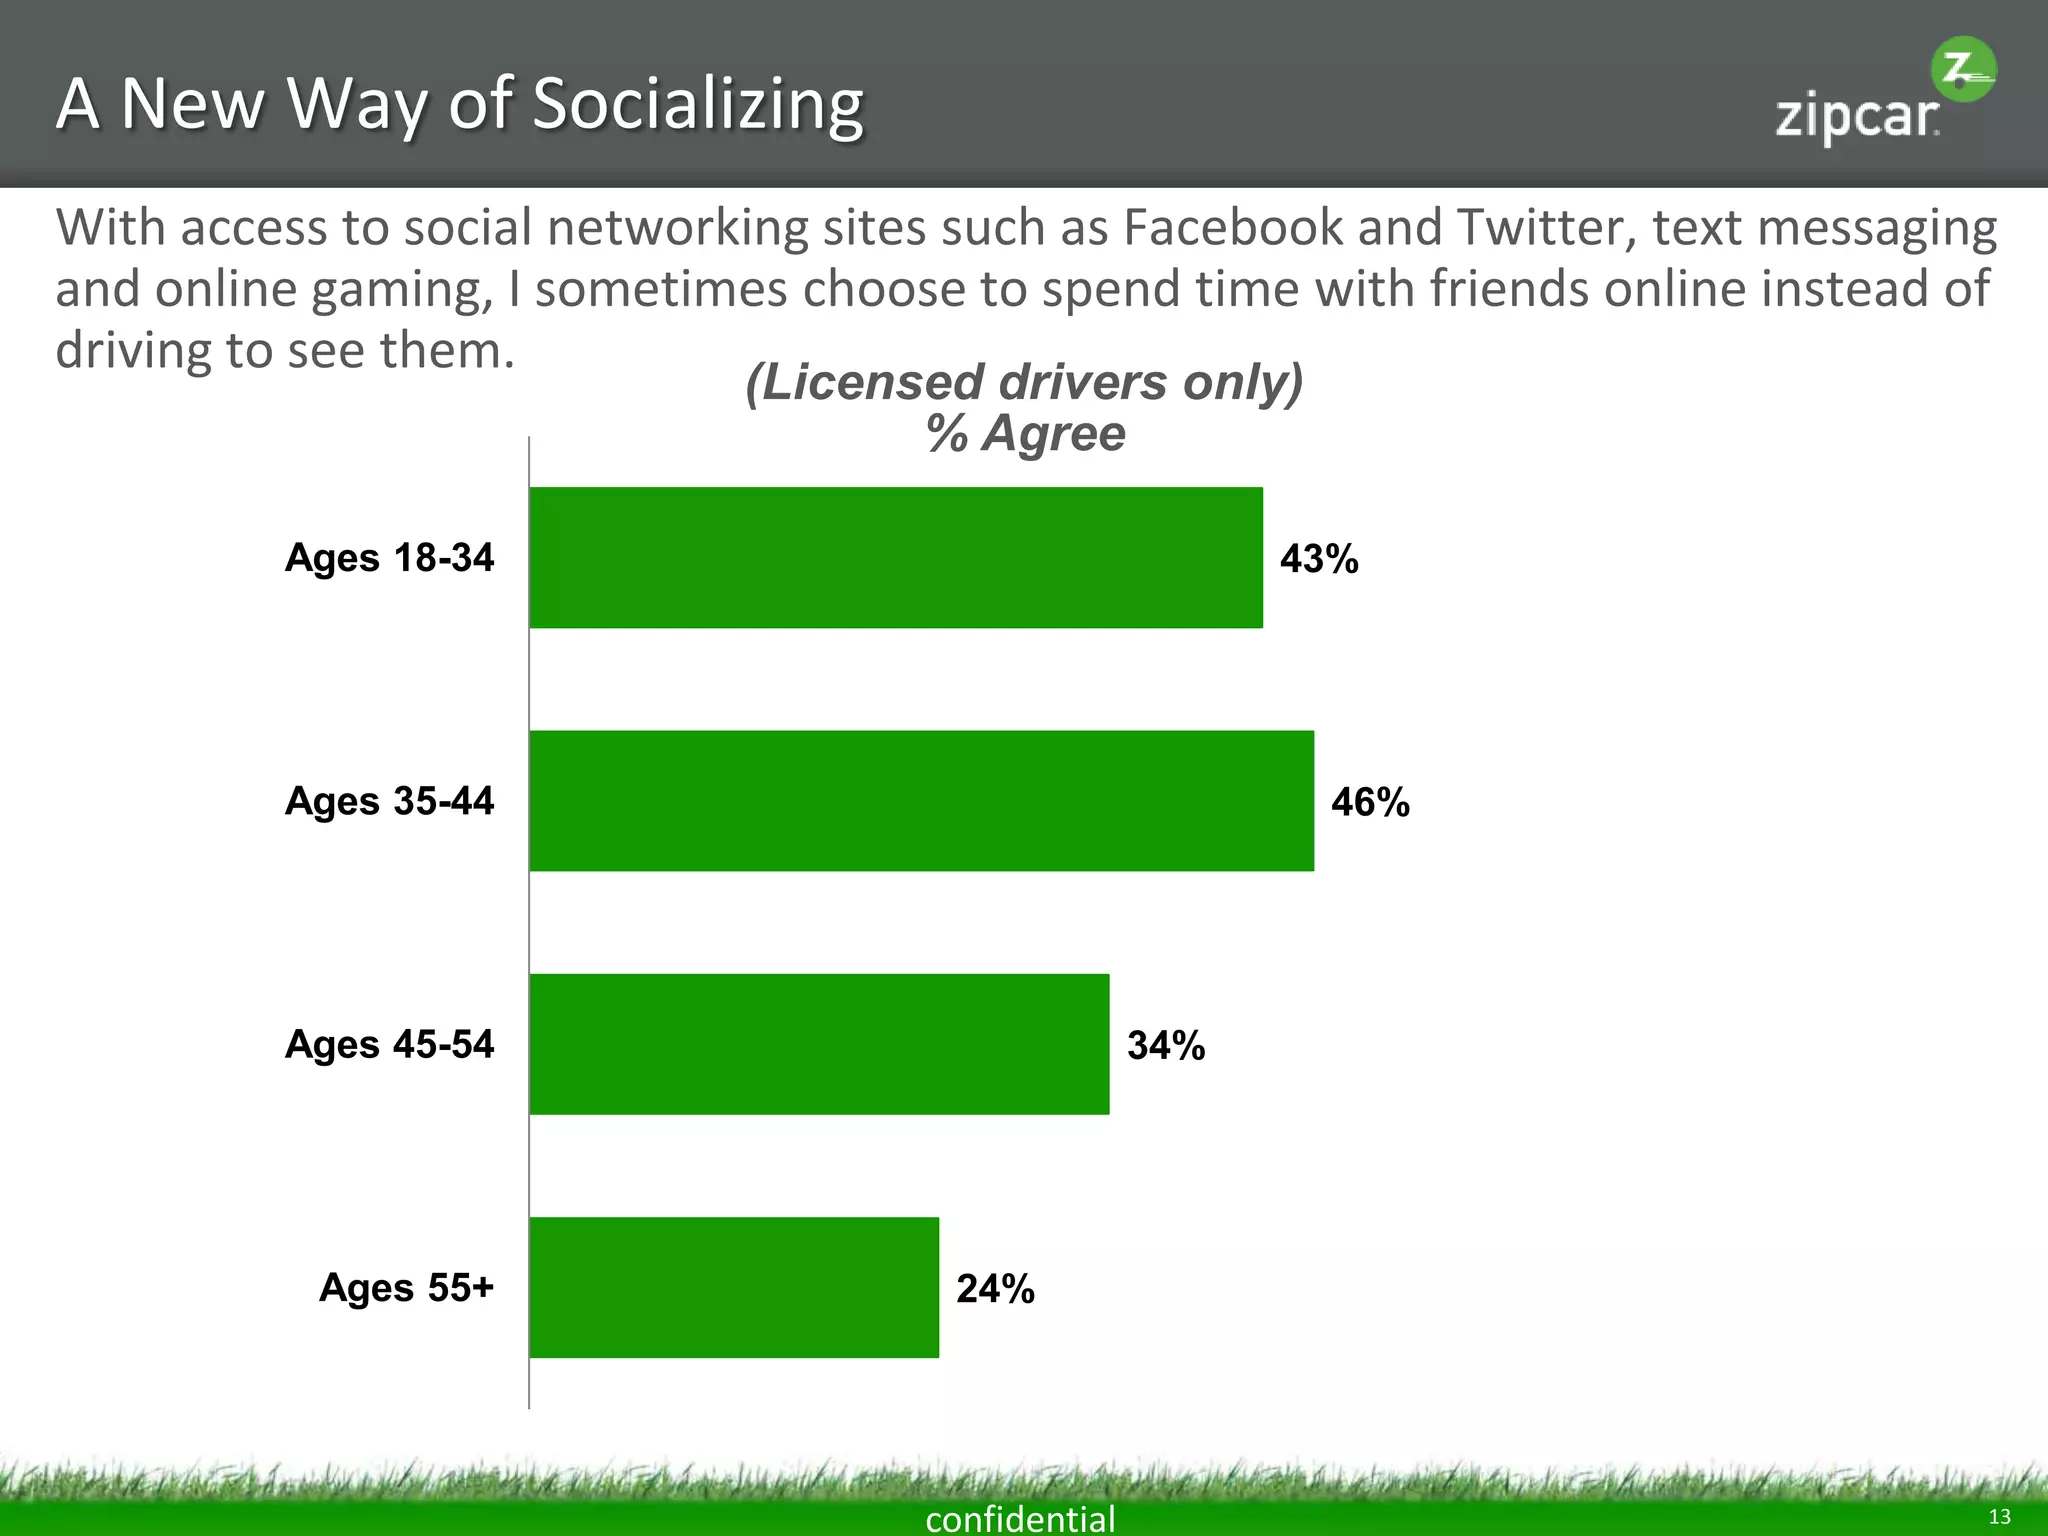
- Millennials are more likely than older groups to reduce driving, take transportation apps/public transit, and socialize online instead of driving to see friends
![Millennials & the “New
American Dream”
A Survey Commissioned by Zipcar
January 2014
[1]](https://image.slidesharecdn.com/millennials2013slideshare2-140123162531-phpapp01/75/Millennials-and-the-American-Dream-1-2048.jpg)