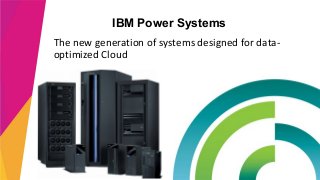
A listing of Power Systems announcements including: Power servers, AIX, Linux, ... New Power Systems with POWER8 and a growing open server ecosystem .http://bit.ly/1GgtYEP
28. Because the speed of business is money
BIG DATA & ANALYTICS
Héctor Colmenares, IBM SW
Core Database Competitive Sales Leader, IM SPGI
hector.colmenares@es.ibm.com
Key Message: Shifts in the marketplace resulted in a change to our strategy. We’ve been on a journey to reposition Power Systems and have been changing the perceptions of Power. As part of that, we’ve been making investments during the last 12 months.
• We’ve made a number of strategic investments and clients have responded favorably.
We continue to be the ideal platform for IBM Watson; we’ve helped form the OpenPOWER Foundation and are helping to guide its rapid expansion; we announced a new set of scale-out Power Systems; and we are growing our presence in cloud in a big way – with a focus on hybrid.
Clients have been waiting for an alternative to x86, and this is what we’re delivering with the new scale-out systems
Scale-up Systems are coming soon.
NoSQL:
Column or Distributed Data Store: Tuple of column name, value, timestamp
Document: Designed for storing, retrieving and managing document-oriented information
Key-value or Associative Array: Collection of (unique) key, value pairs
Graph: Structure with nodes, edges and properties to represent and store data
“Today we are going to show you a revolutionary technology that we think is going to change the way services are consumed on the cloud.”
“We all know the prevalence of NoSQLs and there seems to be flavors for every task at hand. For example, if you need large massive data storage there is hadoop. If you need lightning quick response time there is in memory redis. However, there deosn’t seem to be a way to combine the lightning quickness with massive capacity. Well, today we have a technology in out POWER 8 Systems that introduces a new tier of memory. This new tier lets our POWER 8 System perform like they are stacked with TBs of memory.”
Launched last year ... The OpenPOWER Foundation is an open development community collaborating together to leverage POWER's open architecture for broad industry innovation. There are currently 57 members with membership continuing to grow globally with latest additions from Australia, Europe, India, Brazil and a continued strong interest from China with 11 members.
-- Ecosystem has multiple elements: ISVs, middleware, universities, and there are key regional dynamics to consider
-- OpenPOWER has created a rapidly expanding ecosystem, with partners at all levels in the stack
-- Seeing strong growth in ecosystem around Power
CLIENT VALUE
Increased system scale
Increased performance per-core
Up to 20 VMs per-core
Enterprise RAS
Increased energy efficiency
Elastic Capacity on Demand
Share resources in Power Enterprise Pool
Enhanced Serviceability: Slide rails and Blind Swap I/O adapters
IBM Power System E870 on the two-tier SAP SD standard application benchmark running SAP enhancement package 5 for the SAP ERP 6.0 application; 8 processors / 80 cores / 640 threads, POWER8; 4.19GHz, 2048GB memory, 79,750 SD benchmark users, running AIX® 7.1 and DB2® 10.5, dialog response: 0.97 seconds, line items/hour:8,722,000, dialog steps/hour: 26,166,000 SAPS: 436,100 database response time (dialog/update): 0.013 sec / 0.026 sec, CPU utilization: 99%, Certification #: 2014034 Results valid as of 10/3/14. Source: http://www.sap.com/benchmark.
IBM System x3950 on the two-tier SAP SD standard application benchmark running SAP enhancement package 5 for the SAP ERP 6.0 application; 8 processors / 120 cores / 240 threads, Intel Xeon Processor E7-8890 v2; 2.80GHz, 1024GB memory, 49,000 SD benchmark users, running Windows Server 2012 Standard Edition and DB2® 10, dialog response: 0.85 seconds, line items/hour: 5,421,670, dialog steps/hour: 16,265,000 SAPS: 271,080; database response time (dialog/update): 0.0083 sec / 0.022 sec, CPU utilization: 98%, Certification #: 2014024 Results valid as of 10/3/14. Source: http://www.sap.com/benchmark.
Fujitsu PRIMEQUEST 2800E on the two-tier SAP SD standard application benchmark running SAP enhancement package 5 for the SAP ERP 6.0 application; 8 processors / 120 cores / 240 threads, Intel Xeon Processor E7-8890 v2; 2.80GHz, 1024GB memory, 49,000 SD benchmark users, running Windows Server 2012 Standard Edition and SQL Server 12, dialog response: 0.97 seconds, line items/hour: 5,193,670, dialog steps/hour: 15,581,000 SAPS: 259,680; database response time (dialog/update): 0.015 sec / 0.030 sec, CPU utilization: 99%, Certification #: 2014003 Results valid as of 10/3/14. Source: http://www.sap.com/benchmark.
(5) Oracle SPARC Server T5-8 on the two-tier SAP SD standard application benchmark running SAP enhancement package 5 for the SAP ERP 6.0 application; 8 processors/128 cores/1024 threads, SPARC T5; 3.60 GHz, 2,048 GB memory; 40,000 SD benchmark users, running Solaris® 11 and Oracle 11g; Certification # 2012013008. Results valid as of 10/3/14. Source: http://www.sap.com/benchmark.
SAP and all SAP logos are trademarks or registered trademarks of SAP AG in Germany and in several other countries. All other product and service names mentioned are the trademarks of their respective
Designed to eliminate planned and unplanned downtime for the most demanding workloads
Shift resources to support planned maintenance
Active – Active for efficient HA / DR
Seamless transition to new technology
Easily manage the changing workload demands of today’s dynamic, real time business environment.
Elastic Capacity on Demand
Move virtual processor and memory resources to address new demands without physically reconfiguring the data center
Leadership IT EfficiencyCombining the economic efficiency of Elastic Cloud pricing with systems designed for 80-90% utilization
Usage and utility based pricing
Minimize excess capacity required to manage availability and contingency for dynamic business environments
Ready for the Future Seamlessly integrate next generation technology in your Power Enterprise Pool
Inactive resources are used for processor and memory sparing
Inactive resources can be used for free trials of new applications
Inactive resources can be used with temporary activations for emergency backup
Midrange and Entry are one through four socket systems
La realidad es que vivimos en el mundo de la inmediates, el ahora ya es tarde, la movilidad, los sensores, adelantarnos, predecir es lo que marca la endencia pero en donod eencaja el bigdata?
Obviously, there are many other forms of data. Let’s start with the hottest topic associated with Big Data today: social networks. Twitter generates about 12 terabytes a day of tweet data – which is every single day. Now, keep in mind, these numbers are hard to keep accurate, so the point is that they’re big, right? So don’t fixate on the actual number because they change all the time and realize that even if these numbers are out of date by 2 years, it’s at a point where it’s too staggering to handle exclusively using traditional approaches.
+CLICK+
Facebook over a year ago was generating 25 terabytes of log data every day (Facebook log data reference: http://www.datacenterknowledge.com/archives/2009/04/17/a-look-inside-facebooks-data-center/
) and probably about 7 to 8 terabytes of data that goes up on the Internet.
+CLICK+
Google, who knows? Look at Google Plus, YouTube, Google Maps, and all that kind of stuff. So that’s the left hand of this chart – the social network layer.
+CLICK+
Now let’s get back to instrumentation: there are massive amounts of proliferated technologies that allow us to be more interconnected than in the history of the world – and it just isn’t P2P (people to people) interconnections, it’s M2M (machine to machine) as well. Again, with these numbers, who cares what the current number is, I try to keep them updated, but it’s the point that even if they are out of date, it’s almost unimaginable how large these numbers are. Over 4.6 billion camera phones that leverage built-in GPD to tag your location or your photos, purpose built GPS devices, smart metres. If you recall the bridge that collapsed in Minneapolis a number of years ago in the USA, it was rebuilt with smart sensors inside it that measure the contraction of the concrete based on weather conditions, ice build up, and so much more.
So I didn’t realise how true it was when Sam P launched Smart Planet: I thought it was a marketing play. But truly the world is more instrumented, interconnected, and intelligent than it’s ever been before and this capability allows us to address new problems and gain new insight never before thought possible and that’s what the Big Data opportunity is going to be all about!
Big data comes from many sources. Its much more than traditional data sources. And it order to capitalize on the breakthrough opportunities we’ve discussed, you definitely need to look beyond traditional data sources. But at the same time, don’t forget that big data comes from those traditional sources too. Transactional data and application data is growing an a significant rate. Although it’s structured, that data is large and it is contained in many different structures.
Social data also needs to be incorporated. Most social data is really textual data. And the valuable insights remain locked within that text and its many possible meanings. And most of that data isn’t valuable, or has a very short expiry date during which it is valuable. That makes social data very challenging – extracting insight from largely textual content in very little time.
And enterprise content must be amalgamated as well. And that data comes in many forms, and also in significant volume.
Big data includes machine data – “the internet of things” – logs, web logs, instrumentation data, network data. Data generated by machines is multiplying quickly, and it contains valuable insights that need to be discovered.
These innovative solutions that we just talked about on the previous slide are comprised of different types of applications, each of which are best served by different types of data systems that are optimized specifically to each workload for speed, reliability and cost efficiency.
At the top we have the types of innovative applications you are deploying or want to deploy
and at the bottom is IBM’s DB2 10.5 with BLU Acceleration or Informix 12.1 capabilities that are optimized to handle them.
From a survey of over 4,500 executives, managers and analysts, from more than 30 industries in 122 countries, some key statistics have been uncovered, relating to Big Data and Analytics.
Businesses who use analytics, are 2.6 times more likely to outperform their competitors and achieve, on average, 1.6 times revenue growth, following implementation of an analytics solution.
And become 206% more likely to be one of the top performers in their industry, leading to as much as 2.5 times stock price appreciation.
Can any business afford to ignore these growth rates?
In essence if they are not implementing best of breed analytics solutions, they are falling behind their competitors, and loosing relevance in their marketplace, as they likely react too slowly to changes in market trends.
So lets look at How an optimized analytics solution, makes a difference to the bottom line.
And illustrate, how speed of business process, equals money.
A study done by SAP, looked at how long companies take to complete their monthly financial close of their accounts
Looking at the average of the worst performing customers, they take 22 days, to close their books.
By contrast, the average of the best performing customers, they take just 7 days to close their books.
<click>
If we put that into business terms, here is an example of a report generated by XERO one of the fastest growing SaaS companies globally, specialising in Accounting software , they analysed 16 million invoices from thousands of businesses totalling £20 billion and reported that by increasing the speed of invoicing companies were seeing a 39% improvement in the number of days it was taking to get paid. Reducing the number of days to payment has increased their cashflow and has lead to business growth
So here we truly see how speed of business process, is about money.
Doing things better is important, understanding the business better is important, but doing those things faster, is delivering business growth by improving cash flow.
BLU Acceleration is a game changing combination of innovations from IBM Research and Development Labs that dramatically simplifies and speeds the delivery of business insight from data. Easy to set up and self optimizing, BLU Acceleration eliminates the need for indexes, aggregates, or time consuming database tuning to achieve top performance and storage efficiency.
With next generation In-memory capabilities, BLU Acceleration can deliver the performance of in-memory processing without the cost or limitations of in-memory only systems. BLU Acceleration does not require all data to fit in memory in order to achieve breakthrough performance. The system has the efficiency and intelligence of keeping the most relevant data in memory to maximize performance – optimizing both system memory and CPU memory (known as cache). This means, as data volumes grow, clients do not need to continuously buy expensive memory.
Columnar organized BLU tables are well suited for compression because of their similar, common, and repeating data in each column – which is optimized by encoding frequent values with fewer bits. The patented encoding technology of BLU Acceleration’s Compression preserves the order of the data, enabling compressed data in BLU tables to be used without decompressing it. Furthermore, the encoded values are packed into bits matching the register width of the CPU – for reduced I/O, and better CPU and memory utilization. As a result of the very high levels of compression (clients report 10x compression) and elimination of indexes and aggregates, BLU Acceleration significantly reduces the need for storage. These storage savings result in cost saving on multiple fronts: e.g., hardware, power, and maintenance.
BLU Acceleration is designed to take full advantage of the latest innovations in microprocessor advancements. With SIMD processing (Single Instruction Multiple Data), BLU Acceleration can apply a single instruction to many data elements simultaneously, for faster data processing. BLU Acceleration is as designed to take advantage of multiple cores for maximum core utilization.
BLU Acceleration automatically detects large sections of data that don’t qualify for a query – and skips the unnecessary processing of this irrelevant data. E.g. skipping all the records prior to 2010 for a question about data from 2010 to the present.
This is done with automatically maintained metadata that users do not have to worry about defining or maintaining. Data skipping can deliver vast savings across compute resources (CPU, RAM, and I/O).
Obviously, there are many other forms of data. Let’s start with the hottest topic associated with Big Data today: social networks. Twitter generates about 12 terabytes a day of tweet data – which is every single day. Now, keep in mind, these numbers are hard to keep accurate, so the point is that they’re big, right? So don’t fixate on the actual number because they change all the time and realize that even if these numbers are out of date by 2 years, it’s at a point where it’s too staggering to handle exclusively using traditional approaches.
+CLICK+
Facebook over a year ago was generating 25 terabytes of log data every day (Facebook log data reference: http://www.datacenterknowledge.com/archives/2009/04/17/a-look-inside-facebooks-data-center/
) and probably about 7 to 8 terabytes of data that goes up on the Internet.
+CLICK+
Google, who knows? Look at Google Plus, YouTube, Google Maps, and all that kind of stuff. So that’s the left hand of this chart – the social network layer.
+CLICK+
Now let’s get back to instrumentation: there are massive amounts of proliferated technologies that allow us to be more interconnected than in the history of the world – and it just isn’t P2P (people to people) interconnections, it’s M2M (machine to machine) as well. Again, with these numbers, who cares what the current number is, I try to keep them updated, but it’s the point that even if they are out of date, it’s almost unimaginable how large these numbers are. Over 4.6 billion camera phones that leverage built-in GPD to tag your location or your photos, purpose built GPS devices, smart metres. If you recall the bridge that collapsed in Minneapolis a number of years ago in the USA, it was rebuilt with smart sensors inside it that measure the contraction of the concrete based on weather conditions, ice build up, and so much more.
So I didn’t realise how true it was when Sam P launched Smart Planet: I thought it was a marketing play. But truly the world is more instrumented, interconnected, and intelligent than it’s ever been before and this capability allows us to address new problems and gain new insight never before thought possible and that’s what the Big Data opportunity is going to be all about!
An important consideration for your selling approach, is understanding that 63% of all opportunity now come from outside of IT.
Just think about that one. If you are only talking to, and selling to IT staff, you are only addressing, one third of IT based opportunities in your clients.
If you have only been focused on IT, you could now triple your opportunity scope, if you SELL into the line of business in your clients.
A perfect example of this recently, was a business who knew they had an issue with how long queries were taking to run on their database, and had attributed a cost to time wasted in waiting for a response.
IBM and a Business Partner ran a proof of concept with a UK customer, but we focussed on presenting the POC to the Managing Director, The Finance Director and the Chief Operating officer, all of them board members in this company. The POC was such a big improvement, their query time so improved, that initially the client thought IBM had manipulated the system. The finance director then spent 30 minutes running some ad hoc queries of his own, including a very complex query that completed in 97 secs, the FD told us that this was a report that they were never able to complete in their existing environment. In fact he said they stopped this query on their system because after several hours it still had not completed. The client was so impressed, that they ended the POC by saying “We’ll take it”.
The Client didn’t know what the solution was. They didn’t know what the hardware, software or services were. IBM and our partner had just fixed a business problem, and could do so at a cost that would pay back to the business in a few months. There was no discussion of how IBM’s hardware compared to a competitors. No going through a feeds and speeds check list, to see what solution was better on paper. Importantly, there wasn’t the same issue with price negotiation, as there was no competitive price to compare to.
This is the difference selling to line of business makes, talking about and solving business issues
<click>
So what we want to talk through in this session, is a different way of talking to clients.
We want to give them a “WOW”.
And in this example, we can talk through what difference a big data and analytics project, can make to a business. Its understanding of its business. How it can help identify new market opportunities, to help growth. Importantly, selling a business vision with a “WOW” factor.
<click>
Once we have the customer bought into the vision, excited at the prospect, we need to discuss, still from a business level perspective, “HOW” we can both enable AND deliver this difference to their business. Still with the focus on the business value, still not discussing features.
<click>
And then importantly, for our sellers, our partners, and for IT Staff that may be engaged by the business, “WHAT” hardware & software we are actually providing for this solution.
As the inverted triangle is alluding to, importantly, we must learn how to change the focus, so that the value to business becomes the most important aspect, not what the components of the solution are.
The other great benefit is you will also be talking in a similar language to other sellers calling on the business.
The objective here is not to make you an expert in Big Data and Analytics, but understand some of its benefits, and how linking with other sellers, can help you drive new and larger opportunities. It could be you help uncover a new opportunity for Big Data and Analytics, just through understanding the high level benefits to a business, at which point you can engage with your colleagues who are the experts in this field, and be part of the team that builds the end-to-end solution for the client.