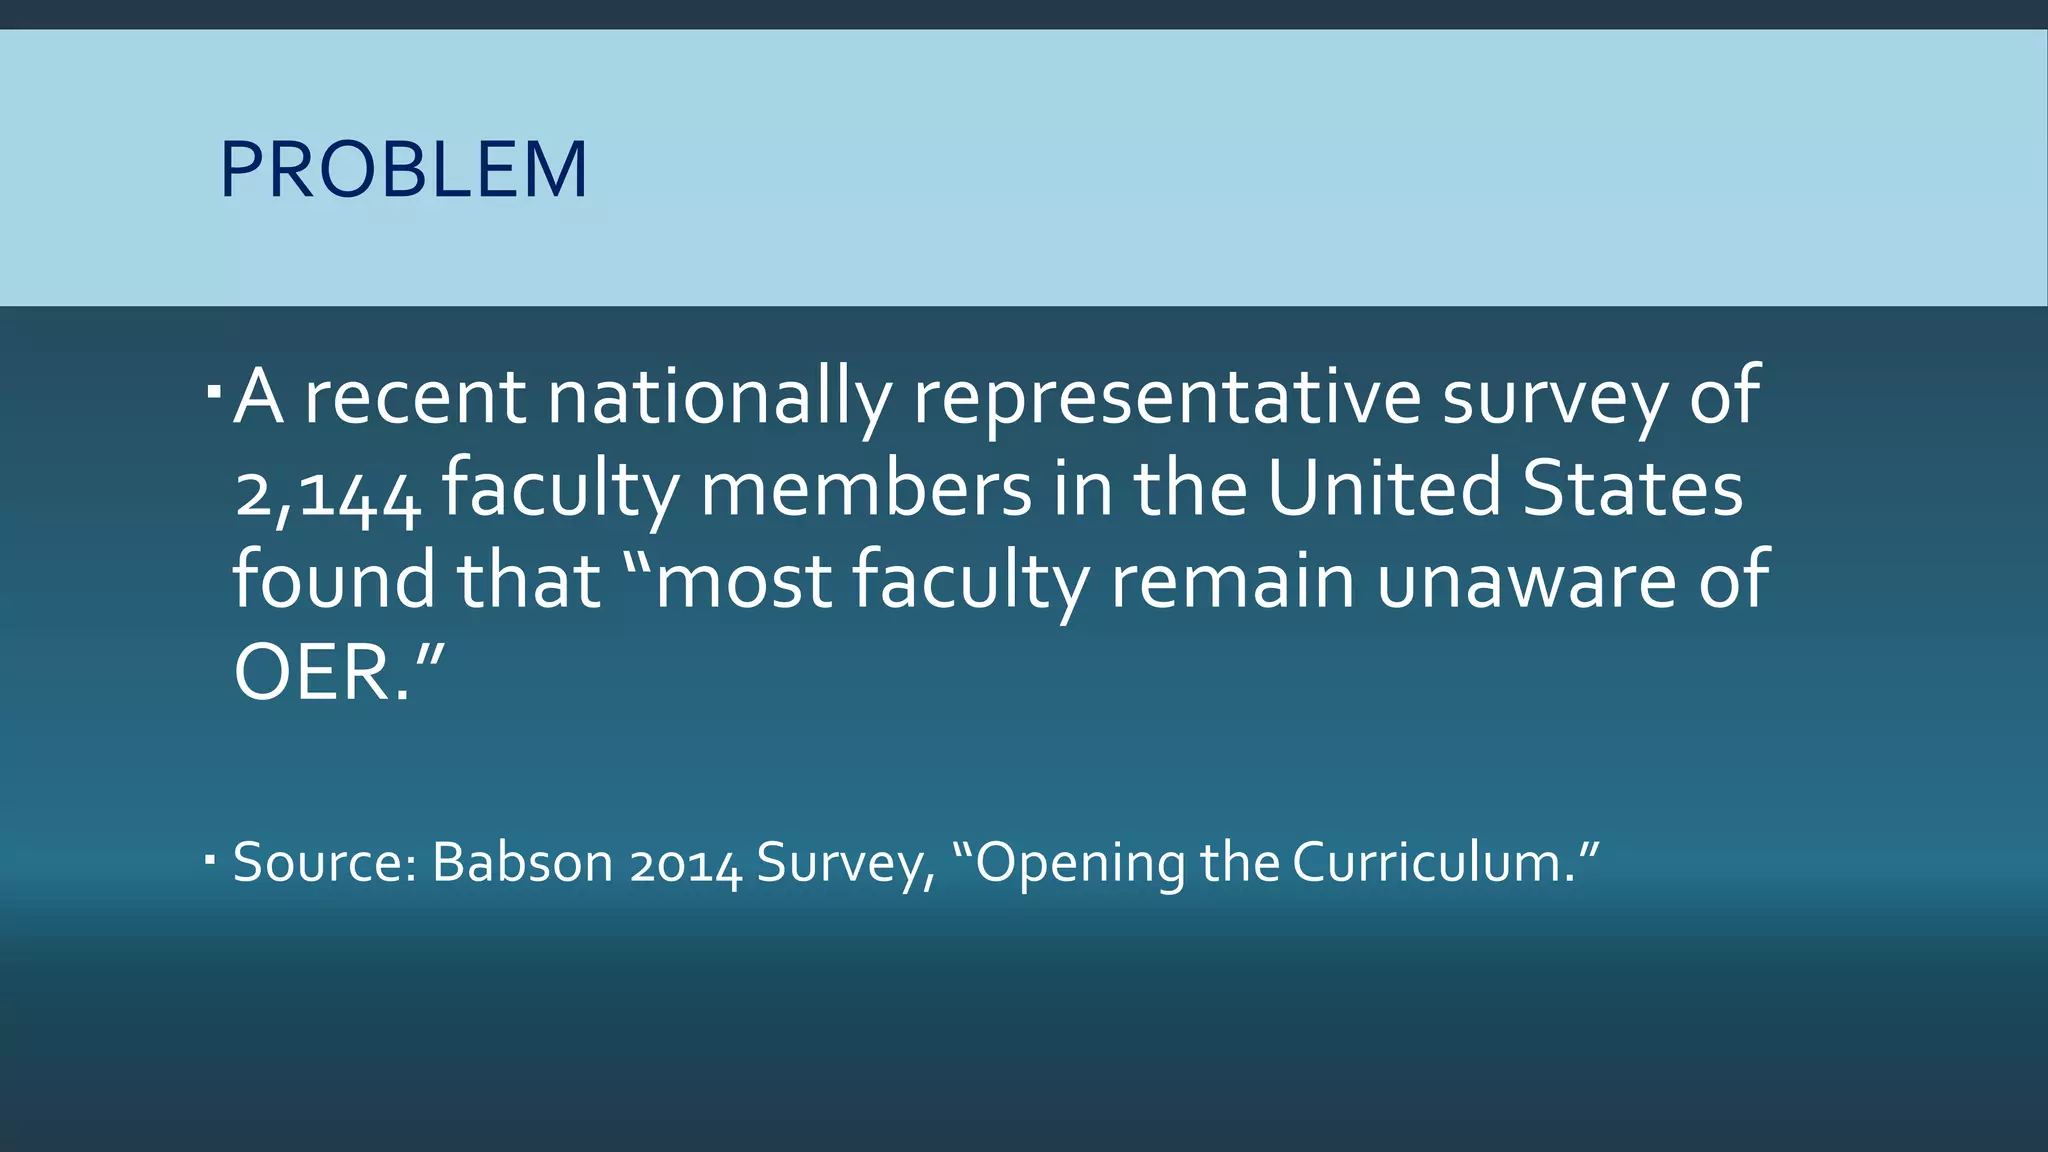
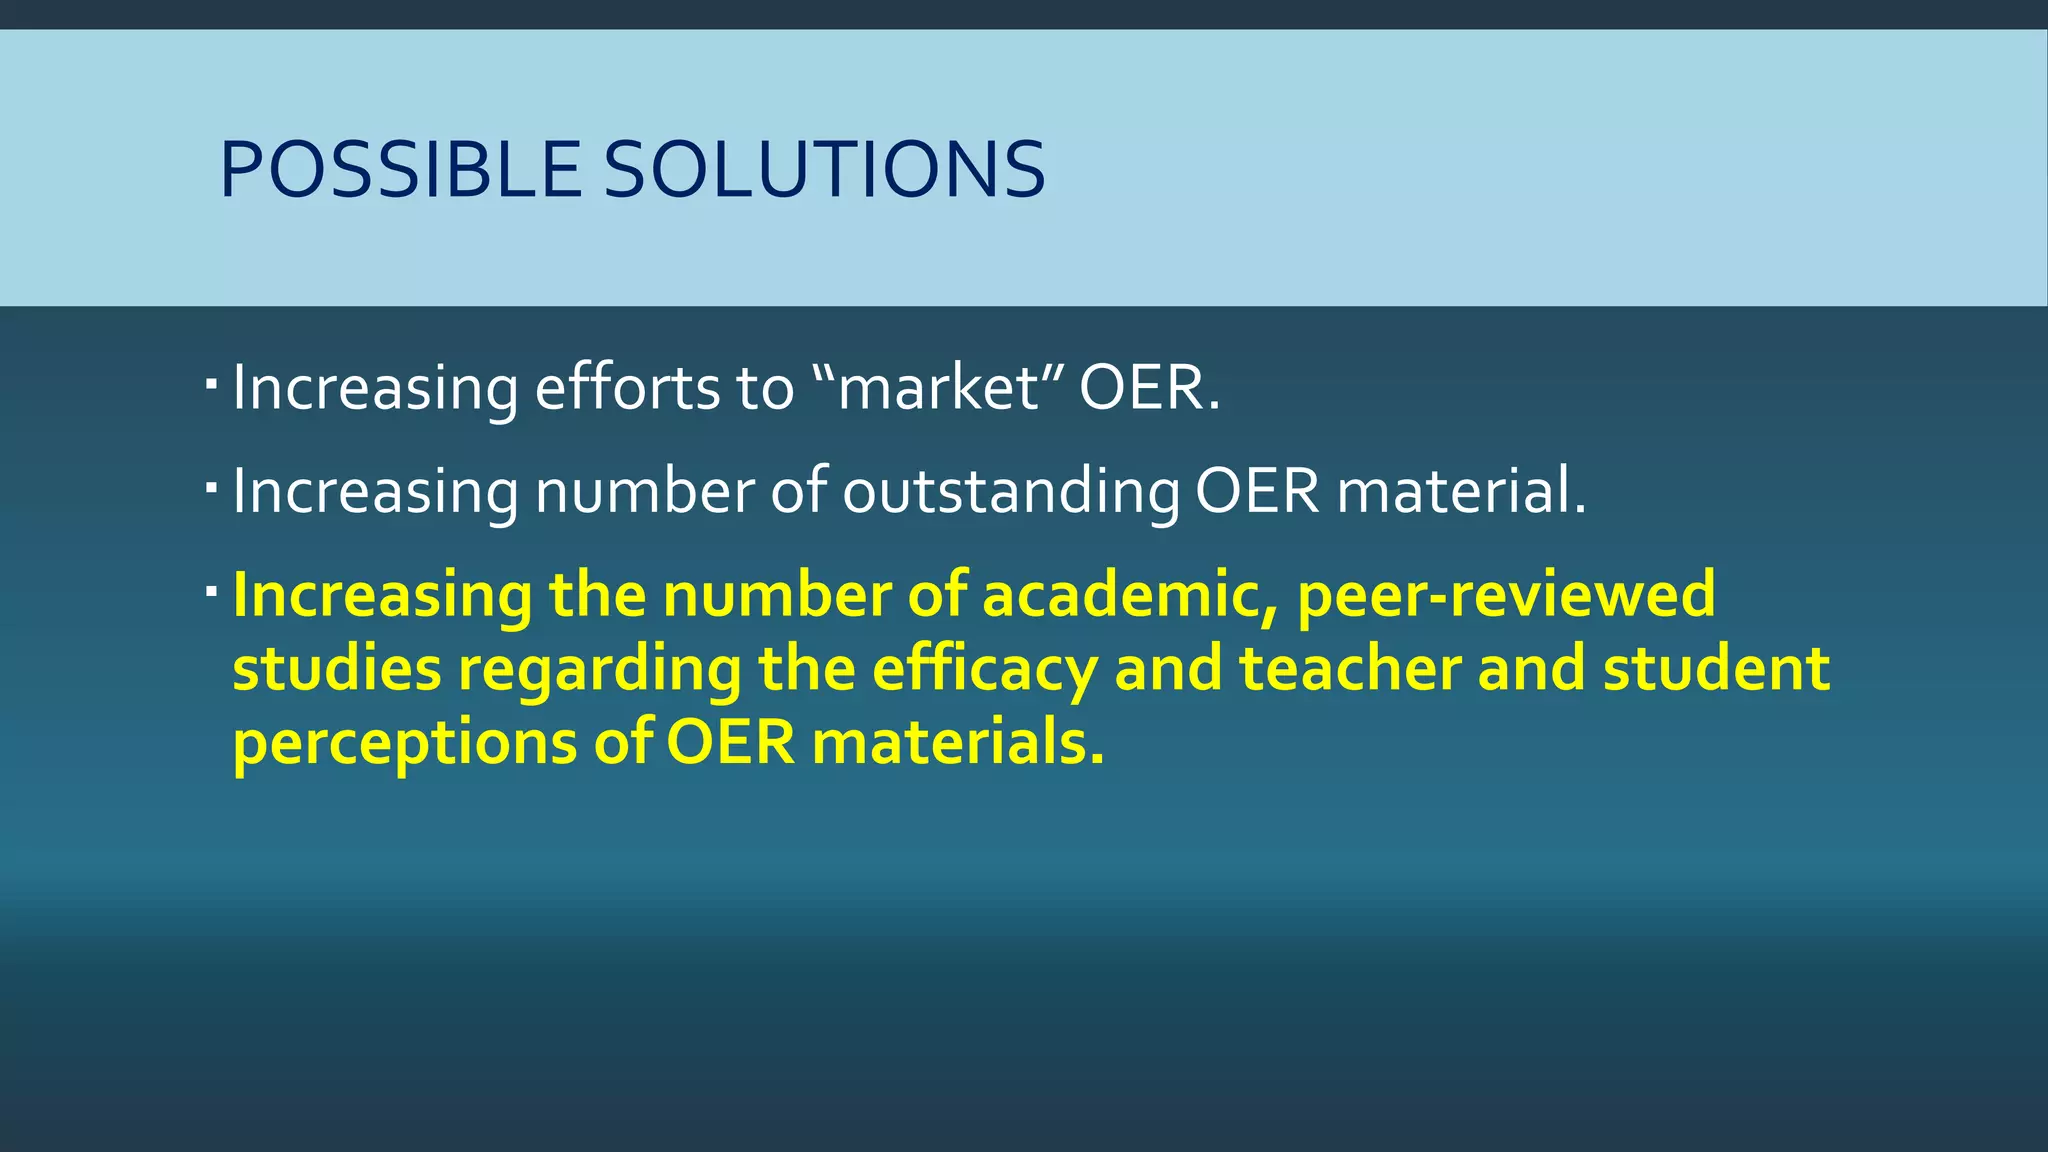
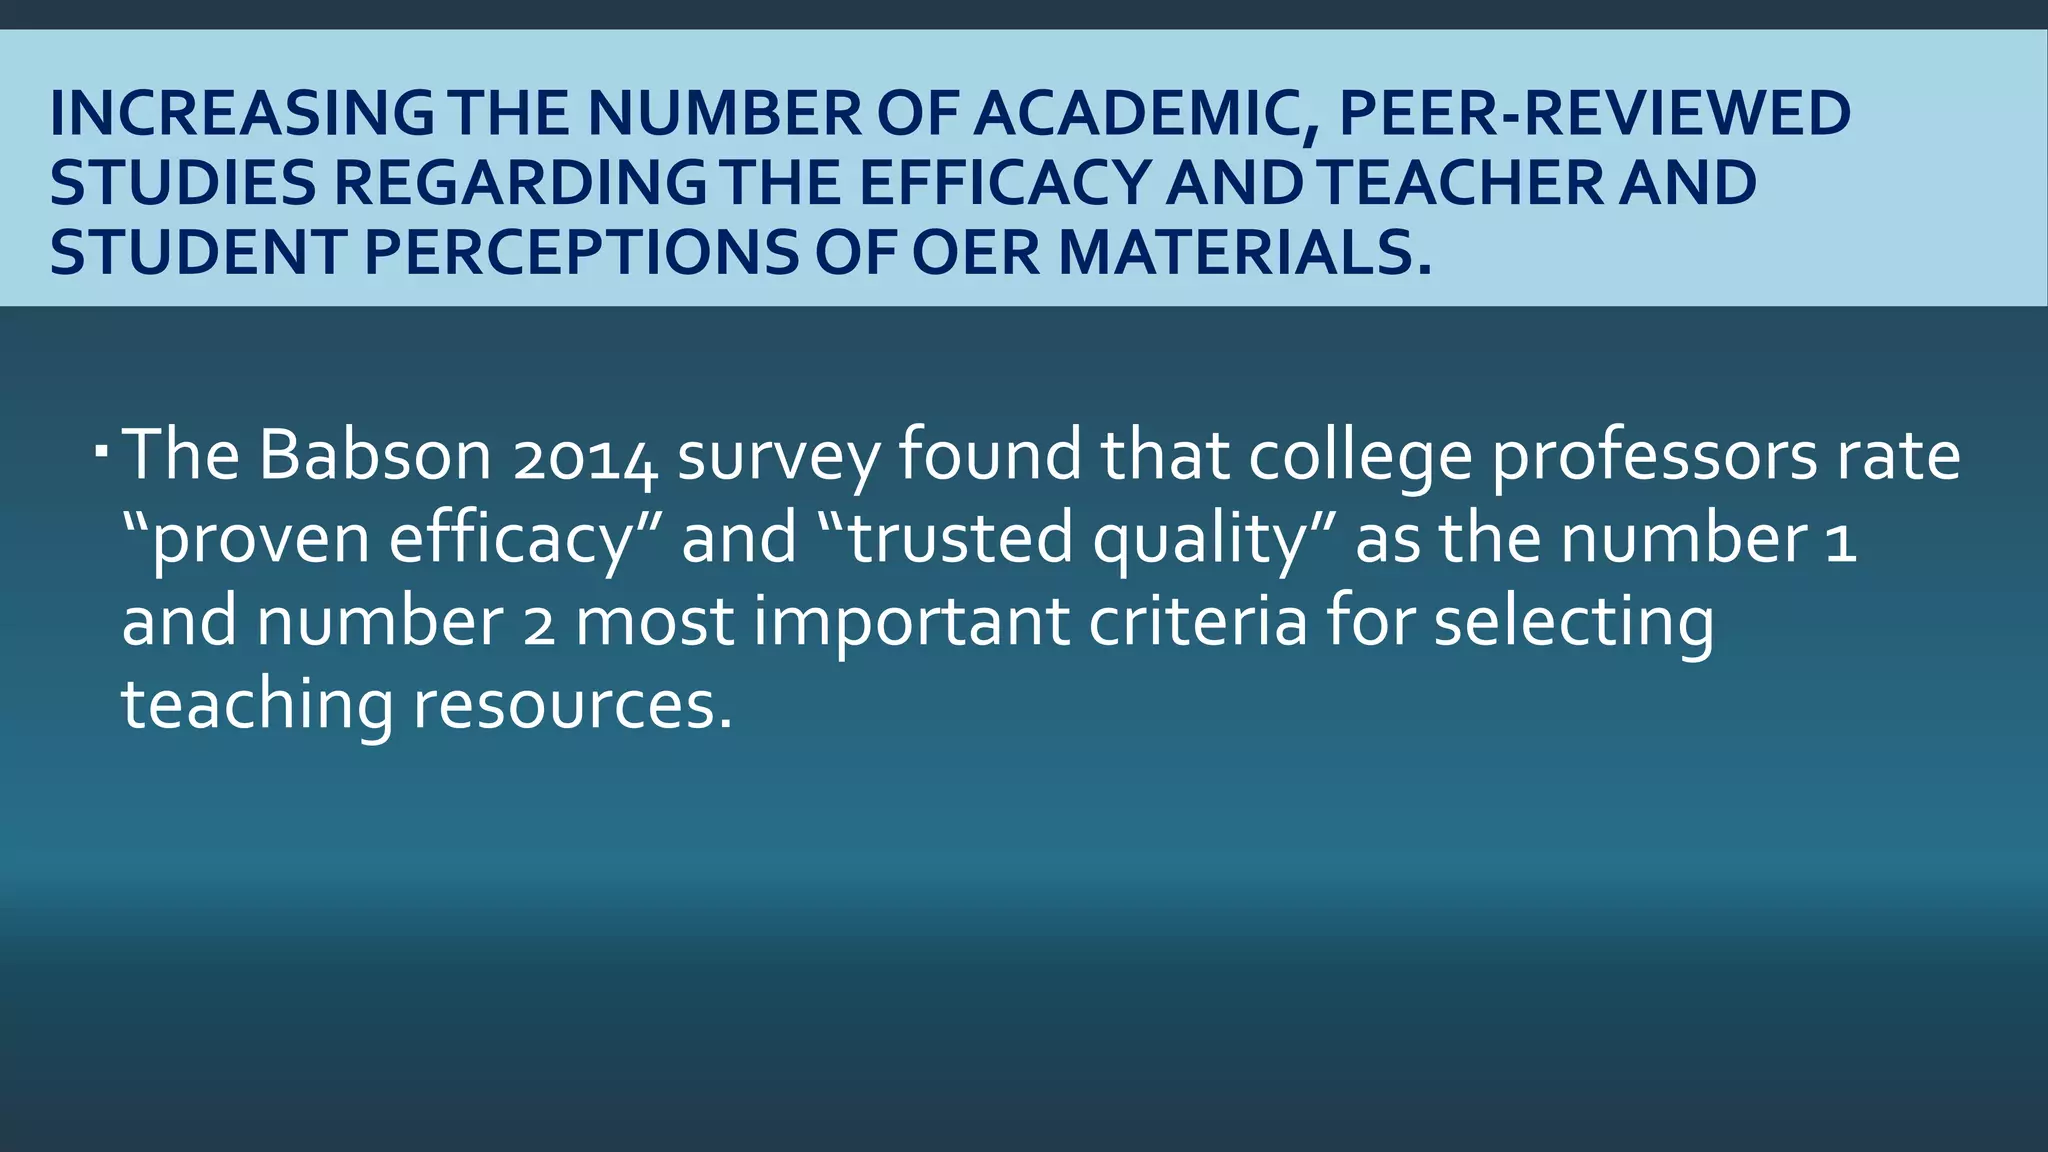
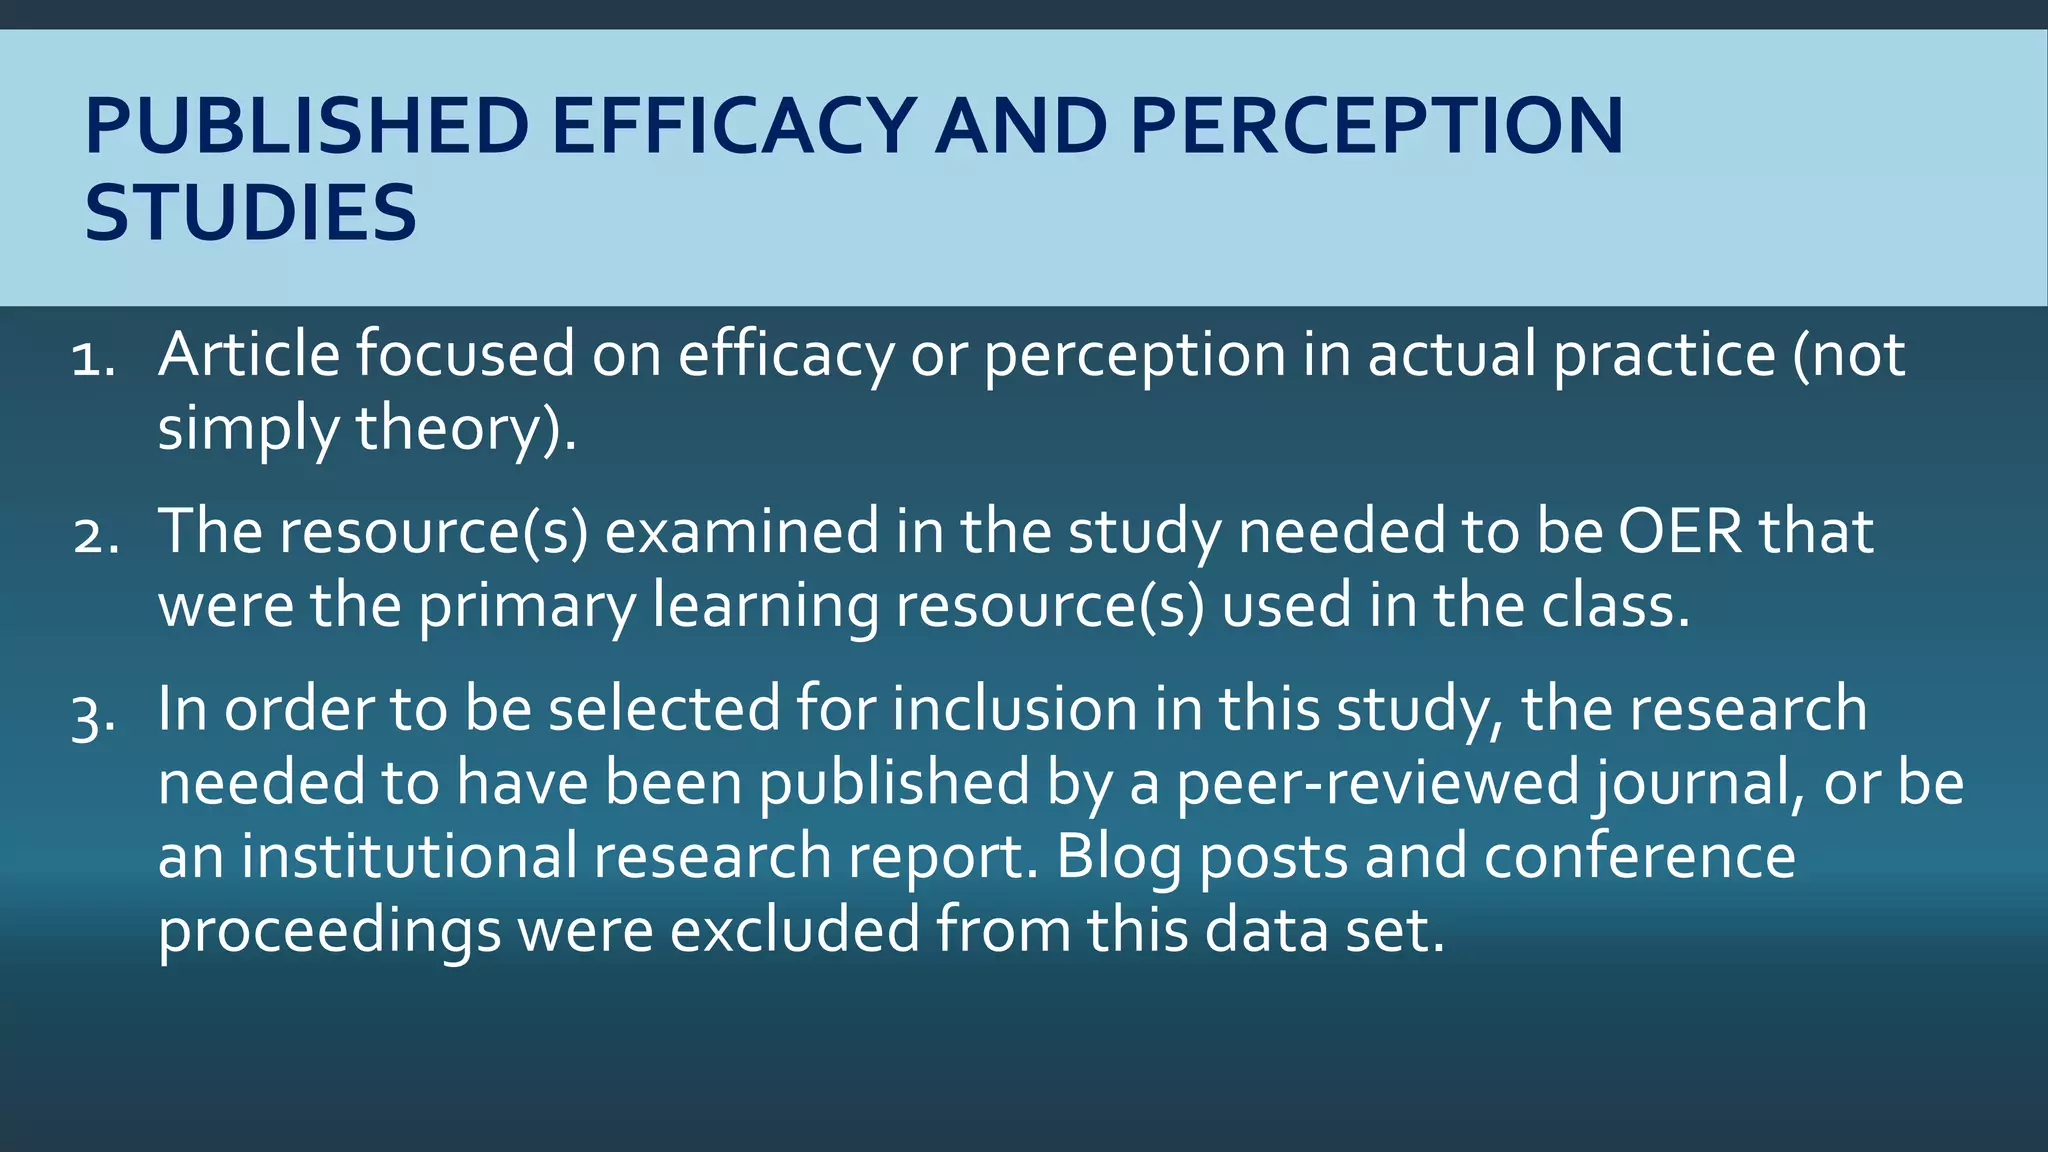
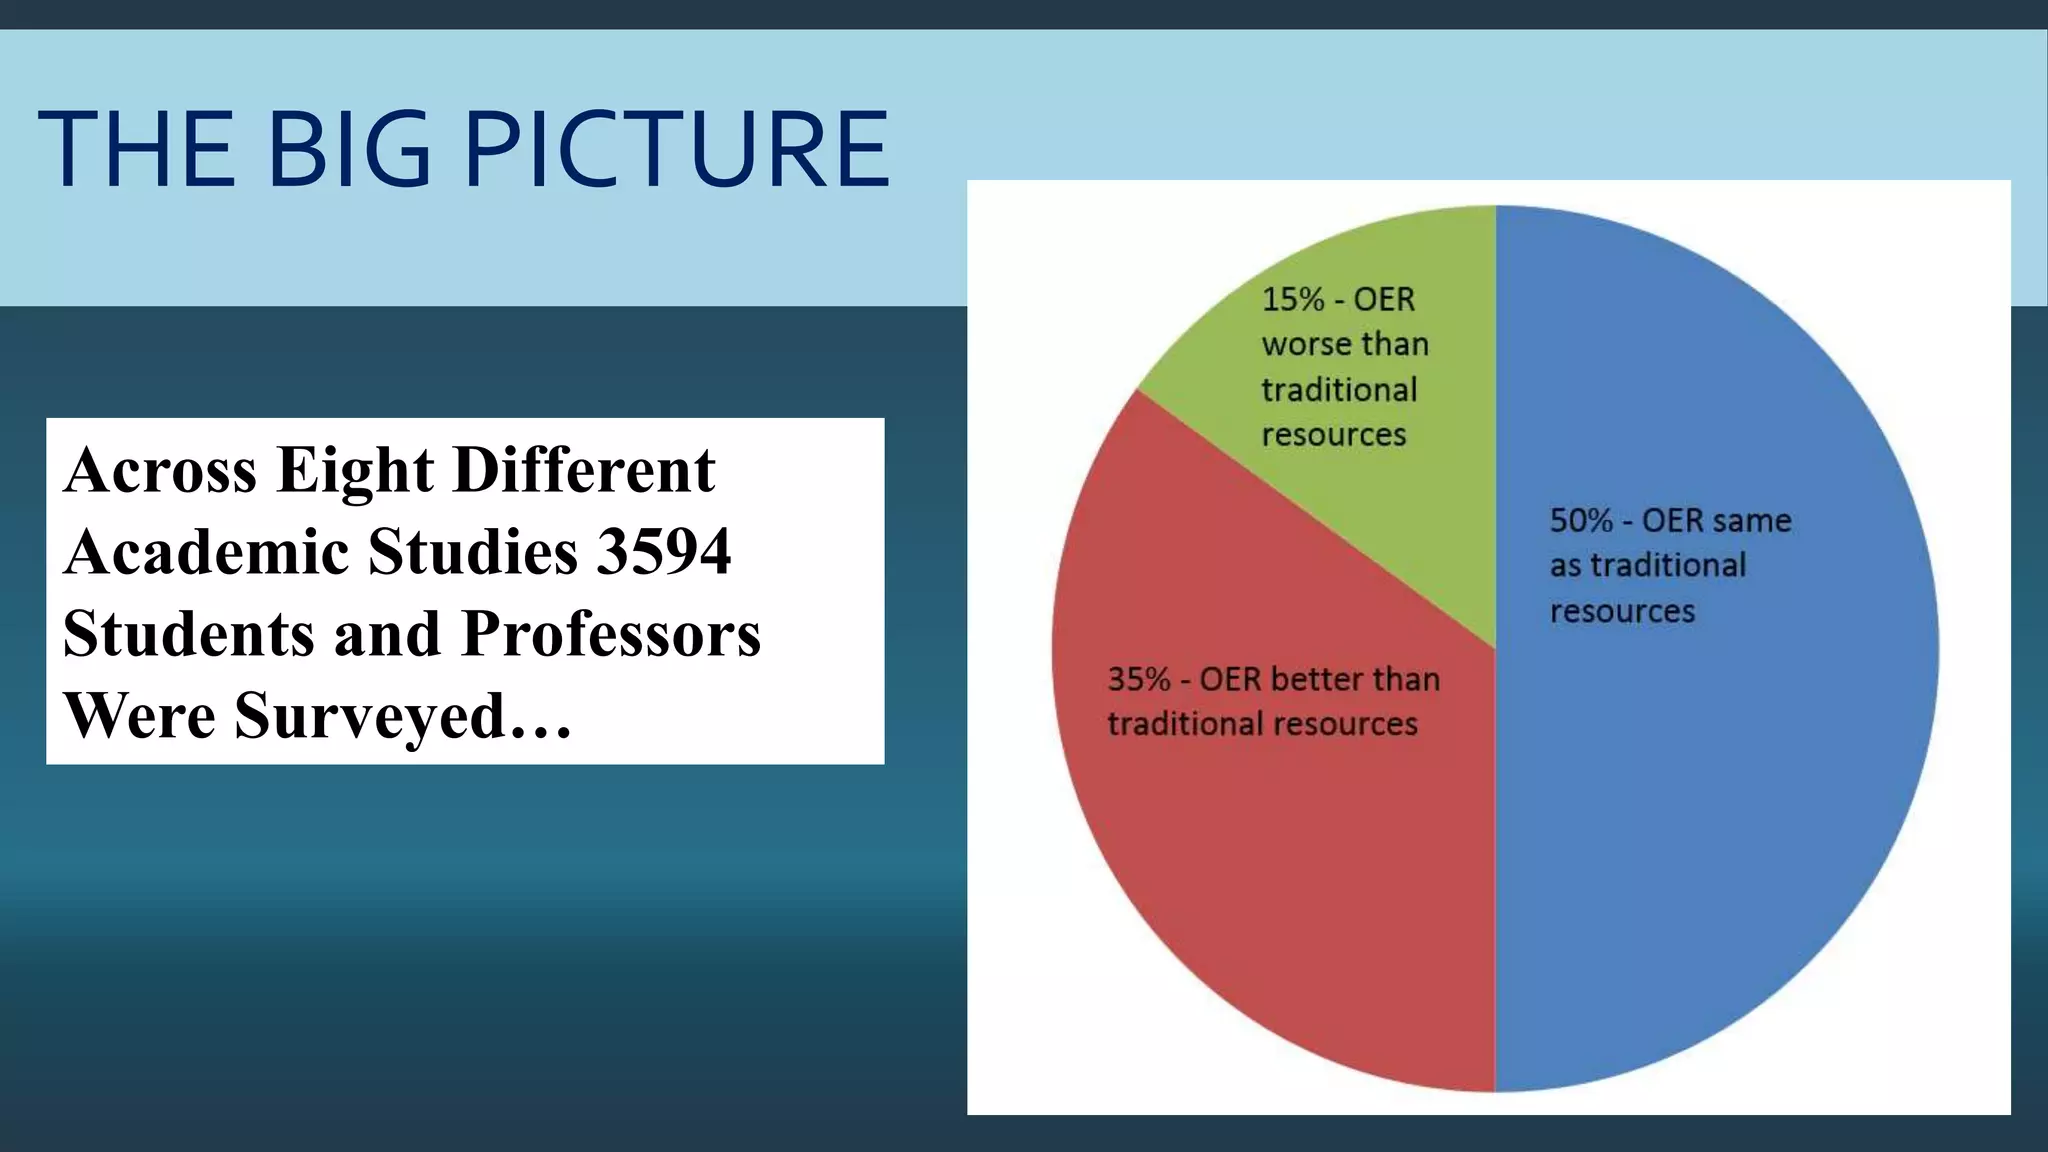
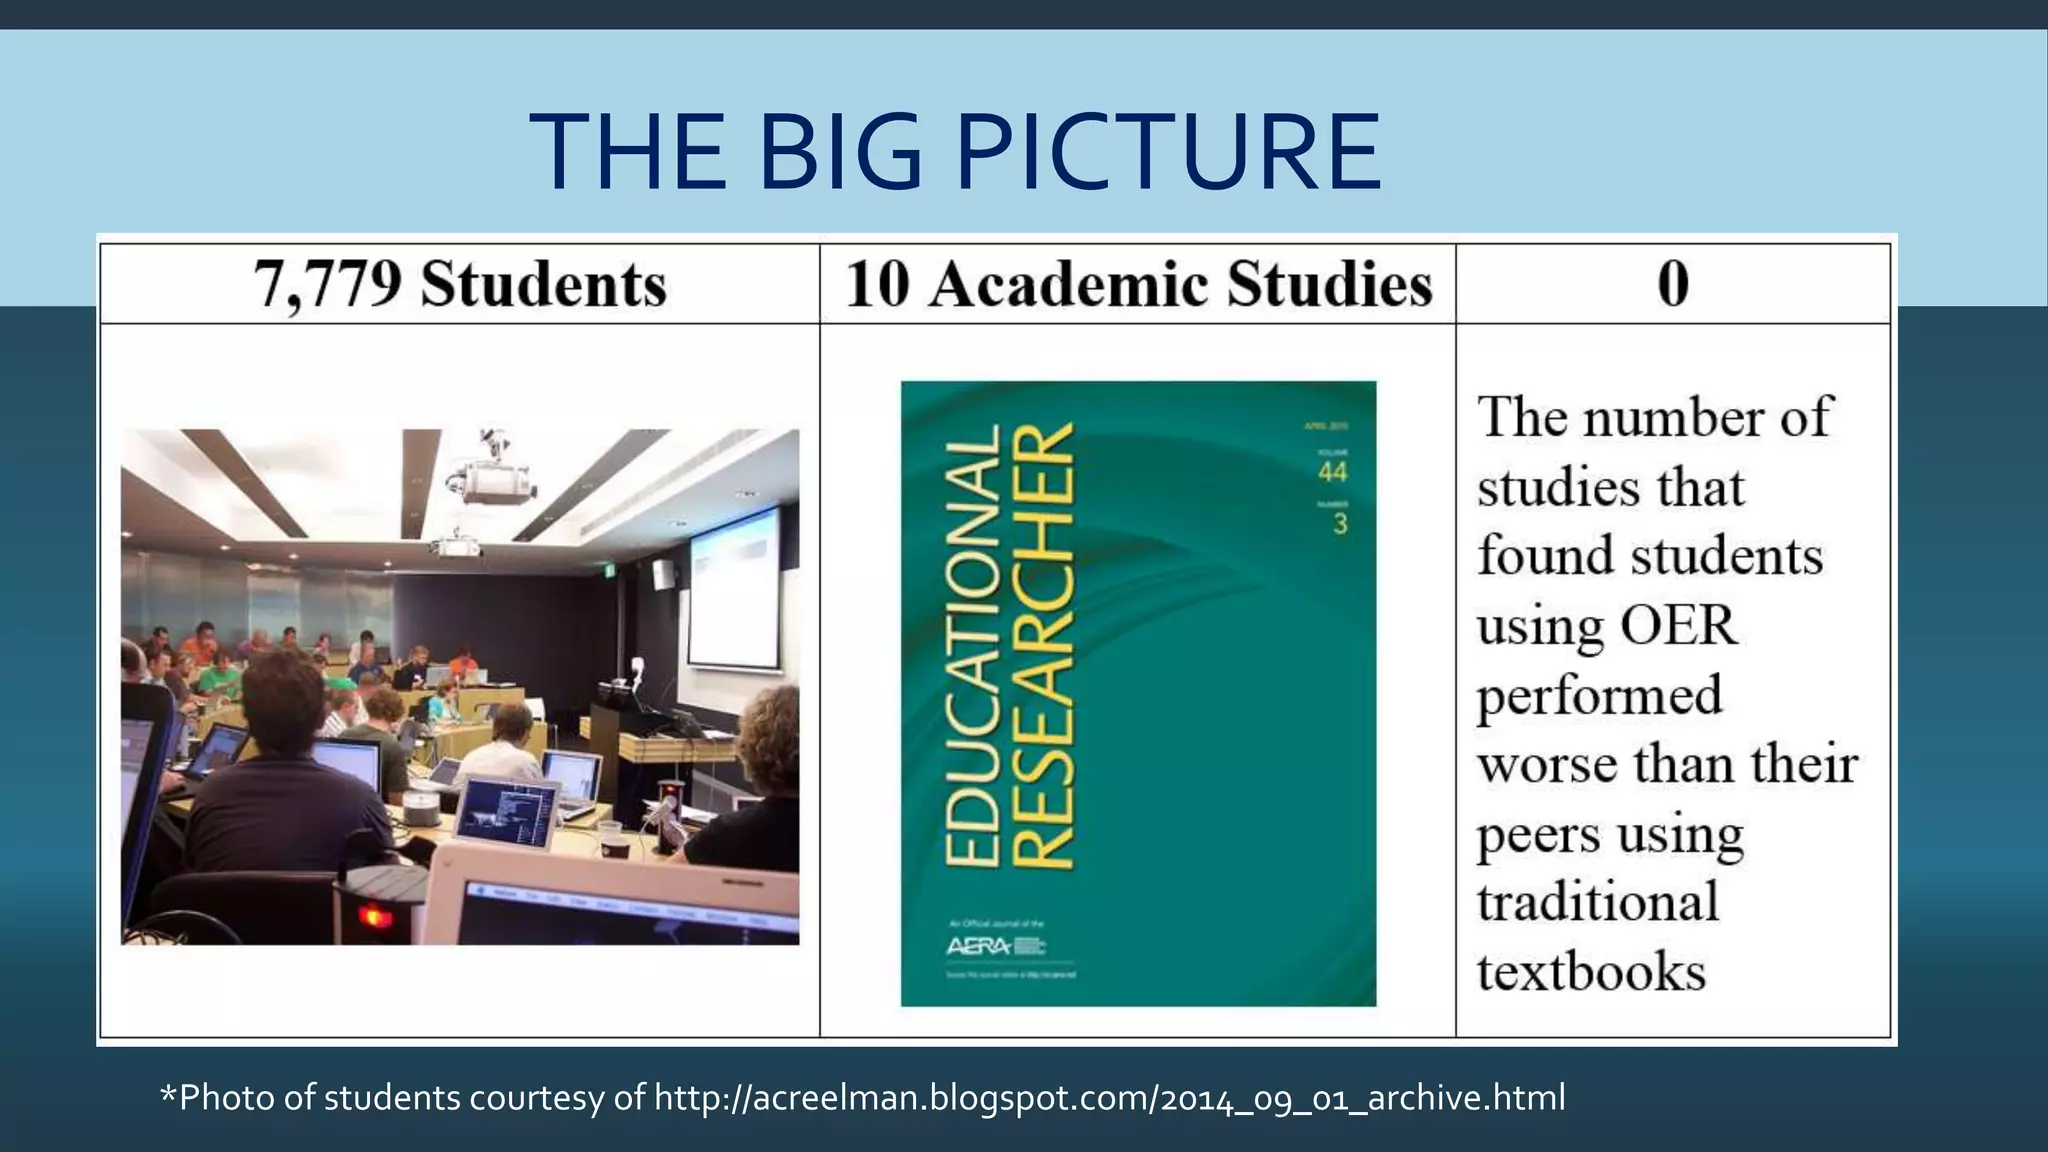
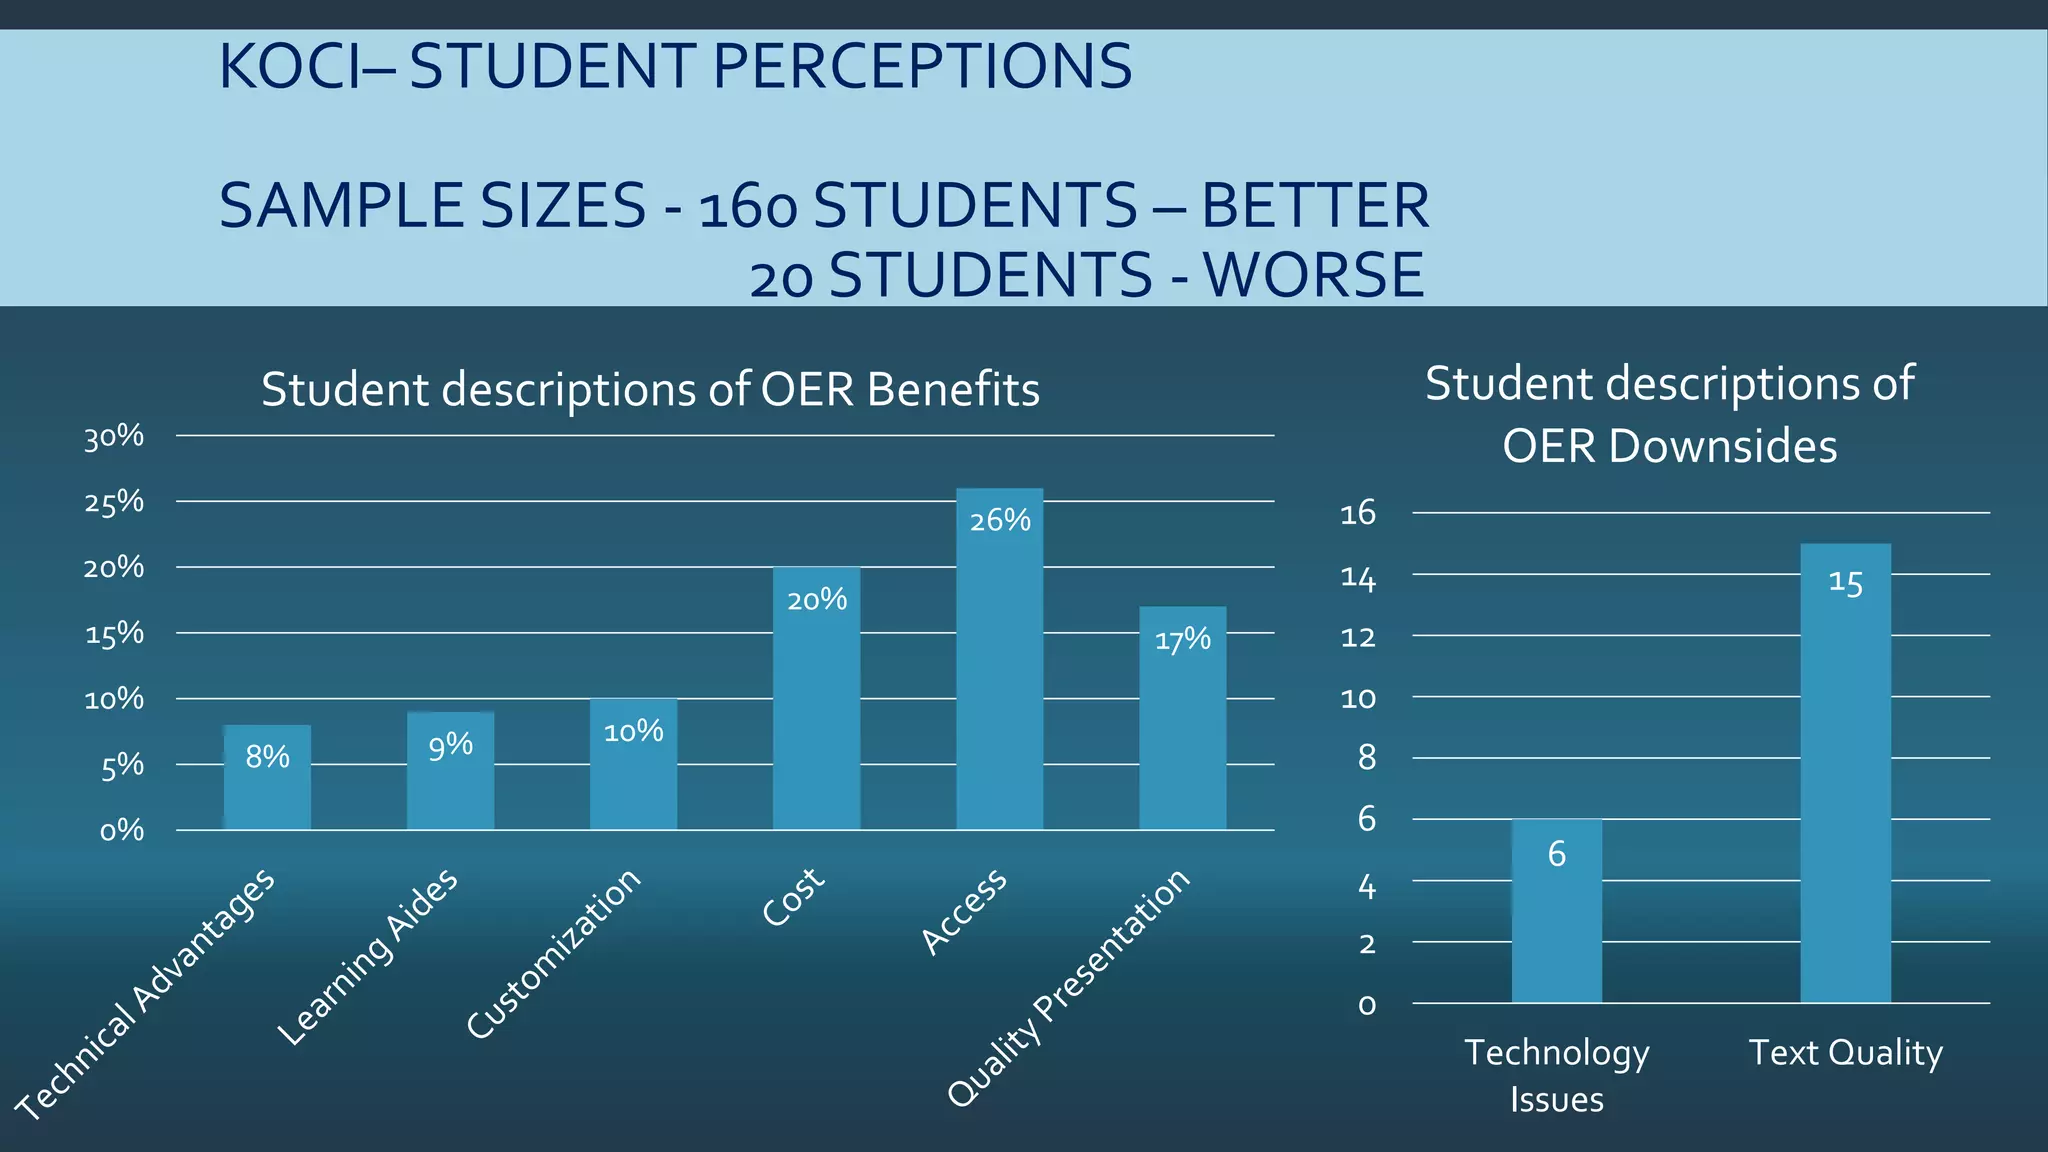
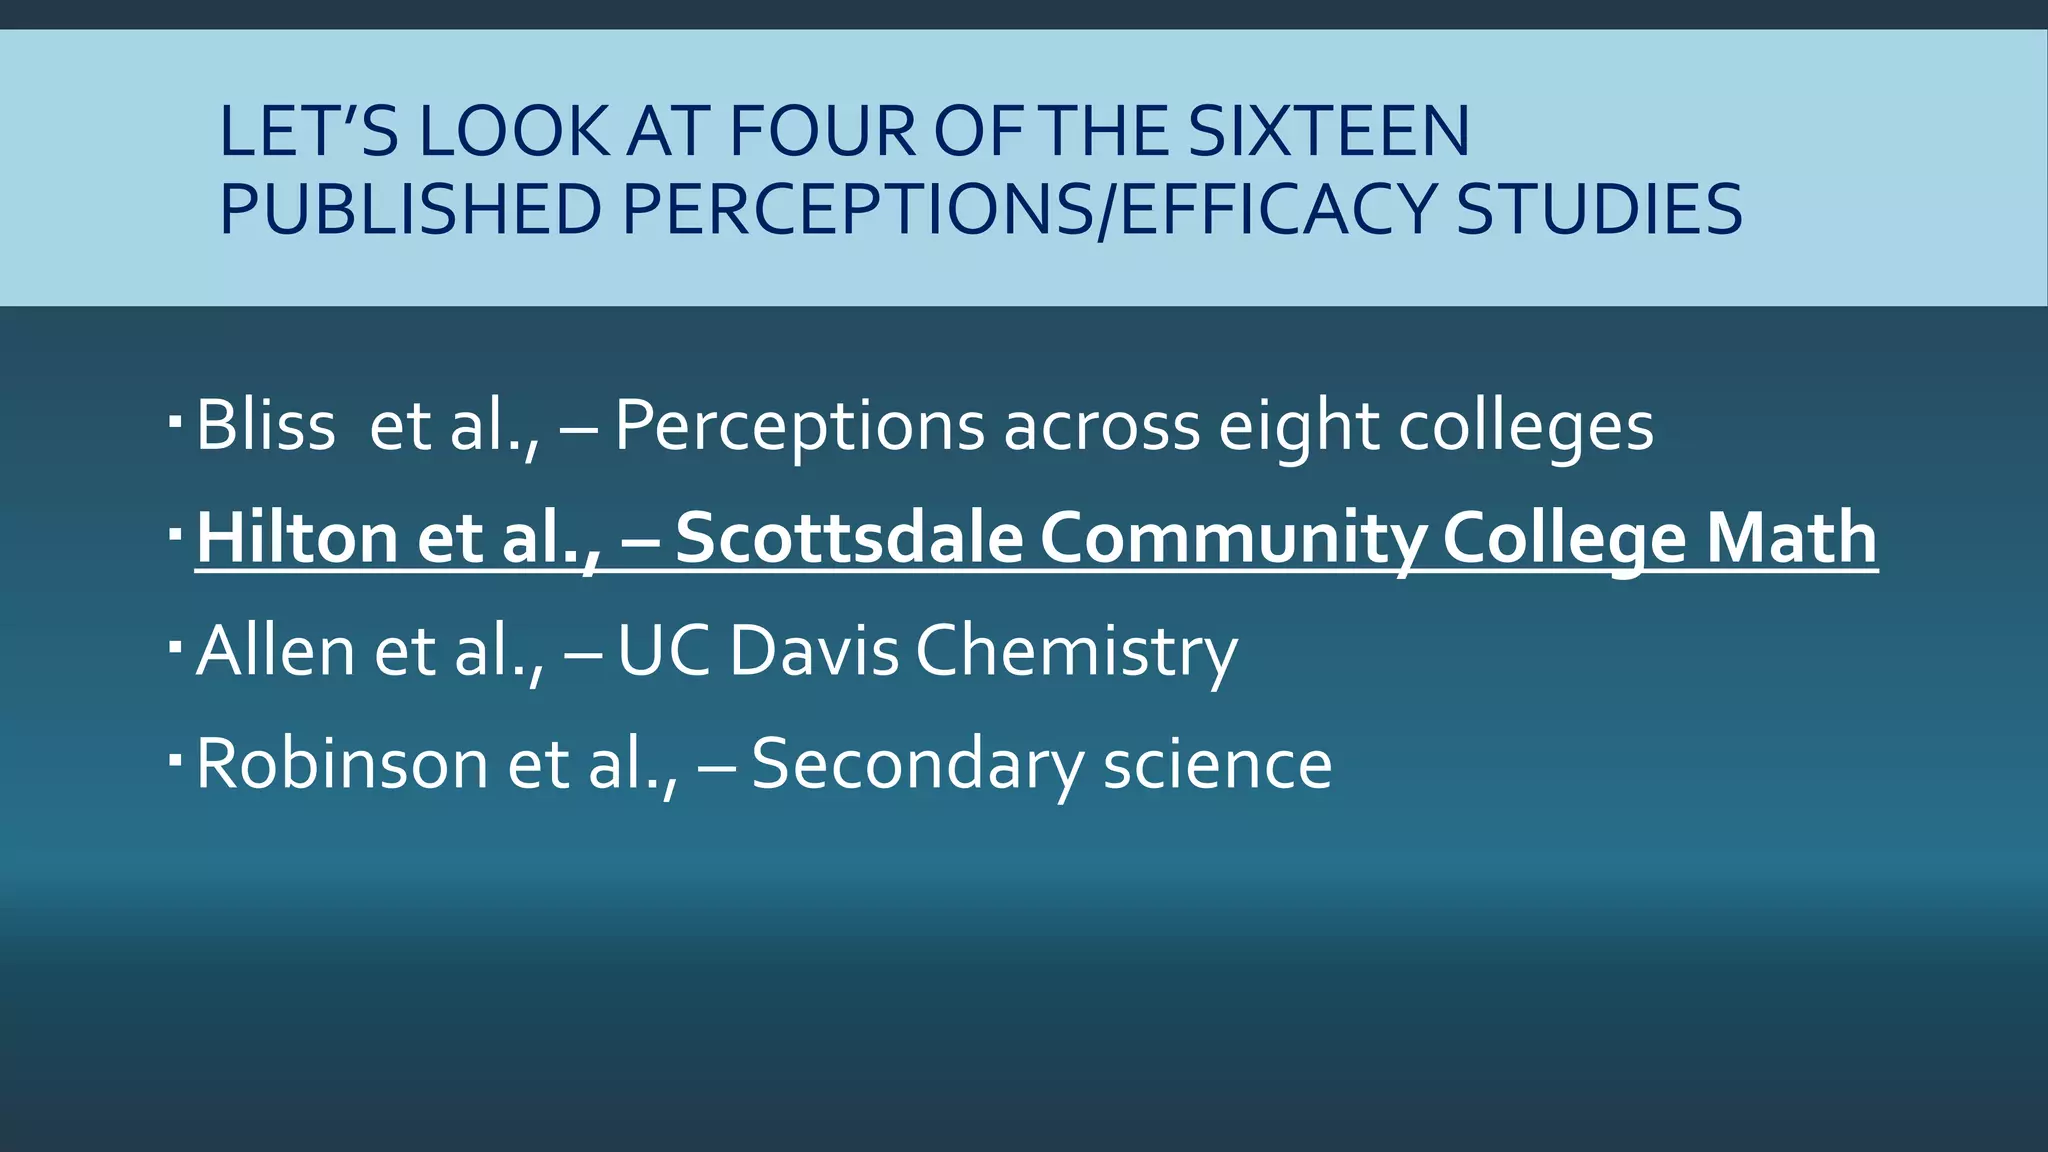
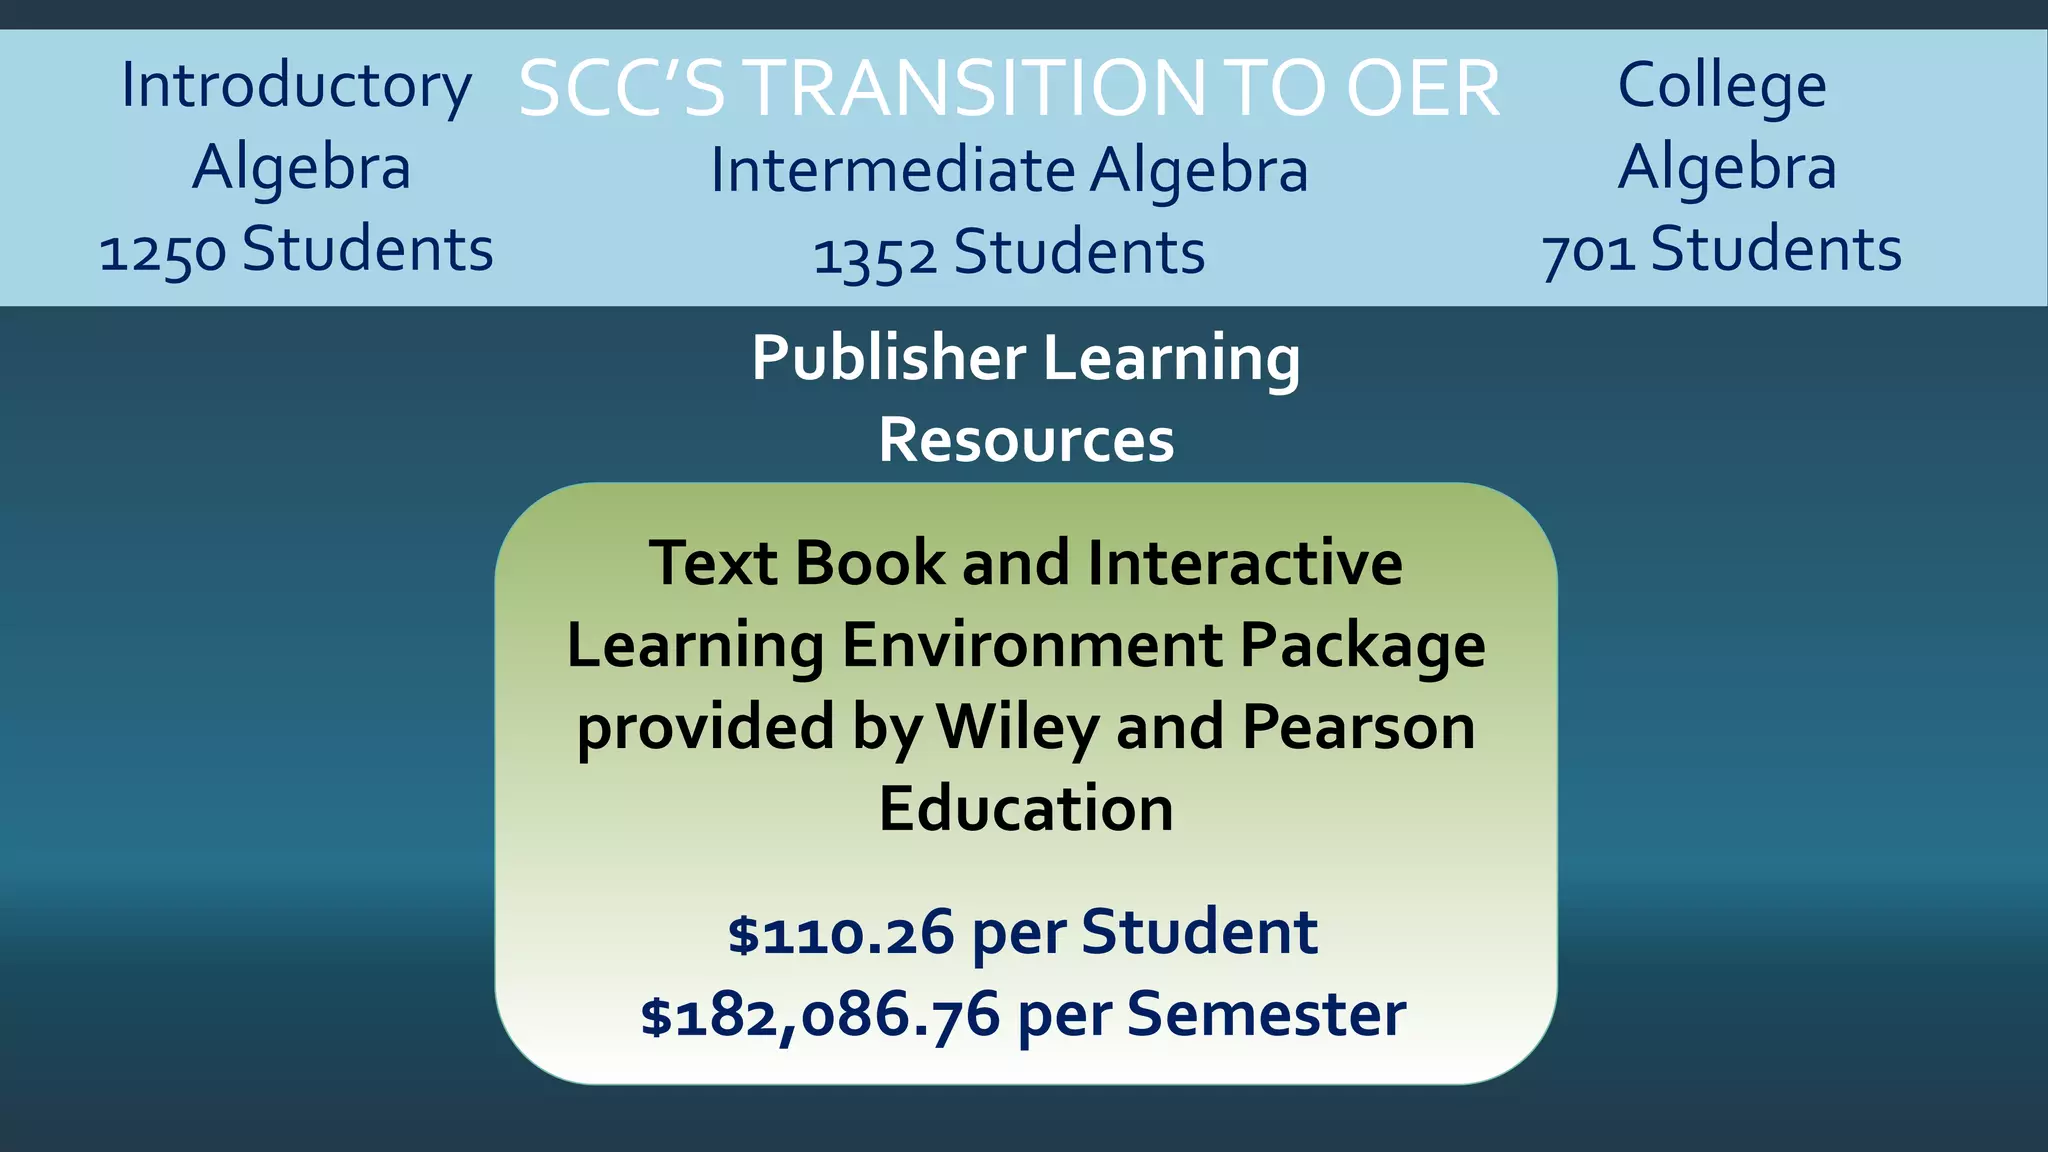
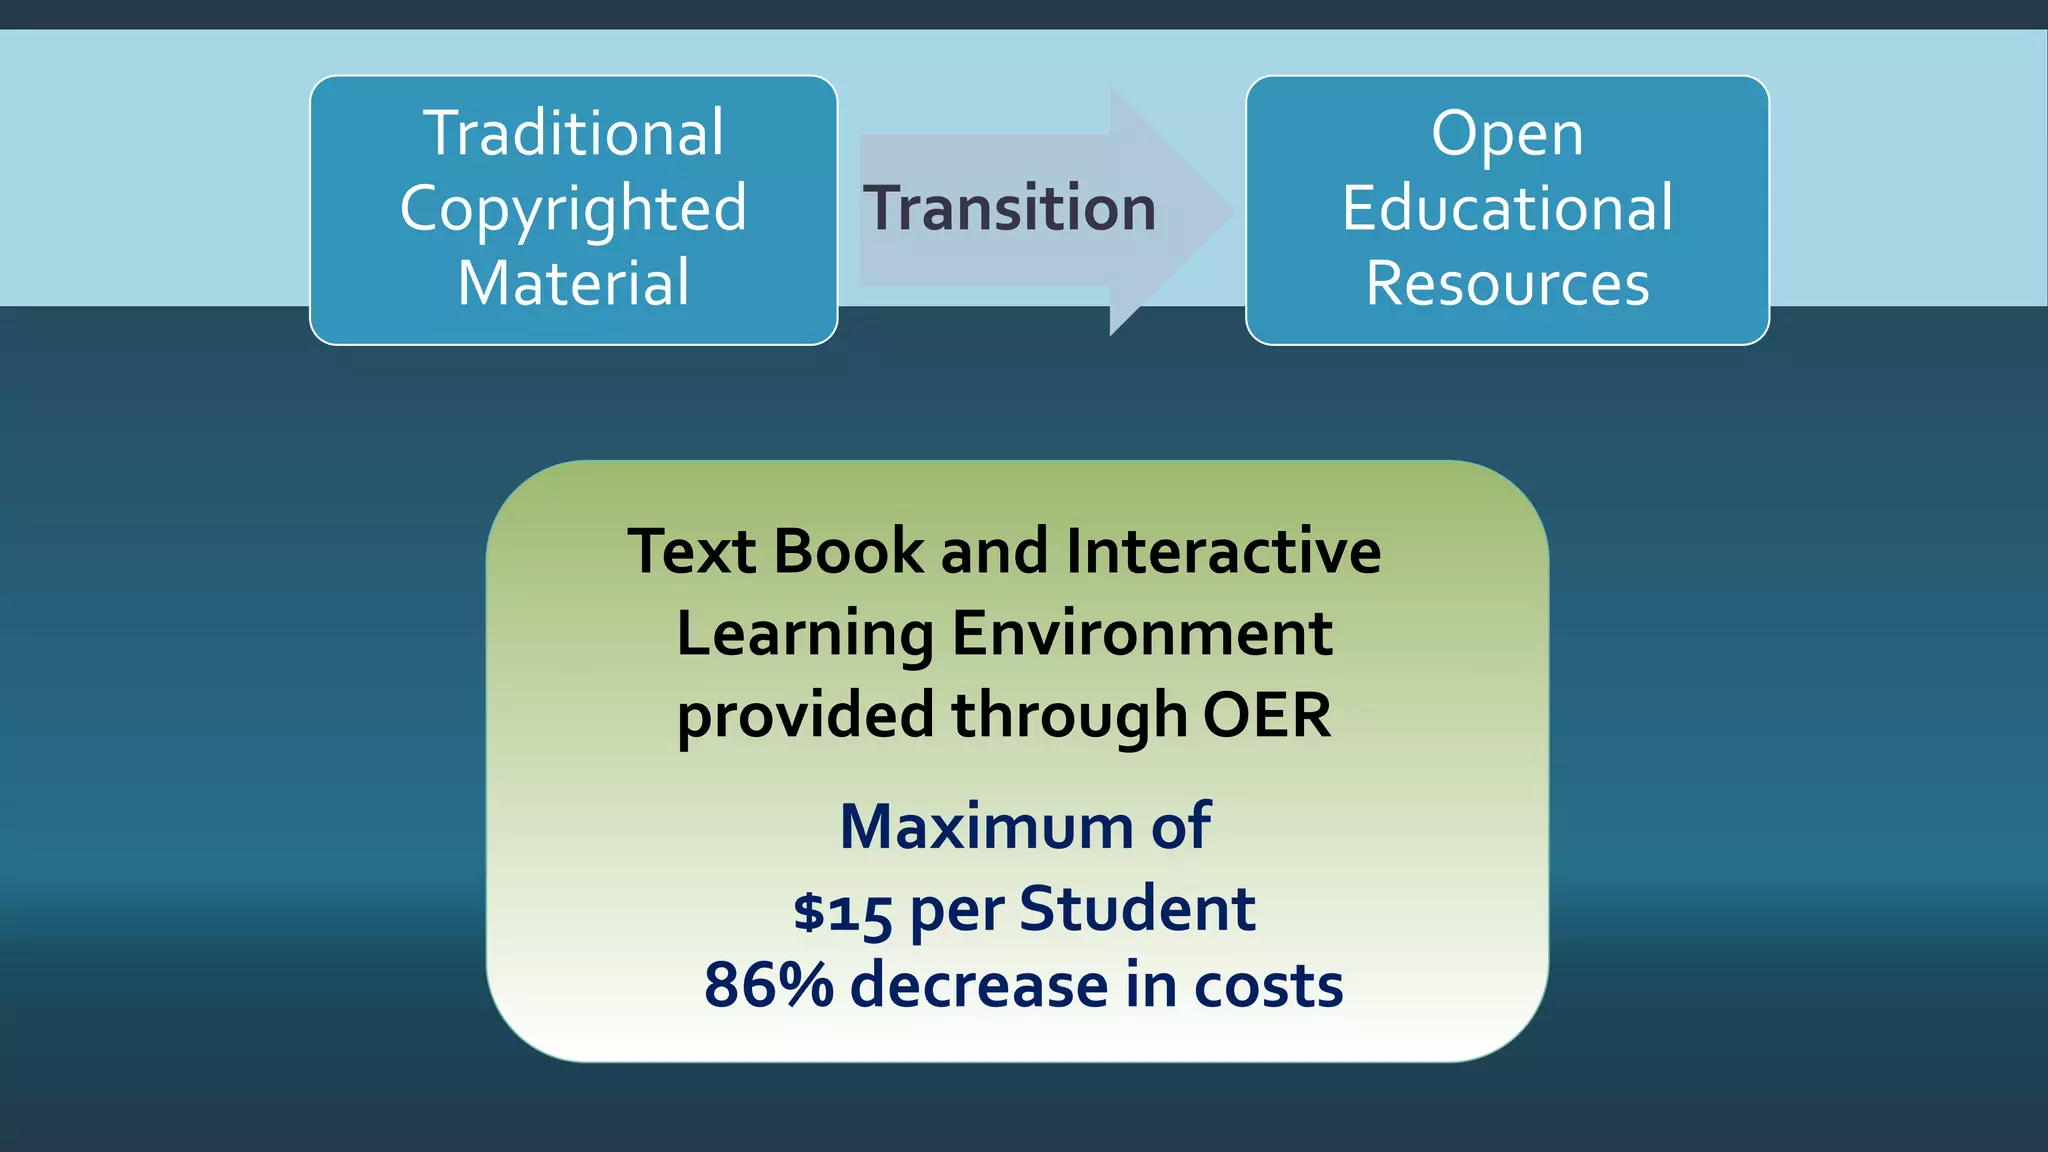
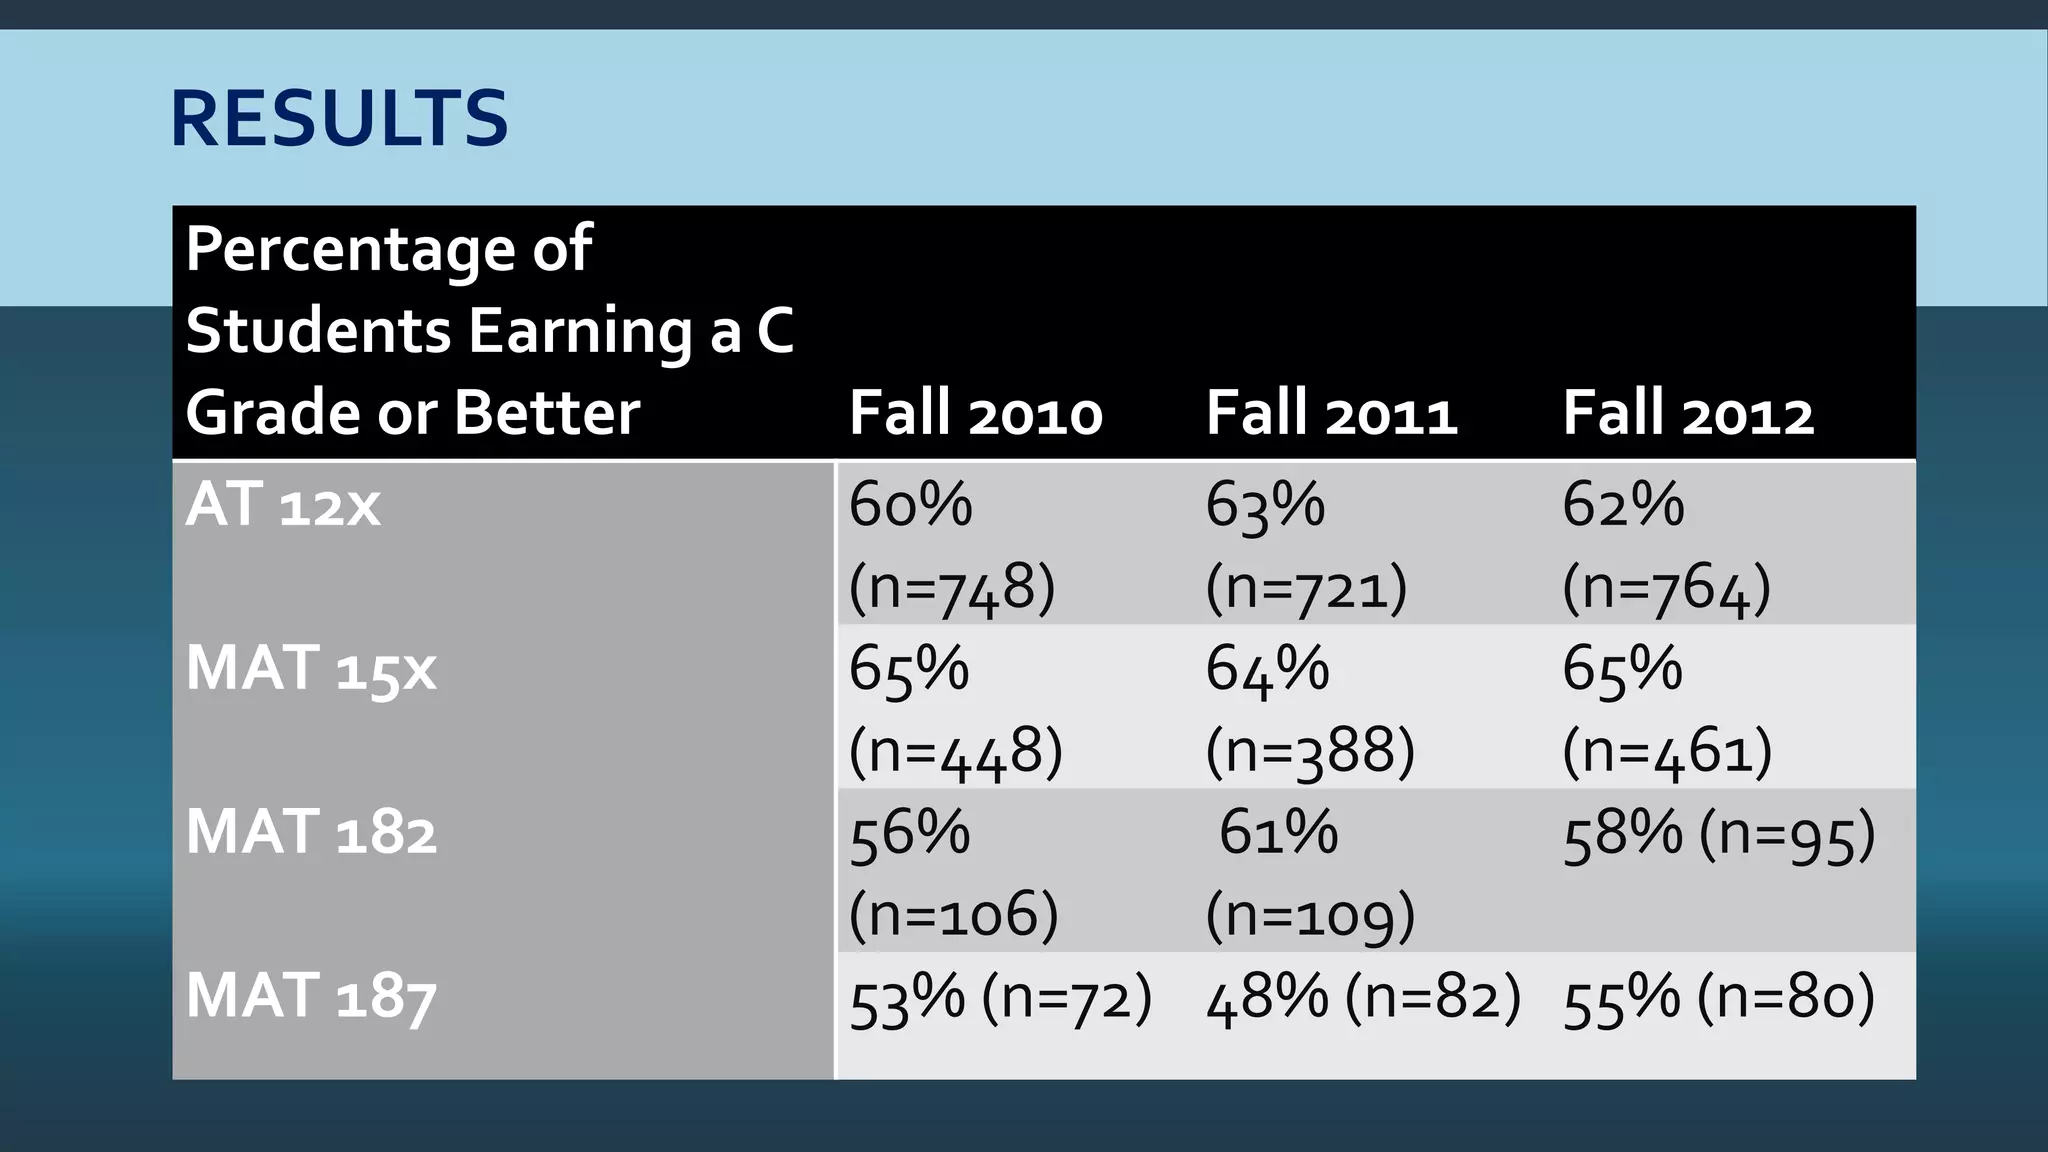
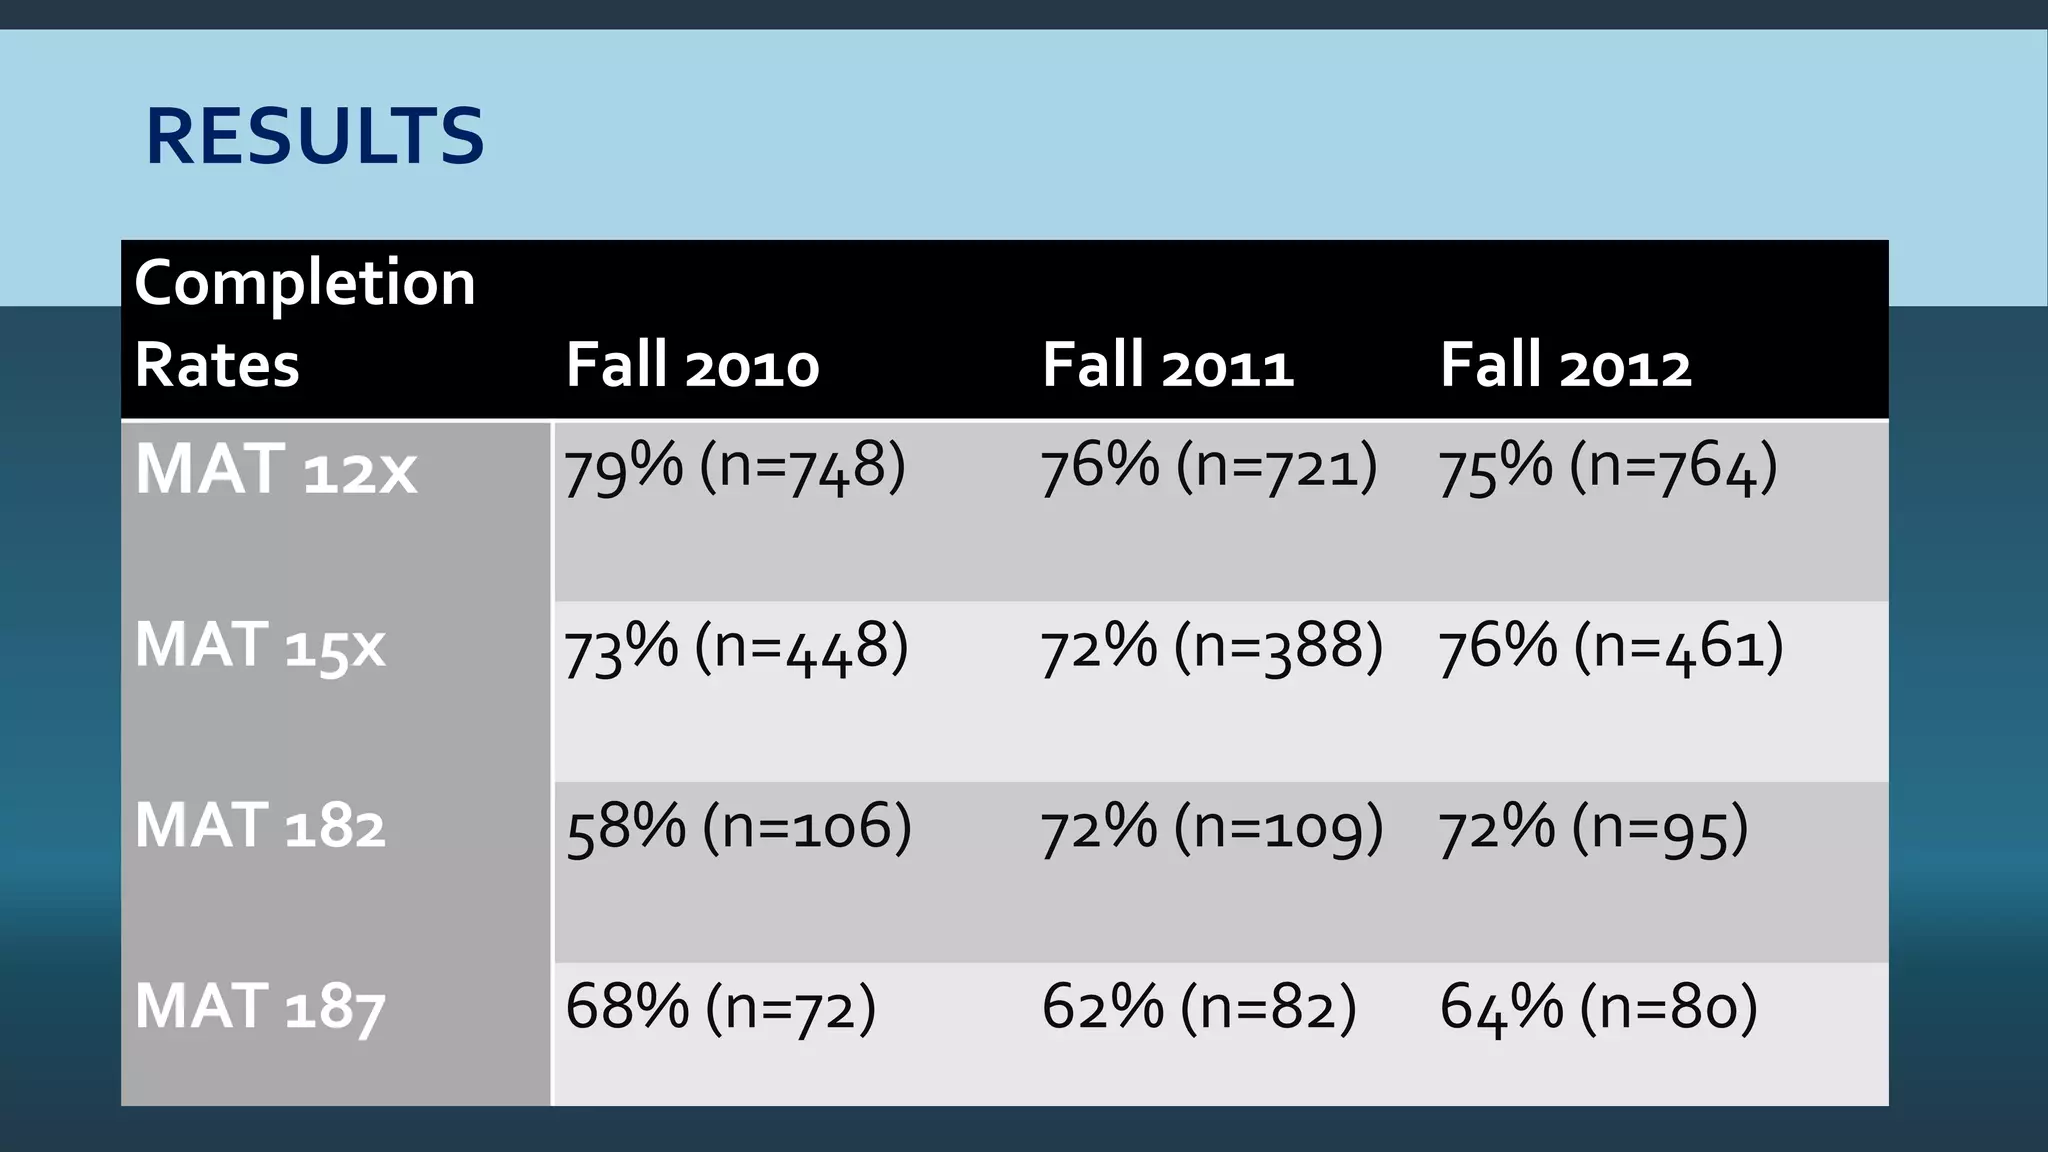
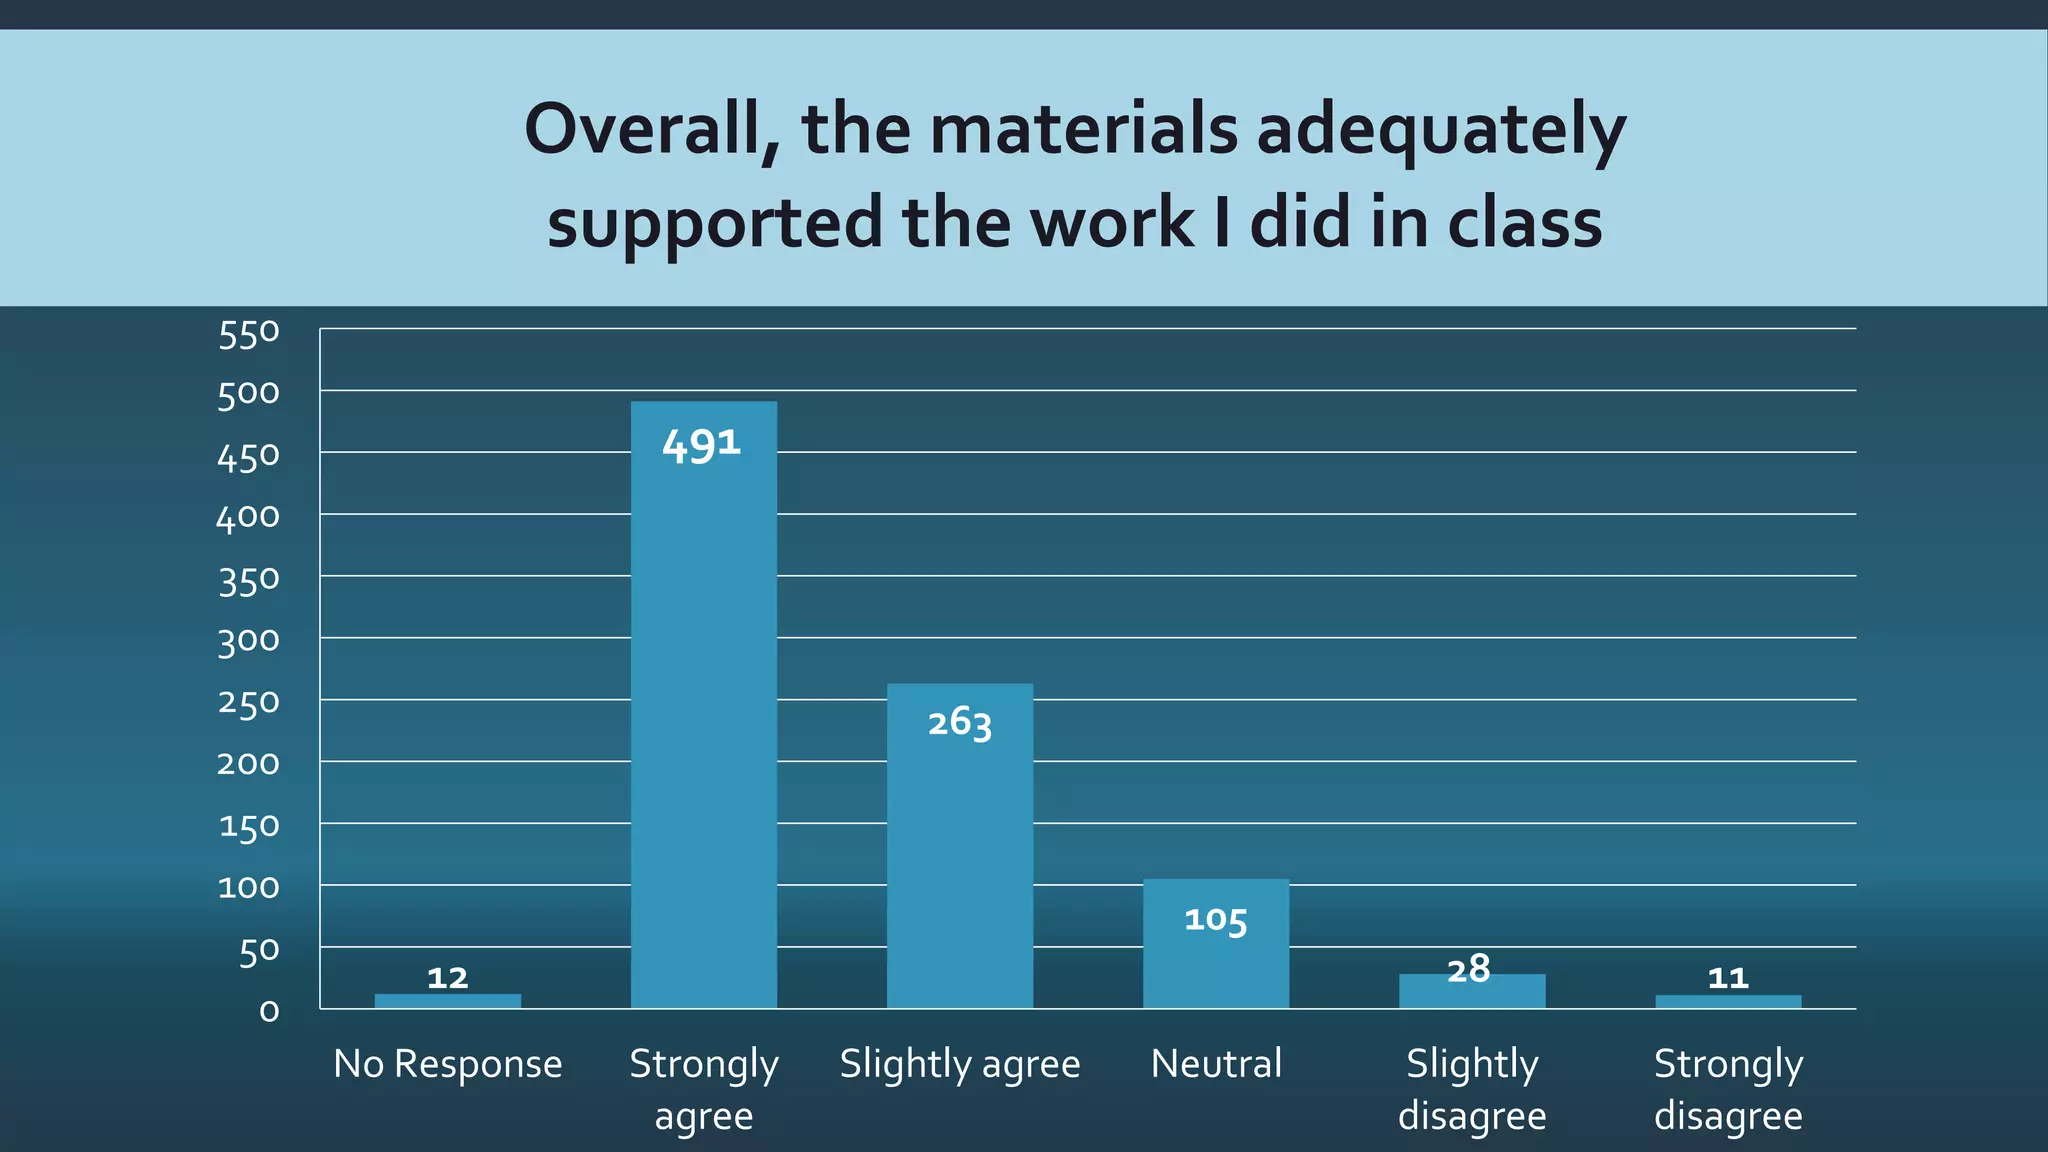
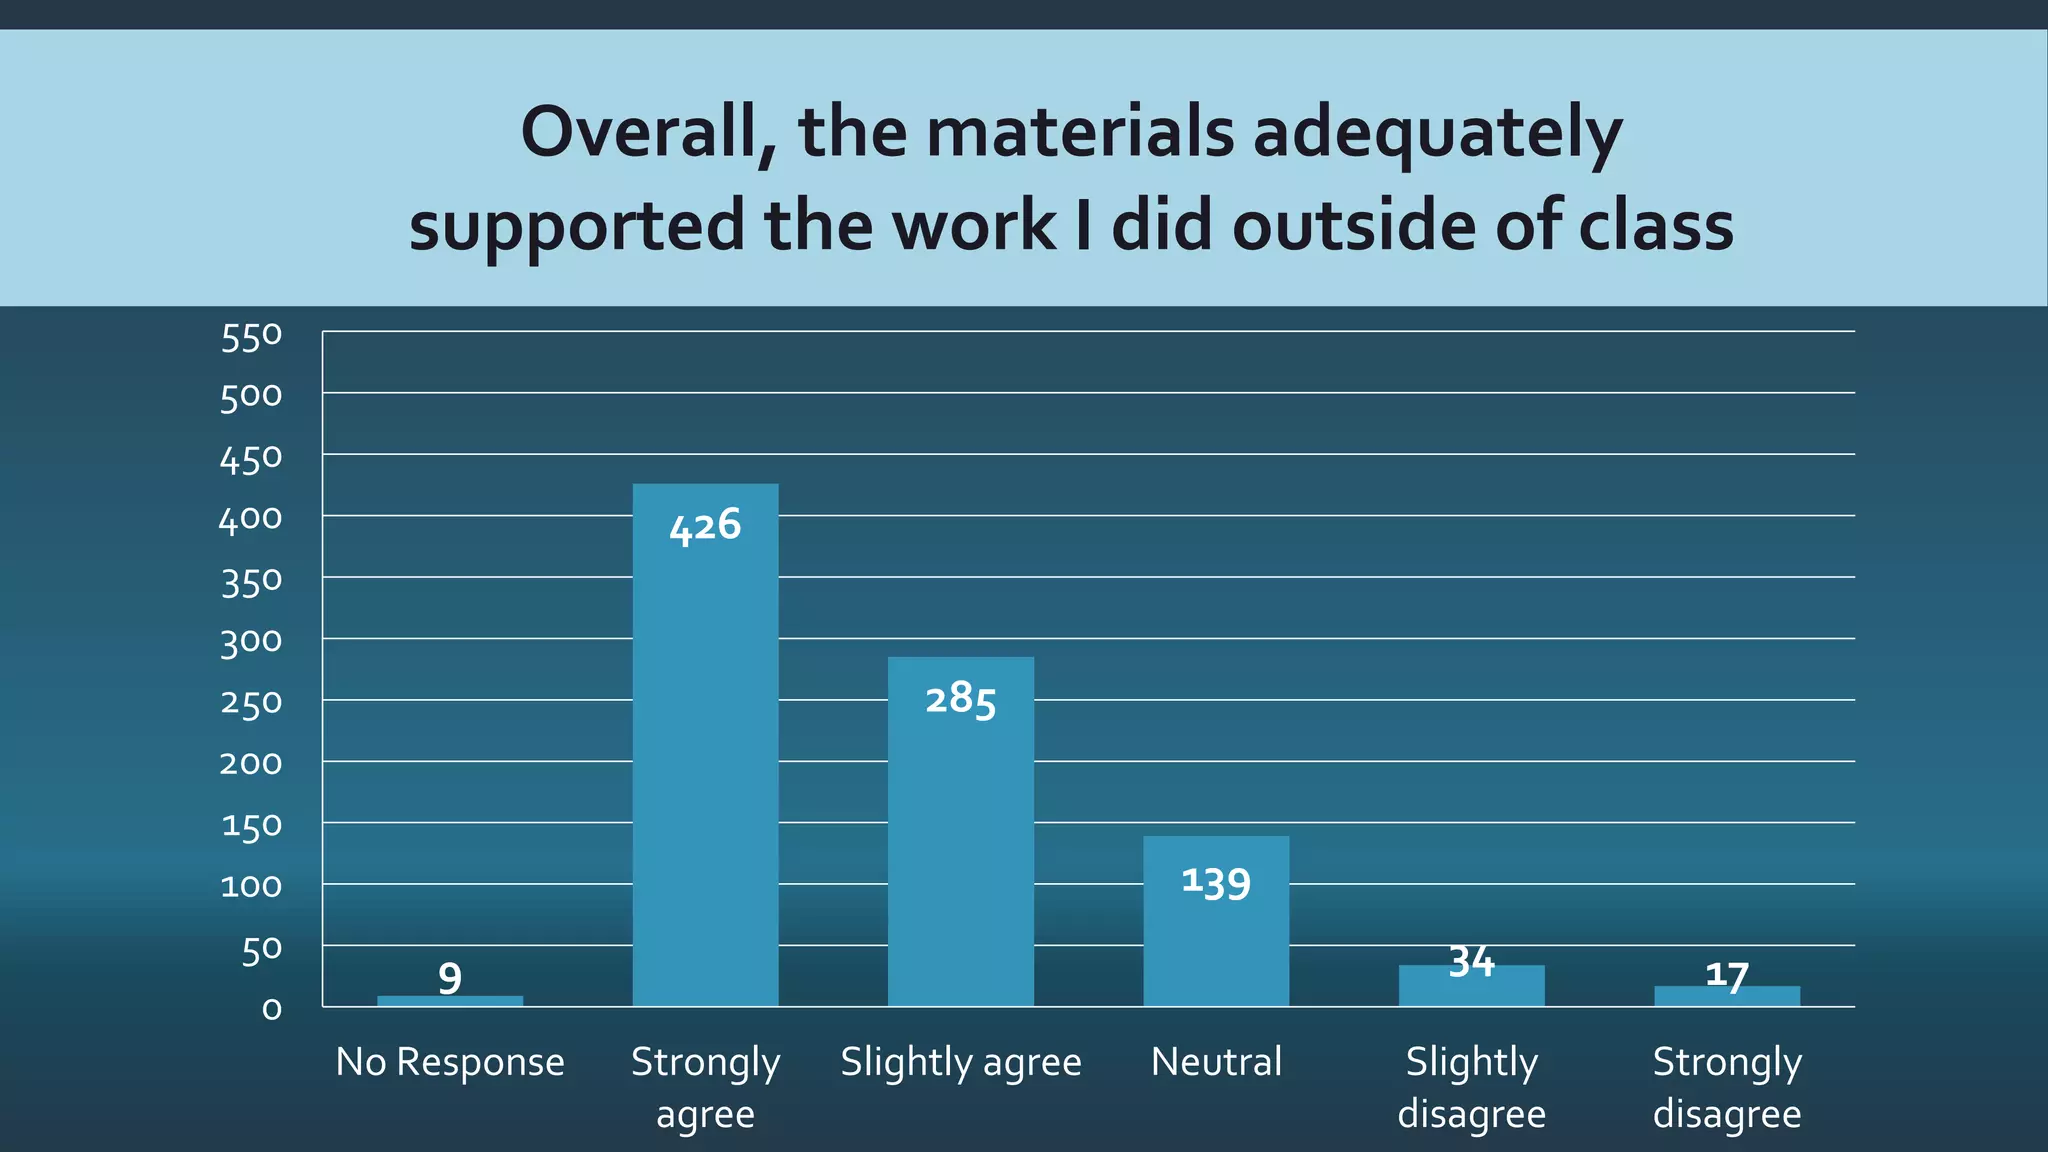
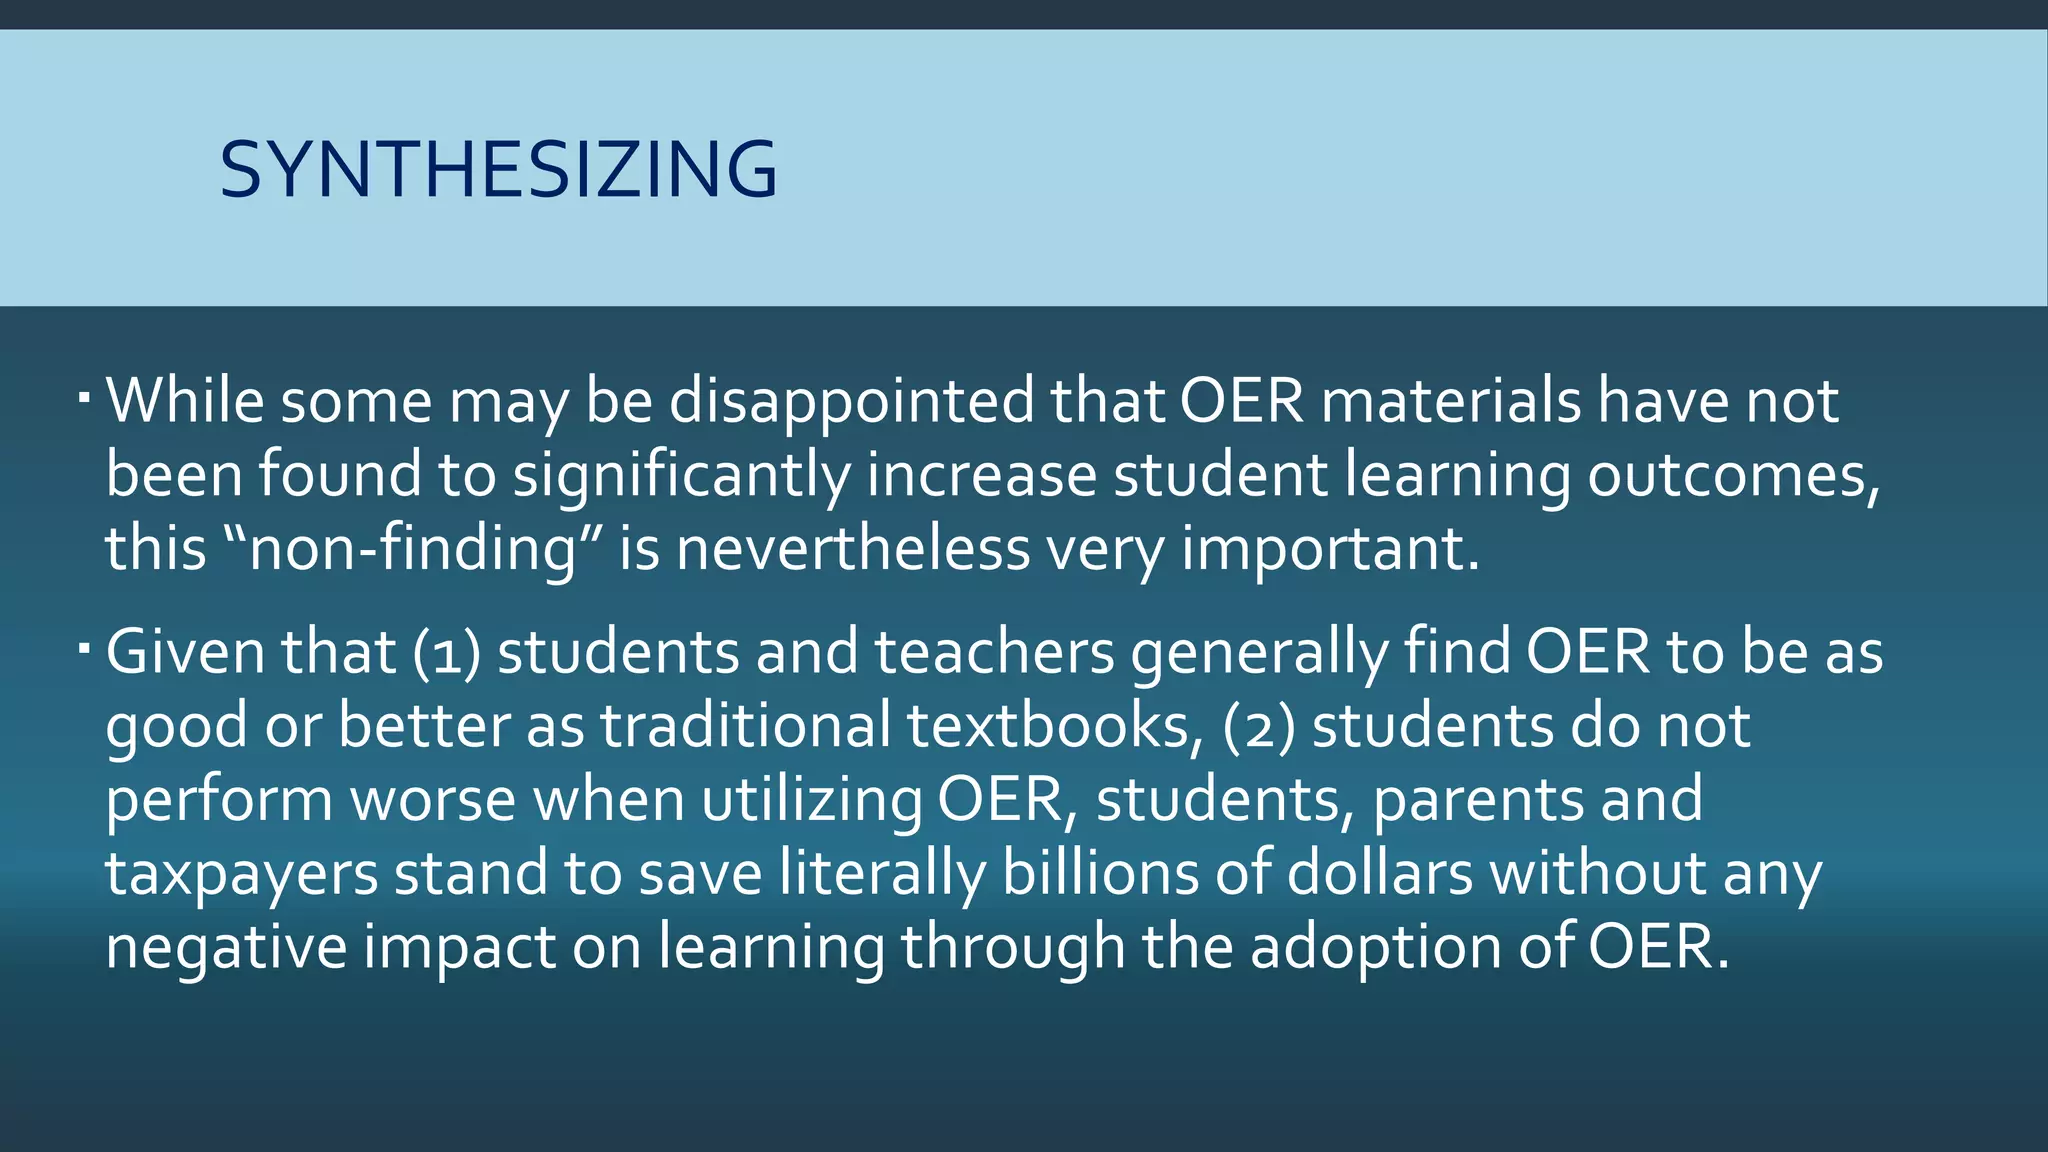
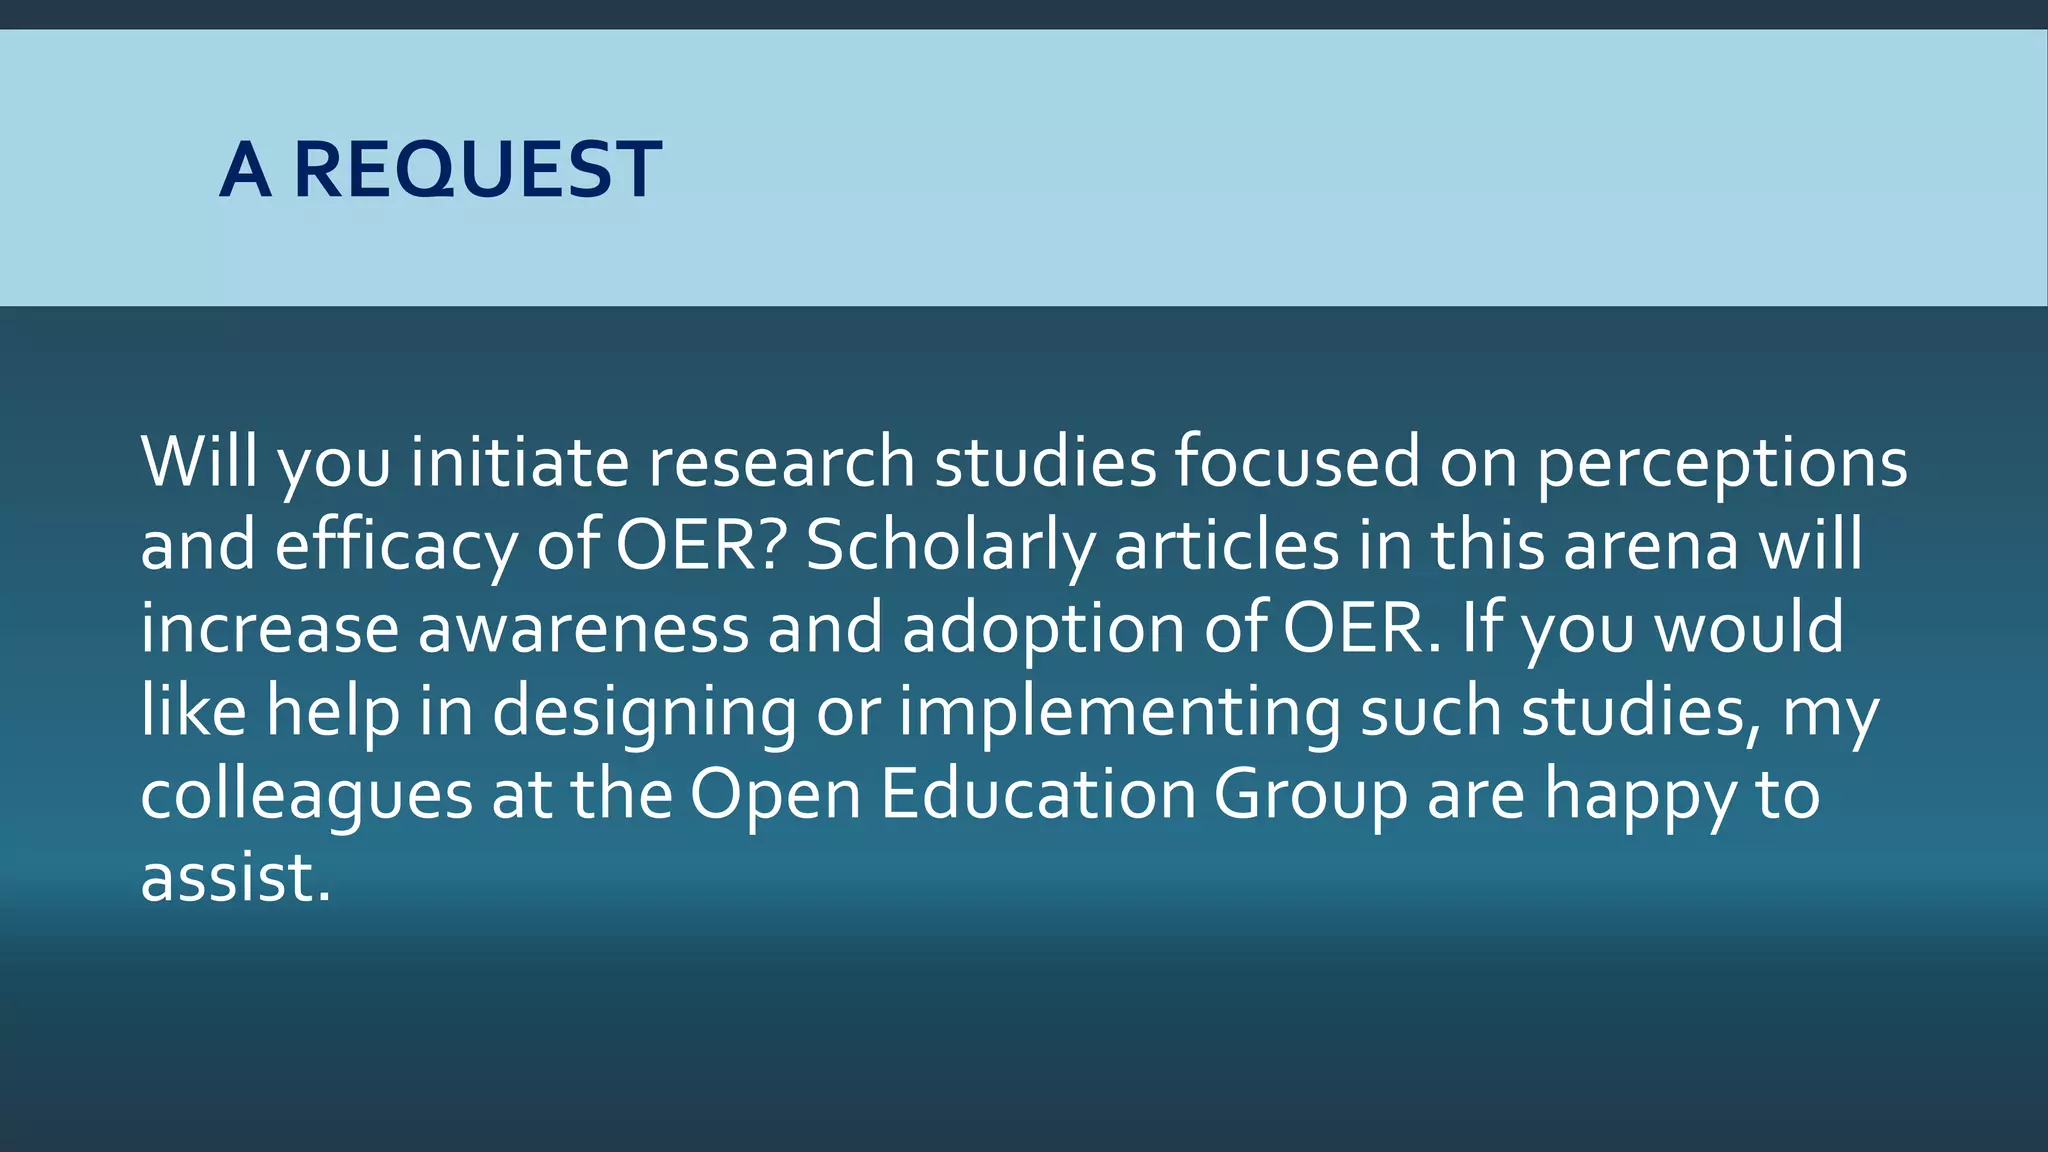
A REVIEW OF RESEARCH ON THE
PERCEPTIONS AND EFFICACY OF
OER (AND A CALL FOR MORE!)
John Hilton III
http://johnhiltoniii.org
Open Education Group
http://openedgroup.org
PROBLEM
A recent nationally representative survey of
2,144 faculty members in the United States
found that “most faculty remain unaware of
OER.”
 Source: Babson 2014 Survey, “Opening theCurriculum.”
POSSIBLE SOLUTIONS
Increasing efforts to “market” OER.
Increasing number of outstanding OER material.
Increasing the number of academic, peer-reviewed
studies regarding the efficacy and teacher and student
perceptions of OER materials.
INCREASINGTHE NUMBER OF ACADEMIC, PEER-REVIEWED
STUDIES REGARDINGTHE EFFICACY ANDTEACHER AND
STUDENT PERCEPTIONS OF OER MATERIALS.
The Babson 2014 survey found that college professors rate
“proven efficacy” and “trusted quality” as the number 1
and number 2 most important criteria for selecting
teaching resources.
PUBLISHED EFFICACY AND PERCEPTION
STUDIES
1. Article focused on efficacy or perception in actual practice (not
simply theory).
2. The resource(s) examined in the study needed to be OER that
were the primary learning resource(s) used in the class.
3. In order to be selected for inclusion in this study, the research
needed to have been published by a peer-reviewed journal, or be
an institutional research report. Blog posts and conference
proceedings were excluded from this data set.
THE BIG PICTURE
Across Eight Different
Academic Studies 3594
Students and Professors
Were Surveyed…
THE BIG PICTURE
*Photo of students courtesy of http://acreelman.blogspot.com/2014_09_01_archive.html
REFERENCES - ONLINE SUMMARY:
HTTP://OPENEDGROUP.ORG/REVIEW
1. Allen, G., Guzman-Alvarez, A., Molinaro, M., Larsen, D. (2015). Assessing the Impact and Efficacy of the Open-Access ChemWiki Textbook Project. Educause Learning Initiative Brief, January 2015. See also this newsletter.
2. Allen, I., Seaman, J. (2014). Opening the Curriculum: Open Educational Resources in U.S. Higher Education, 2014.
3. Bliss, T., Robinson, T. J., Hilton, J., & Wiley, D. (2013). An OER COUP: College teacher and student perceptions of Open Educational Resources. Journal of Interactive Media in Education, 1–25.
4. Bliss, T., Hilton, J., Wiley, D., Thanos, K. (2013). The cost and quality of open textbooks: Perceptions of community college faculty and students. First Monday, 18:1.
5. Bowen, W. G., Chingos, M. M., Lack, K. A., & Nygren, T. I. (2012). Interactive Learning Online at Public Universities: Evidence from Randomized Trials. Ithaka S+R.
6. Bowen, W. G., Chingos, M. M., Lack, K. A., & Nygren, T. I. (2014). Interactive Learning Online at Public Universities: Evidence from a Six‐Campus Randomized Trial. Journal of Policy Analysis and Management, 33(1), 94-111.
7. Feldstein, A., Martin, M., Hudson, A., Warren, K., Hilton, J., & Wiley, D. (2012). Open textbooks and increased student access and outcomes. European Journal of Open, Distance and E-Learning..
8. Gil, P., Candelas, F., Jara, C., Garcia, G., Torres, F (2013). Web-based OERs in Computer Networks. International Journal of Engineering Education, 29(6), 1537-1550. (OA preprint)
9. Hilton, J., Gaudet, D., Clark, P., Robinson, J., & Wiley, D. (2013). The adoption of open educational resources by one community college math department. The International Review of Research in Open and Distance
Learning, 14(4), 37–50.
10. Hilton, J., & Laman, C. (2012). One college’s use of an open psychology textbook. Open Learning: The Journal of Open and Distance Learning, 27(3), 201–217. (Open Repository Preprint).
11. Lindshield, B., & Adhikari, K. (2013). Online and campus college students like using an open educational resource instead of a traditional textbook. Journal of Online Learning & Teaching,9(1), 1–7.
12. Lovett, M., Meyer, O., & Thille, C. (2008). The open learning initiative: Measuring the effectiveness of the OLI statistics course in accelerating student learning. Journal of Interactive Media in Education, 2008 (1).
13. Pawlyshyn, Braddlee, Casper and Miller (2013). Adopting OER: A Case Study of Cross-Institutional Collaboration and Innovation. Educause Review.
14. Petrides, L., Jimes, C., Middleton‐Detzner, C., Walling, J., & Weiss, S. (2011). Open textbook adoption and use: Implications for teachers and learners. Open learning, 26(1), 39-49.
15. Robinson T. J., Fischer, L., Wiley, D. A., & Hilton, J. (2014). The impact of open textbooks on secondary science learning outcomes. Educational Researcher, 43(7): 341-351.
16. Wiley, D., Hilton, J. Ellington, S., and Hall, T. (2012). “A preliminary examination of the cost savings and learning impacts of using open textbooks in middle and high school science classes.” International Review of Research
in Open and Distance Learning. 13 (3), pp. 261-276.
LET’S LOOK AT FOUR OFTHE SIXTEEN
PUBLISHED PERCEPTIONS/EFFICACY STUDIES
Bliss et al., – Perceptions across eight colleges
Hilton et al., – Scottsdale Community College Math
Allen et al., – UC Davis Chemistry
Robinson et al., – Secondary science
KALEIDOSCOPE OPEN COURSE INITIATIVE
The study context is an open education initiative called the
Kaleidoscope Open Course Initiative (KOCI) (http://www.project-
kaleidoscope.org/).This initiative was originally comprised of
eight community colleges serving predominantly at-risk
students (this number has now expanded).These colleges work
together to create courses that replace traditional, expensive
textbooks with OER. During the 2011-2012 academic year, KOCI
impacted over 4,000 students across 80 teachers in a controlled
pilot, with another 5,000 students using KOCI course designs
and materials outside the controlled pilot.
KOCI –TEACHER PERCEPTIONS
58 teachers from 8 KOCI institutions completed
some items on the questionnaire.
Student preparedness. Most teachers (63%) believed
that their students were equally prepared in the
course with PK texts compared to students in the
same course before implementation of KOCI texts
(Figure 3). At the same time, more than a quarter of
teachers (26%) felt that students were more
prepared than students in the same course in the
past. Only 11 percent perceived students as being
less prepared.
KOCITEACHER PERCEPTIONS
58TOTALTEACHERS
26%
63%
11%
0%
10%
20%
30%
40%
50%
60%
70%
More Prepared Equally Prepared Less Prepared
Teachers’ Perceptions of student preparedness after
implementation of KOCITexts
KOCI–TEACHER PERCEPTIONS
Teacher perceptions of quality. Twenty out of 57
(35%) teachers indicated that they thought the
OER textbook was better than texts they had
used previously to teach the course. Only 6 (11%)
felt the OER texts were worse than traditional
texts.The remaining 31(54%) teachers indicated
that their OER texts were of the nearly the same
quality as other texts they had used in the past.
KOCI–TEACHER PERCEPTIONS
57TOTALTEACHERS
35%
54%
11%
0%
10%
20%
30%
40%
50%
60%
Better Quality Equal Quality Worse Quality
Teachers’ perceptions of OER text quality compared to
traditional texts
KOCI – STUDENT PERCEPTIONS
490 students from all eight KOCI institutions
completed the questionnaire. 60% were female.
39% of students indicated that they thought the
OER textbook was better than texts they had used
in other courses. 6% felt the OER texts were worse
and 55% indicated that their OER texts were of the
nearly the same quality as other texts they had
used in the past.
KOCI – STUDENT PERCEPTIONS
490TOTAL STUDENTS
39%
55%
6%
0%
10%
20%
30%
40%
50%
60%
Better Quality Equal Quality Worse Quality
Student Perceptions of KOCITexts compared to traditional texts
KOCI– STUDENT PERCEPTIONS
160 students provided a description of what they
thought made the OER texts better.Their responses
clustered in six major categories: technical advantages
(8%), learning aides (9%), customization (10%), cost
(20%), access (26%), and quality/presentation (27%).
Conversely, 20 students provided a description of what
they thought made the OER texts worse than other
texts they had used in the past.Their responses
clustered in 2 major categories; six students described
technology issues and 15 students took issue with text
quality.
KOCI– STUDENT PERCEPTIONS
SAMPLE SIZES - 160 STUDENTS – BETTER
20 STUDENTS -WORSE
8% 9% 10%
20%
26%
17%
0%
5%
10%
15%
20%
25%
30%
Student descriptions of OER Benefits
6
15
0
2
4
6
8
10
12
14
16
Technology
Issues
Text Quality
Student descriptions of
OER Downsides
LET’S LOOK AT FOUR OFTHE SIXTEEN
PUBLISHED PERCEPTIONS/EFFICACY STUDIES
Bliss et al., – Perceptions across eight colleges
Hilton et al., – Scottsdale Community College Math
Allen et al., – UC Davis Chemistry
Robinson et al., – Secondary science
Text Book and Interactive
Learning Environment Package
provided by Wiley and Pearson
Education
Intermediate Algebra
1352 Students
Publisher Learning
Resources
Introductory
Algebra
1250 Students
$110.26 per Student
$182,086.76 per Semester
College
Algebra
701 Students
SCC’STRANSITIONTO OER
Text Book and Interactive Learning
Environment provided through OER
Introductory
Algebra
1250 Students
College
Algebra
700 Students
Traditional
Copyrighted
Material
Transition
Open
Educational
Resources
Maximum of
$15 per Student
Text Book and Interactive
Learning Environment
provided through OER
86% decrease in costs
RESULTS
Percentage of
Students Earning a C
Grade or Better Fall 2010 Fall 2011 Fall 2012
AT 12x 60%
(n=748)
63%
(n=721)
62%
(n=764)
MAT 15x 65%
(n=448)
64%
(n=388)
65%
(n=461)
MAT 182 56%
(n=106)
61%
(n=109)
58% (n=95)
MAT 187 53% (n=72) 48% (n=82) 55% (n=80)
RESULTS
Completion
Rates Fall 2010 Fall 2011 Fall 2012
MAT 12x 79% (n=748) 76% (n=721) 75% (n=764)
MAT 15x 73% (n=448) 72% (n=388) 76% (n=461)
MAT 182 58% (n=106) 72% (n=109) 72% (n=95)
MAT 187 68% (n=72) 62% (n=82) 64% (n=80)
12
491
263
105
28 11
0
50
100
150
200
250
300
350
400
450
500
550
No Response Strongly
agree
Slightly agree Neutral Slightly
disagree
Strongly
disagree
Overall, the materials adequately
supported the work I did in class
9
426
285
139
34 17
0
50
100
150
200
250
300
350
400
450
500
550
No Response Strongly
agree
Slightly agree Neutral Slightly
disagree
Strongly
disagree
Overall, the materials adequately
supported the work I did outside of class
26
483
210
133
33 25
0
50
100
150
200
250
300
350
400
450
500
550
No Response Strongly
agree
Slightly agree Neutral Slightly
disagree
Strongly
disagree
I would recommend the use of these
materials to my classmates.
“WHAT ADDITIONAL COMMENTS DOYOU HAVE
REGARDINGTHE QUALITY OFTHE OPEN MATERIALS
USED INYOUR CLASS?” (210/255 (82%) POSITIVE)
“They were good. Definitely worth not
having a massed produced book for.”
“I never had an open materials class
before. It made work less stressful and
learning more enjoyable – didn’t
constantly feel frustrated and was able
to look through notes when I got
stuck.”
“The quality was excellent. It really
helped my understanding.”
210
45
0
50
100
150
200
250
Positive Comments Negative Comments
Types of Comments
“WHAT ADDITIONAL COMMENTS DOYOU HAVE
REGARDINGTHE QUALITY OFTHE OPEN MATERIALS
USED INYOUR CLASS?” (210/255 (82%) POSITIVE)
“Buying textbooks is out of date and I think
materials should be inexpensive.”
“I love saving money, I am poor.”
“I like the open materials, textbooks are so
expensive that it makes me not want to buy
them.”
FACULTY RESPONSES
Of the fifteen instructors
who responded to the
question, “Do you feel
that the OER materials
adequately supported the
work that was completed
INSIDE the classroom?
Why or why not?”
thirteen answered “yes,”
13
2
0
2
4
6
8
10
12
14
Yes No
Did OER materials adequately
support work INSIDE the Classroom?
FACULTY RESPONSES
Similarly, of the fifteen instructors who responded to the
question, “Do you feel that the OER materials adequately
supported the work that was completedOUTSIDE the
classroom?Why or why not?” thirteen answered “yes.”
Sample responses are “Yes.These materials provided the
students useful resources” and “Yes. It focused in the lesson
well.”The remaining two responses were “Mostly - often
students had online questions, which were discussed
through MathAS or in class” and “In Math 12x, the online HW
contained questions that were not written in the style of the
workbook questions. Some students had difficulty in
transferring their skills to the online questions.”
FACULTY RESPONSE
13
2
0
2
4
6
8
10
12
14
Yes No
Did OER materials adequately support work OUTSIDE of
the Classroom?
LET’S LOOK AT FOUR OFTHE SIXTEEN
PUBLISHED PERCEPTIONS/EFFICACY STUDIES
Bliss et al., – Perceptions across eight colleges
Hilton et al., – Scottsdale Community College Math
Allen et al., – UC Davis Chemistry
Robinson et al., – Secondary science
STUDY DESCRIPTION
Researcher at UC-Davis designed an experiment in which an
experimental class of 478 students used the OERChemWiki
as its primary textbook, while the control class of 448
utilized a commercial textbook.The two sections were
taught the same semester at back-to-back times using the
same faculty member and teaching assistants. Identical
lectures were used in each section. Students in both sections
were given the same midterm and final exams.
STUDY RESULTS
Researchers found no significant differences
between the two groups both with overall
exam results and item-specific questions.
Beginning of the semester pre-tests,
combined with final exams showed no
significant differences in individual learning
gains between the two groups. Student
surveys regarding time spent on the class
found that students in both groups spent
approximately the same amount of time
preparing for class.
ChemWiki Group Control Group
Test Scores
Learning
Gains
Pre-Class
Preparation
Time
Test Scores
Learning
Gains
Pre-Class
Preparation
Time
LET’S LOOK AT FOUR OFTHE SIXTEEN
PUBLISHED PERCEPTIONS/EFFICACY STUDIES
Bliss et al., – Perceptions across eight colleges
Hilton et al., – Scottsdale Community College Math
Allen et al., – UC Davis Chemistry
Robinson et al., – Secondary science
DESIGN
Quasi-experimental ex post facto comparison of group
differences in terms of year-end standardized science
CRT scores.
POTENTIAL CONFOUNDS
SPED
ELP
Previous Science
Achievement
GeneralAcademic
Achievement
SES
Gender
Age
Course (Chemistry, Earth
Science, Biology)
Teacher Effect
Selection Bias
ANDWHAT ABOUTTEACHER EFFECT?
Isn’t it possible that the teacher that are competent
enough to develop their own materials are actually
more competent as teachers in general?
Textbooks and teachers are completely confounded.
Textbook may be a complete surrogate for teacher
effect.
CONTROLLING FORTEACHER EFFECT
Consider previous achievement of students as an
indication of general teacher effectiveness.
Create a standardized value of teacher effectiveness.
Use standardized value as a covariate control.
PROPENSITY SCORE MATCHING
Using available covariates, match individual treatment
subjects to subjects in a larger pool of possible controls.
UnmatchedTreatment Pool: n = 1612
Unmatched Control Pool: n = 2168
MatchedTreatment: n = 1274
MatchedControl: n = 1274
MatchedTotal: n = 2548
MATCHED SAMPLES
Matched
Control
Matched
Treatment
Matched
Total
Number of students 1274 1274 2548
Mean age 15.99 15.98 15.99
Percentage of Female Students 50.08% 49.69% 49.88%
Percentage of Male Students 49.92% 50.31% 50.12%
Percentage of ESL Students 0.94% 1.02% 0.98%
Percentage of Asian Students 0.31% 0.23% 0.27%
Percentage of Black Students 0.47% 0.31% 0.39%
Percentage of White Students 88.30% 87.52% 87.91%
Percentage of Hispanic Students 8.30% 9.50% 8.90%
Percentage of Native American Students 0.55% 0.63% 0.59%
Percentage of Pacific Islander Students 0.78% 0.86% 0.82%
Percentage of Multi-race Students 1.20% 0.94% 1.10%
Percentage of 9th Graders 39.08% 39.80% 39.44%
Percentage of 10th Graders 44.82% 44.98% 44.90%
Percentage of 11th Graders 15.54% 14.68% 15.11%
Percentage of 12th Graders 0.55% 0.55% 0.55%
Special Education 6.99% 7.22% 7.10%
Mean GPA 3.44 3.40 3.42
Percentage of Students in Biology 38.14% 39.17% 38.66%
Percentage of Students in Chemistry 34.30% 32.65% 33.48%
Percentage of Students in Earth Systems 27.55 28.18% 27.86%
PROPENSITY SCORE MATCHED SAMPLES
FINAL RESULTS
Simultaneous Regression of 2012 Scaled Scores
Predictor Estimate S.E. t
Intercept 57.01 5.12 11.13 ***
Treatment 0.65 0.24 2.67 **
2011 GPA -1.64 0.23 7.25 ***
2012 CRT1
Chemistry -6.59 1.01 -6.53 ***
Earth Science 3.94 0.53 7.44 ***
2011 CRT1
Chemistry 3.91 2.51 1.56
Earth Science -2.88 1.02 -2.83 **
Physics 5.1 0.89 5.75 ***
8th
Grade Science -5.96 1.17 -5.08 ***
2011 Scaled Score 0.68 0.15 44.42 ***
Gender2
1.16 0.24 4.84 ***
Age -0.49 0.26 -1.91
English Language Proficiency -3.86 1.18 -3.27 **
Special Education3
-1.73 0.48 -3.62 ***
Free and Reduced Lunch4
-0.31 0.26 -1.19
Teacher Effect 2.26 0.19 11.45 ***
* p< .05 **p<.01 ***p<.001
1
The dummy coded reference group for both the 2012 and 2011 CRTs is those who took the
biology test.
2
The dummy coded reference group for Gender is Female.
3
The dummy coded reference group for Special Education is Not Special Education.
4
The dummy coded reference group for Free-and-Reduced Lunch is Not Free-and-Reduced
Lunch.
CONCLUSION
There was a small but statistically significant difference
between students using traditional classroom sets of
textbooks and students using teacher developed
individual textbooks in terms of achievement as
measured by standardized year-end science CRT scores.
Even after controlling for multiple confounds, students
using teacher-developed open textbooks performed
better than control group students.
SYNTHESIZING
While some may be disappointed that OER materials have not
been found to significantly increase student learning outcomes,
this “non-finding” is nevertheless very important.
Given that (1) students and teachers generally find OER to be as
good or better as traditional textbooks, (2) students do not
perform worse when utilizing OER, students, parents and
taxpayers stand to save literally billions of dollars without any
negative impact on learning through the adoption of OER.
A REQUEST
Will you initiate research studies focused on perceptions
and efficacy of OER? Scholarly articles in this arena will
increase awareness and adoption of OER. If you would
like help in designing or implementing such studies, my
colleagues at the Open Education Group are happy to
assist.
A REVIEW OF RESEARCH ON THE
PERCEPTIONS AND EFFICACY OF
OER (AND A CALL FOR MORE!)
John Hilton III
http://johnhiltoniii.org
Open Education Group
http://openedgroup.org

Summary of efficacy studies May 2015 - OpenCon Community Webcasts

  • 1.
    A REVIEW OFRESEARCH ON THE PERCEPTIONS AND EFFICACY OF OER (AND A CALL FOR MORE!) John Hilton III http://johnhiltoniii.org Open Education Group http://openedgroup.org
  • 2.
    PROBLEM A recent nationallyrepresentative survey of 2,144 faculty members in the United States found that “most faculty remain unaware of OER.”  Source: Babson 2014 Survey, “Opening theCurriculum.”
  • 3.
    POSSIBLE SOLUTIONS Increasing effortsto “market” OER. Increasing number of outstanding OER material. Increasing the number of academic, peer-reviewed studies regarding the efficacy and teacher and student perceptions of OER materials.
  • 4.
    INCREASINGTHE NUMBER OFACADEMIC, PEER-REVIEWED STUDIES REGARDINGTHE EFFICACY ANDTEACHER AND STUDENT PERCEPTIONS OF OER MATERIALS. The Babson 2014 survey found that college professors rate “proven efficacy” and “trusted quality” as the number 1 and number 2 most important criteria for selecting teaching resources.
  • 5.
    PUBLISHED EFFICACY ANDPERCEPTION STUDIES 1. Article focused on efficacy or perception in actual practice (not simply theory). 2. The resource(s) examined in the study needed to be OER that were the primary learning resource(s) used in the class. 3. In order to be selected for inclusion in this study, the research needed to have been published by a peer-reviewed journal, or be an institutional research report. Blog posts and conference proceedings were excluded from this data set.
  • 6.
    THE BIG PICTURE AcrossEight Different Academic Studies 3594 Students and Professors Were Surveyed…
  • 7.
    THE BIG PICTURE *Photoof students courtesy of http://acreelman.blogspot.com/2014_09_01_archive.html
  • 8.
    REFERENCES - ONLINESUMMARY: HTTP://OPENEDGROUP.ORG/REVIEW 1. Allen, G., Guzman-Alvarez, A., Molinaro, M., Larsen, D. (2015). Assessing the Impact and Efficacy of the Open-Access ChemWiki Textbook Project. Educause Learning Initiative Brief, January 2015. See also this newsletter. 2. Allen, I., Seaman, J. (2014). Opening the Curriculum: Open Educational Resources in U.S. Higher Education, 2014. 3. Bliss, T., Robinson, T. J., Hilton, J., & Wiley, D. (2013). An OER COUP: College teacher and student perceptions of Open Educational Resources. Journal of Interactive Media in Education, 1–25. 4. Bliss, T., Hilton, J., Wiley, D., Thanos, K. (2013). The cost and quality of open textbooks: Perceptions of community college faculty and students. First Monday, 18:1. 5. Bowen, W. G., Chingos, M. M., Lack, K. A., & Nygren, T. I. (2012). Interactive Learning Online at Public Universities: Evidence from Randomized Trials. Ithaka S+R. 6. Bowen, W. G., Chingos, M. M., Lack, K. A., & Nygren, T. I. (2014). Interactive Learning Online at Public Universities: Evidence from a Six‐Campus Randomized Trial. Journal of Policy Analysis and Management, 33(1), 94-111. 7. Feldstein, A., Martin, M., Hudson, A., Warren, K., Hilton, J., & Wiley, D. (2012). Open textbooks and increased student access and outcomes. European Journal of Open, Distance and E-Learning.. 8. Gil, P., Candelas, F., Jara, C., Garcia, G., Torres, F (2013). Web-based OERs in Computer Networks. International Journal of Engineering Education, 29(6), 1537-1550. (OA preprint) 9. Hilton, J., Gaudet, D., Clark, P., Robinson, J., & Wiley, D. (2013). The adoption of open educational resources by one community college math department. The International Review of Research in Open and Distance Learning, 14(4), 37–50. 10. Hilton, J., & Laman, C. (2012). One college’s use of an open psychology textbook. Open Learning: The Journal of Open and Distance Learning, 27(3), 201–217. (Open Repository Preprint). 11. Lindshield, B., & Adhikari, K. (2013). Online and campus college students like using an open educational resource instead of a traditional textbook. Journal of Online Learning & Teaching,9(1), 1–7. 12. Lovett, M., Meyer, O., & Thille, C. (2008). The open learning initiative: Measuring the effectiveness of the OLI statistics course in accelerating student learning. Journal of Interactive Media in Education, 2008 (1). 13. Pawlyshyn, Braddlee, Casper and Miller (2013). Adopting OER: A Case Study of Cross-Institutional Collaboration and Innovation. Educause Review. 14. Petrides, L., Jimes, C., Middleton‐Detzner, C., Walling, J., & Weiss, S. (2011). Open textbook adoption and use: Implications for teachers and learners. Open learning, 26(1), 39-49. 15. Robinson T. J., Fischer, L., Wiley, D. A., & Hilton, J. (2014). The impact of open textbooks on secondary science learning outcomes. Educational Researcher, 43(7): 341-351. 16. Wiley, D., Hilton, J. Ellington, S., and Hall, T. (2012). “A preliminary examination of the cost savings and learning impacts of using open textbooks in middle and high school science classes.” International Review of Research in Open and Distance Learning. 13 (3), pp. 261-276.
  • 9.
    LET’S LOOK ATFOUR OFTHE SIXTEEN PUBLISHED PERCEPTIONS/EFFICACY STUDIES Bliss et al., – Perceptions across eight colleges Hilton et al., – Scottsdale Community College Math Allen et al., – UC Davis Chemistry Robinson et al., – Secondary science
  • 10.
    KALEIDOSCOPE OPEN COURSEINITIATIVE The study context is an open education initiative called the Kaleidoscope Open Course Initiative (KOCI) (http://www.project- kaleidoscope.org/).This initiative was originally comprised of eight community colleges serving predominantly at-risk students (this number has now expanded).These colleges work together to create courses that replace traditional, expensive textbooks with OER. During the 2011-2012 academic year, KOCI impacted over 4,000 students across 80 teachers in a controlled pilot, with another 5,000 students using KOCI course designs and materials outside the controlled pilot.
  • 11.
    KOCI –TEACHER PERCEPTIONS 58teachers from 8 KOCI institutions completed some items on the questionnaire. Student preparedness. Most teachers (63%) believed that their students were equally prepared in the course with PK texts compared to students in the same course before implementation of KOCI texts (Figure 3). At the same time, more than a quarter of teachers (26%) felt that students were more prepared than students in the same course in the past. Only 11 percent perceived students as being less prepared.
  • 12.
    KOCITEACHER PERCEPTIONS 58TOTALTEACHERS 26% 63% 11% 0% 10% 20% 30% 40% 50% 60% 70% More PreparedEqually Prepared Less Prepared Teachers’ Perceptions of student preparedness after implementation of KOCITexts
  • 13.
    KOCI–TEACHER PERCEPTIONS Teacher perceptionsof quality. Twenty out of 57 (35%) teachers indicated that they thought the OER textbook was better than texts they had used previously to teach the course. Only 6 (11%) felt the OER texts were worse than traditional texts.The remaining 31(54%) teachers indicated that their OER texts were of the nearly the same quality as other texts they had used in the past.
  • 14.
    KOCI–TEACHER PERCEPTIONS 57TOTALTEACHERS 35% 54% 11% 0% 10% 20% 30% 40% 50% 60% Better QualityEqual Quality Worse Quality Teachers’ perceptions of OER text quality compared to traditional texts
  • 15.
    KOCI – STUDENTPERCEPTIONS 490 students from all eight KOCI institutions completed the questionnaire. 60% were female. 39% of students indicated that they thought the OER textbook was better than texts they had used in other courses. 6% felt the OER texts were worse and 55% indicated that their OER texts were of the nearly the same quality as other texts they had used in the past.
  • 16.
    KOCI – STUDENTPERCEPTIONS 490TOTAL STUDENTS 39% 55% 6% 0% 10% 20% 30% 40% 50% 60% Better Quality Equal Quality Worse Quality Student Perceptions of KOCITexts compared to traditional texts
  • 17.
    KOCI– STUDENT PERCEPTIONS 160students provided a description of what they thought made the OER texts better.Their responses clustered in six major categories: technical advantages (8%), learning aides (9%), customization (10%), cost (20%), access (26%), and quality/presentation (27%). Conversely, 20 students provided a description of what they thought made the OER texts worse than other texts they had used in the past.Their responses clustered in 2 major categories; six students described technology issues and 15 students took issue with text quality.
  • 18.
    KOCI– STUDENT PERCEPTIONS SAMPLESIZES - 160 STUDENTS – BETTER 20 STUDENTS -WORSE 8% 9% 10% 20% 26% 17% 0% 5% 10% 15% 20% 25% 30% Student descriptions of OER Benefits 6 15 0 2 4 6 8 10 12 14 16 Technology Issues Text Quality Student descriptions of OER Downsides
  • 19.
    LET’S LOOK ATFOUR OFTHE SIXTEEN PUBLISHED PERCEPTIONS/EFFICACY STUDIES Bliss et al., – Perceptions across eight colleges Hilton et al., – Scottsdale Community College Math Allen et al., – UC Davis Chemistry Robinson et al., – Secondary science
  • 20.
    Text Book andInteractive Learning Environment Package provided by Wiley and Pearson Education Intermediate Algebra 1352 Students Publisher Learning Resources Introductory Algebra 1250 Students $110.26 per Student $182,086.76 per Semester College Algebra 701 Students SCC’STRANSITIONTO OER
  • 21.
    Text Book andInteractive Learning Environment provided through OER Introductory Algebra 1250 Students College Algebra 700 Students Traditional Copyrighted Material Transition Open Educational Resources Maximum of $15 per Student Text Book and Interactive Learning Environment provided through OER 86% decrease in costs
  • 22.
    RESULTS Percentage of Students Earninga C Grade or Better Fall 2010 Fall 2011 Fall 2012 AT 12x 60% (n=748) 63% (n=721) 62% (n=764) MAT 15x 65% (n=448) 64% (n=388) 65% (n=461) MAT 182 56% (n=106) 61% (n=109) 58% (n=95) MAT 187 53% (n=72) 48% (n=82) 55% (n=80)
  • 23.
    RESULTS Completion Rates Fall 2010Fall 2011 Fall 2012 MAT 12x 79% (n=748) 76% (n=721) 75% (n=764) MAT 15x 73% (n=448) 72% (n=388) 76% (n=461) MAT 182 58% (n=106) 72% (n=109) 72% (n=95) MAT 187 68% (n=72) 62% (n=82) 64% (n=80)
  • 24.
    12 491 263 105 28 11 0 50 100 150 200 250 300 350 400 450 500 550 No ResponseStrongly agree Slightly agree Neutral Slightly disagree Strongly disagree Overall, the materials adequately supported the work I did in class
  • 25.
    9 426 285 139 34 17 0 50 100 150 200 250 300 350 400 450 500 550 No ResponseStrongly agree Slightly agree Neutral Slightly disagree Strongly disagree Overall, the materials adequately supported the work I did outside of class
  • 26.
    26 483 210 133 33 25 0 50 100 150 200 250 300 350 400 450 500 550 No ResponseStrongly agree Slightly agree Neutral Slightly disagree Strongly disagree I would recommend the use of these materials to my classmates.
  • 27.
    “WHAT ADDITIONAL COMMENTSDOYOU HAVE REGARDINGTHE QUALITY OFTHE OPEN MATERIALS USED INYOUR CLASS?” (210/255 (82%) POSITIVE) “They were good. Definitely worth not having a massed produced book for.” “I never had an open materials class before. It made work less stressful and learning more enjoyable – didn’t constantly feel frustrated and was able to look through notes when I got stuck.” “The quality was excellent. It really helped my understanding.” 210 45 0 50 100 150 200 250 Positive Comments Negative Comments Types of Comments
  • 28.
    “WHAT ADDITIONAL COMMENTSDOYOU HAVE REGARDINGTHE QUALITY OFTHE OPEN MATERIALS USED INYOUR CLASS?” (210/255 (82%) POSITIVE) “Buying textbooks is out of date and I think materials should be inexpensive.” “I love saving money, I am poor.” “I like the open materials, textbooks are so expensive that it makes me not want to buy them.”
  • 29.
    FACULTY RESPONSES Of thefifteen instructors who responded to the question, “Do you feel that the OER materials adequately supported the work that was completed INSIDE the classroom? Why or why not?” thirteen answered “yes,” 13 2 0 2 4 6 8 10 12 14 Yes No Did OER materials adequately support work INSIDE the Classroom?
  • 30.
    FACULTY RESPONSES Similarly, ofthe fifteen instructors who responded to the question, “Do you feel that the OER materials adequately supported the work that was completedOUTSIDE the classroom?Why or why not?” thirteen answered “yes.” Sample responses are “Yes.These materials provided the students useful resources” and “Yes. It focused in the lesson well.”The remaining two responses were “Mostly - often students had online questions, which were discussed through MathAS or in class” and “In Math 12x, the online HW contained questions that were not written in the style of the workbook questions. Some students had difficulty in transferring their skills to the online questions.”
  • 31.
    FACULTY RESPONSE 13 2 0 2 4 6 8 10 12 14 Yes No DidOER materials adequately support work OUTSIDE of the Classroom?
  • 32.
    LET’S LOOK ATFOUR OFTHE SIXTEEN PUBLISHED PERCEPTIONS/EFFICACY STUDIES Bliss et al., – Perceptions across eight colleges Hilton et al., – Scottsdale Community College Math Allen et al., – UC Davis Chemistry Robinson et al., – Secondary science
  • 33.
    STUDY DESCRIPTION Researcher atUC-Davis designed an experiment in which an experimental class of 478 students used the OERChemWiki as its primary textbook, while the control class of 448 utilized a commercial textbook.The two sections were taught the same semester at back-to-back times using the same faculty member and teaching assistants. Identical lectures were used in each section. Students in both sections were given the same midterm and final exams.
  • 34.
    STUDY RESULTS Researchers foundno significant differences between the two groups both with overall exam results and item-specific questions. Beginning of the semester pre-tests, combined with final exams showed no significant differences in individual learning gains between the two groups. Student surveys regarding time spent on the class found that students in both groups spent approximately the same amount of time preparing for class. ChemWiki Group Control Group Test Scores Learning Gains Pre-Class Preparation Time Test Scores Learning Gains Pre-Class Preparation Time
  • 36.
    LET’S LOOK ATFOUR OFTHE SIXTEEN PUBLISHED PERCEPTIONS/EFFICACY STUDIES Bliss et al., – Perceptions across eight colleges Hilton et al., – Scottsdale Community College Math Allen et al., – UC Davis Chemistry Robinson et al., – Secondary science
  • 37.
    DESIGN Quasi-experimental ex postfacto comparison of group differences in terms of year-end standardized science CRT scores.
  • 38.
  • 39.
    ANDWHAT ABOUTTEACHER EFFECT? Isn’tit possible that the teacher that are competent enough to develop their own materials are actually more competent as teachers in general? Textbooks and teachers are completely confounded. Textbook may be a complete surrogate for teacher effect.
  • 40.
    CONTROLLING FORTEACHER EFFECT Considerprevious achievement of students as an indication of general teacher effectiveness. Create a standardized value of teacher effectiveness. Use standardized value as a covariate control.
  • 41.
    PROPENSITY SCORE MATCHING Usingavailable covariates, match individual treatment subjects to subjects in a larger pool of possible controls. UnmatchedTreatment Pool: n = 1612 Unmatched Control Pool: n = 2168 MatchedTreatment: n = 1274 MatchedControl: n = 1274 MatchedTotal: n = 2548
  • 42.
    MATCHED SAMPLES Matched Control Matched Treatment Matched Total Number ofstudents 1274 1274 2548 Mean age 15.99 15.98 15.99 Percentage of Female Students 50.08% 49.69% 49.88% Percentage of Male Students 49.92% 50.31% 50.12% Percentage of ESL Students 0.94% 1.02% 0.98% Percentage of Asian Students 0.31% 0.23% 0.27% Percentage of Black Students 0.47% 0.31% 0.39% Percentage of White Students 88.30% 87.52% 87.91% Percentage of Hispanic Students 8.30% 9.50% 8.90% Percentage of Native American Students 0.55% 0.63% 0.59% Percentage of Pacific Islander Students 0.78% 0.86% 0.82% Percentage of Multi-race Students 1.20% 0.94% 1.10% Percentage of 9th Graders 39.08% 39.80% 39.44% Percentage of 10th Graders 44.82% 44.98% 44.90% Percentage of 11th Graders 15.54% 14.68% 15.11% Percentage of 12th Graders 0.55% 0.55% 0.55% Special Education 6.99% 7.22% 7.10% Mean GPA 3.44 3.40 3.42 Percentage of Students in Biology 38.14% 39.17% 38.66% Percentage of Students in Chemistry 34.30% 32.65% 33.48% Percentage of Students in Earth Systems 27.55 28.18% 27.86%
  • 43.
  • 44.
    FINAL RESULTS Simultaneous Regressionof 2012 Scaled Scores Predictor Estimate S.E. t Intercept 57.01 5.12 11.13 *** Treatment 0.65 0.24 2.67 ** 2011 GPA -1.64 0.23 7.25 *** 2012 CRT1 Chemistry -6.59 1.01 -6.53 *** Earth Science 3.94 0.53 7.44 *** 2011 CRT1 Chemistry 3.91 2.51 1.56 Earth Science -2.88 1.02 -2.83 ** Physics 5.1 0.89 5.75 *** 8th Grade Science -5.96 1.17 -5.08 *** 2011 Scaled Score 0.68 0.15 44.42 *** Gender2 1.16 0.24 4.84 *** Age -0.49 0.26 -1.91 English Language Proficiency -3.86 1.18 -3.27 ** Special Education3 -1.73 0.48 -3.62 *** Free and Reduced Lunch4 -0.31 0.26 -1.19 Teacher Effect 2.26 0.19 11.45 *** * p< .05 **p<.01 ***p<.001 1 The dummy coded reference group for both the 2012 and 2011 CRTs is those who took the biology test. 2 The dummy coded reference group for Gender is Female. 3 The dummy coded reference group for Special Education is Not Special Education. 4 The dummy coded reference group for Free-and-Reduced Lunch is Not Free-and-Reduced Lunch.
  • 45.
    CONCLUSION There was asmall but statistically significant difference between students using traditional classroom sets of textbooks and students using teacher developed individual textbooks in terms of achievement as measured by standardized year-end science CRT scores. Even after controlling for multiple confounds, students using teacher-developed open textbooks performed better than control group students.
  • 46.
    SYNTHESIZING While some maybe disappointed that OER materials have not been found to significantly increase student learning outcomes, this “non-finding” is nevertheless very important. Given that (1) students and teachers generally find OER to be as good or better as traditional textbooks, (2) students do not perform worse when utilizing OER, students, parents and taxpayers stand to save literally billions of dollars without any negative impact on learning through the adoption of OER.
  • 47.
    A REQUEST Will youinitiate research studies focused on perceptions and efficacy of OER? Scholarly articles in this arena will increase awareness and adoption of OER. If you would like help in designing or implementing such studies, my colleagues at the Open Education Group are happy to assist.
  • 48.
    A REVIEW OFRESEARCH ON THE PERCEPTIONS AND EFFICACY OF OER (AND A CALL FOR MORE!) John Hilton III http://johnhiltoniii.org Open Education Group http://openedgroup.org

Editor's Notes

  • #8 Photo of students courtesy of http://acreelman.blogspot.com/2014_09_01_archive.html
  • #9 Don’t worry about the small font on this slide.
  • #12 Jaron – again, please make a graph that supports this. - see the below slide with bar charts for an example
  • #14 Jaron – again, please make a graph that supports this. - see the below slide with bar charts for an example
  • #16 Jaron – again, please make a graph that supports this. - see the below slide with bar charts for an example
  • #18 Jaron – again, please make a graph that supports this. - see the below slide with bar charts for an example
  • #28 JARON – COULD YOU MAKE SOME BAR GRAPHS TO SHOW THE 210/255 WERE POSTIVE – NEED TO VISUALIZE THIS. Any graph on a page with text I added with an animation to show it coming in.
  • #30 Jaron – again, please make a graph that supports this.
  • #31 Jaron – again, please make a graph that supports this.
  • #34 Jaron Any graphical work you could do with this one would be great.
  • #35 Does this work as a graphic? I kind of liked the idea of a balance to represent the results of this study. It made be a little redundant but I think it is a good image.
  • #36 This could be used as a visual in the previous slide – or perhaps part of this could be zoomed in on to make the key parts like the title or the “call out” quote more visible I added an animation that will fade out the article and then isolate the call out text and the title.