2. 2212 Circulation November 12, 2013
neighboring cells expressing the Eph receptors.11,12
EphA2
is preferentially expressed in immature hCPCs, whereas the
corresponding ligand, ephrin A1, is distributed on the plasma
membrane of myocytes,10
which act as supporting cells within
the stem cell niches.13
EphA2 downregulation abrogates the binding of hCPCs
to ephrin A1 and interferes with ephrin A1–induced motility,
documenting that EphA2 operates as a primary receptor for
ephrin A1 ligand in this progenitor cell class.10
Importantly,
EphA2 blockade inhibits the motile response of young hCPCs
to hepatocyte growth factor (HGF),10
a powerful chemoattrac-
tant implicated in CPC mobilization.4,14,15
Thus, EphA2 plays
a key role in hCPC trafficking and alterations in ephrin A1/
EphA2 signaling may cause defects in the migration of old
hCPCs. In the present study, we tested whether decreased
function of the EphA2 receptor conditions the loss of move-
ment in senescent hCPCs, offering a molecular target for the
restoration of the motile state in aging cells.
Methods
A detailed description of the methods used in this study is provided in
the online-only Data Supplement.
Human CPCs
hCPCs were isolated from discarded myocardial tissue of subjects
35-78 years of age and were cultured ex vivo as previously described
(IRB protocol 2010P002475).10,16
To induce replicative senescence,
hCPCs were expanded for 4–7 passages (P) and further propagated
till P11-P15. Stress-induced senescence was achieved by 18-hr expo-
sure of hCPCs at P4-P7 to 0.5 µmol/L doxorubicin (Sigma; Figure I
in the online-only Data Supplement).
Immunofluorescence and Confocal Microscopy
Analysis
Indirect immunolabeling of hCPCs was performed after fixation and
permeabilization.4,10,16–18
The list of primary antibodies and secondary
reagents, as well as the details of the protocol, are provided in the
Methods of the online-only Data Supplement.
Immunoprecipitation, Immunoblotting, and
2-Dimensional Gel Analysis
For these assays, protein extracts were obtained from whole myocar-
dium and total cell lysates of young and old hCPCs.
Flow-Cytometry Studies
The expression of EphA2 and c-Met on the plasma membrane of
hCPCs was determined by flow-cytometry. Telomere length in hCPCs
was measured by flow-cytometry and fluorescence in situ hybridiza-
tion (Flow-FISH), following a previously published protocol.19,20
Transwell Migration
Spontaneous motility and chemotaxis of young and old hCPCs were
examined as previously described.10
Lentiviral Infection of hCPCs
The pLentiV plasmid for enhanced green fluorescence protein
(EGFP) expression and the 3-plasmid system to generate lentiviral
particles were used previously.21
Full-length human EphA2 sequence
was cloned into the pLentiV plasmid to enable expression of the
EphA2-EGFP fusion protein. The plasmid for lentiviral expression
of red fluorescence protein (RFP) was purchased from Thermo
Scientific. Infection of hCPCs was carried out as described.10,16,21
Imaging of hCPC Translocation In Vivo
Young and old hCPCs were infected with lentiviruses expressing
EGFP or RFP, respectively. The 2 cell populations were combined in a
1:1 ratio, pretreated with ephrin A1, and injected into the myocardium
of acutely infarcted mice.10
The procedures were performed in accor-
dance with institutional guidelines. The protocols for cell transplanta-
tion, 2-photon imaging, and quantitative analysis of cell movement are
provided in the Methods of the online-only Data Supplement.
Endocytosis of Ephrin A1 and Transferrin
Young and old hCPCs were incubated with fluorescently-labeled
transferrin and ephrin A1. To remove ligands bound to the cell sur-
face, hCPCs were subjected to acid wash, and the amount of internal-
ized ligand was calculated as % fluorescence intensity as compared
with total ligand content in the cells subjected to washing in neutral
pH. Endocytosis dynamics of transferrin and ephrin A1 was studied
by live imaging in young and old hCPCs.
Live Imaging of hCPC Migration In Vitro
EGFP-expressing or EphA2-EGFP-infected old hCPCs were sub-
jected to polarized stimulation with HGF and imaged (see Methods
of the online-only Data Supplement).
Cell Sorting by Adhesion to Ephrin A1
Adhesion assay of hCPCs to immobilized ephrin A1 was performed
as previously published.10
The expression of p16INK4a
and γH2A.X
was determined by immunolabeling and confocal microscopy in
adherent and nonadherent hCPCs.
Statistical Analysis
Significance between 2 groups was determined by 2-tailed unpaired
Student t test. For multiple comparisons, the ANOVA test with
Bonferroni correction was used. Quantitative data are expressed as
mean±SD. The n values used in each statistical determination are
listed for convenience in the legend to each figure; these values reflect
the number of independent experiments performed in triplicates in
each case.
Results
Aging Impairs hCPC Motility
Cellular senescence is implicated in the deterioration of organ
function and in the aging of the organism.22,23
Cells displaying
an old phenotype are identified by the expression of senes-
cence-associated biomarkers.18,24
Strategies for the isolation of
live senescent cells remain to be developed, requiring the imple-
mentation of ex vivo models of cellular aging. Two in vitro pro-
tocols were introduced to achieve hCPC senescence (Figure IA
in the in the online-only Data Supplement): replicative senes-
cence as a result of serial passaging,25
and stress-induced senes-
cence by exposure to the oxidative agent doxorubicin.17
Senescence of hCPCs was documented with several parame-
ters, which included irreversible withdrawal from the cell cycle,
expression of the senescence-associated protein p16INK4a
, accu-
mulation of DNA-damage response foci, telomeric shortening,
and morphological changes consisting of cell flattening and
enlargement.25
DNA-damage response foci are characterized by
the colocalization of phosphorylated histone H2A.X (γH2A.X)
and p53-binding protein 1 (53BP1) at sites of DNA injury.26
The fraction of Ki67-positive dividing hCPCs decreased
3-fold from P4-7 to P11-15 and similar results were obtained 3
days after doxorubicin (Figure 1A). In both cases, the percentage
by guest on July 14, 2015http://circ.ahajournals.org/Downloaded from
3. Goichberg et al EphA2 Dysfunction in Old hCPCs 2213
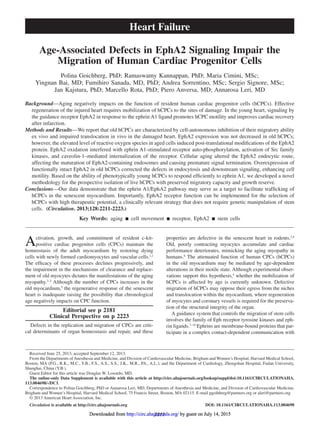
Figure 1. Old hCPCs display cell-autonomous defects in migratory response. A–C, Primary cultures of actively growing hCPCs (young) were
subjected to serial passages (replicative senescence: old), or to doxorubicin exposure (stress-induced senescence: old). Young and old
hCPCs express c-kit (green). Nuclei are stained with DAPI (blue). Phalloidin, grey. Localization of Ki-67 (A: red) decreases, and p16INK4a
(B:
red), and DNA-damage response foci (C: γH2A.X, green; 53BP1, red) increase in old hCPCs. Rectangles define areas illustrated at higher
magnification in the insets (C). Data are mean±SD (n=3–5). Only hCPCs with ≥2 γH2A.X foci were included in the quantitative analysis.
Replicative senescence: *P=0.009, †
P=0.04, §
P=0.02; Stress-induced senescence: *P0.0001, †
P=0.04, §
P=0.03. D, Transwell migration of
young and old hCPCs after ephrin A1 stimulation, or in the presence of HGF. This assay shows a decreased migration of old hCPCs. Data are
mean±SD (n=8–12). *P=0.038 vs unstimulated cells (-); †
P0.0001 vs unstimulated cells (-); **P0.0001 vs ephrin A1 only; #
P0.0001 vs young.
E, Young and old hCPCs exposed to a polarized source of HGF. EphA2 (green) accumulates at the leading lamella (asterisk) of young cells.
Individual fluorescent signals in the rectangles are shown in the adjacent panels. F, Time-lapse images of young (green) and (Continued)
by guest on July 14, 2015http://circ.ahajournals.org/Downloaded from
4. 2214 Circulation November 12, 2013
of p16INK4a
-positive hCPCs increased 4-fold (Figure 1B). DNA-
damage response foci were found in nearly 40% and 60% of
serially passaged and doxorubicin-treated hCPCs, respectively
(Figure 1C). Telomere shortening, from 9 kbp to 5.2 kbp, was
apparent only in long-term hCPC cultures (Figure IB and IC
in the online-only Data Supplement). Short-term oxidative
stress by doxorubicin is more commonly associated with loss
of telomere integrity27
in the absence of changes in average telo-
mere length (Figure ID in the online-only Data Supplement).
Additionally, senescent hCPCs showed flattening and loss of
polarization (Figure IE in the online-only Data Supplement).
Thus, old hCPCs were obtained by these two protocols, enabling
the comparison of young and old cells isolated from the same
human heart, independently from patient’s age, sex, absence or
presence of pathology, and cause and duration of the cardiac
disease. In all studies, hCPCs obtained at early (young) and late
(old) passages were used, together with hCPCs cultured in the
absence (young) and presence (old) of doxorubicin.
Experimentally, the migratory capacity of CPCs in the
myocardium declines with age,4
but the mechanisms respon-
sible for this functional alteration are largely unknown. The
ephrin A1/EphA2 pathway and HGF/c-Met signaling favor
the mobilization of CPCs in the aged or infarcted heart.4,10,14,15
Additionally, the expression of EphA2 is required for HGF-
induced chemotaxis of hCPCs, and activation of EphA2 by
ephrin A1 potentiates the migration of this cell class.10
The spontaneous motility and chemotaxis towards HGF
were severely affected in old hCPCs (Figure 1D). Importantly,
EphA2 stimulation with ephrin A1 promoted cell movement
in young but not in old hCPCs (Figure 1D). In the presence
of HGF, young hCPCs acquired a polarized morphology and
redistributed EphA2 to the leading lamella10
; this response
was not observed in old cells (Figure 1E). The defects in the
migratory behavior of old hCPCs were comparable in the 2
models of senescence, indicating that aging per se has detri-
mental effects on hCPC motility.
To determine whether these in vitro findings had a func-
tional counterpart in vivo, young and old hCPCs were infected
with a lentiviral vector carrying green or red fluorescent pro-
tein. After stimulation with ephrin A1, young and old hCPCs
were cotransplanted in the border zone of acutely infarcted
hearts and their displacement within the myocardium was
measured by 2-photon microscopy over a period of 6 hours.
Ephrin A1-activated young hCPCs showed an average 2.4-fold
higher translocation velocity than ephrinA1-treated old hCPCs
(Figure 1F and 1G). Additionally, the percent of nonmigrat-
ing old hCPCs was 2.9-fold larger than that of young hCPCs
(Figure 1G and Movie I in the online-only Data Supplement).
Thus, activation of the ephrin A1/EphA2 signaling enhances
the trafficking of young hCPCs in vitro and in vivo, but does
not reverse the defect in the motile state of old hCPCs.
Ephrin A1–Induced EphA2 Endocytosis Is Altered
in Old hCPCs
The impairment in the motility of old hCPCs within the myo-
cardium may reflect alterations in the expression of ephrin A1
ligand, its corresponding receptor EphA2, or the downstream
signaling pathway. With chronological age, the level of eph-
rin A1 decreased slightly in the human heart (Figure 1H), in
which ephrin A1 is confined to the myocyte compartment.10
The decline in ephrin A1 was more apparent in senescent
p16INK4a
-positive myocytes (Figure 1I). However, exposure to
saturating levels of ephrin A1 did not correct the defects in
the motile properties of old hCPCs (see Figure 1D, 1F and
1G), suggesting that EphA2 function is a crucial determinant
of hCPC migration.
Because the expression of EphA2 and c-Met proteins did
not differ in young and old hCPCs (Figure II in the online-only
Data Supplement), we determined whether dysfunction of the
EphA2 receptor was implicated in the migration abnormali-
ties of old hCPCs observed in vitro and in vivo. In our study,
we focused on EphA2 because the integrity of this pathway
is essential for the chemotactic response of hCPCs to HGF.10
Ephrin binding to Eph receptors leads to internalization of
the ligand/receptor complex from the plasma membrane to
the cytosol.28,29
By using fluorescently labeled ephrin A1, the
amount of ligand internalized by young and old hCPCs was
measured quantitatively. In comparison with young hCPCs,
EphA2-mediated ephrin A1 endocytosis was markedly
decreased in old hCPCs (Figure 2A and 2B). The subcellular
distribution of the ephrin A1/EphA2 complex also differed in
the two hCPC classes. The ligand-receptor pair accumulated
in the perinuclear region of young hCPCs but was restricted to
vesicles near the plasma membrane of old cells (Figure 2C).
This defect was not observed with the transferrin ligand. The
simultaneous analysis of ephrin A1 and transferrin endocyto-
sis in old hCPCs showed that, in contrast to ephrin A1, trans-
ferrin was internalized and translocated to the perinuclear
endosomes (see Figure 2A and 2B), pointing to the absence
of a global defect in the endocytic machinery of old hCPCs.
The motility and sub-cellular distribution of endosomes are
strictly related to their stage of maturation. Within minutes of
ligand binding, multiple vesicles form at the periphery of the
cell and undergo slow nondirectional short-range oscillations,
which convert into rapid directional long-range movements.
This process results in the translocation of vesicles to the
perinuclear region.30
The dynamics of endosomes containing
fluorescently labeled ephrin A1 was studied by live imaging
in young and old hCPCs. Ephrin A1 was efficiently trans-
ported from the plasma membrane to the perinuclear region
in young cells (Movie II in the online-only Data Supplement).
Conversely, the displacement of the ephrin A1 cargo lacked
directionality in old hCPCs, in which endosomes largely
Figure 1. Continued. old (red) hCPCs pre-stimulated with ephrin A1 and injected in the border zone of the acutely infarcted mouse heart.
Arrows point to the position of clusters of young hCPCs. Note the lack of movement of old hCPCs. The apparent decrease in fluorescence
intensity in some of the panels is dictated by a slight shift in the focal plane during image acquisition. See accompanying Video I in
the online-only Data Supplement. G, Cell displacement with time. Green and red dots correspond to individual young and old hCPCs,
respectively. Solid lines represent average values. The dotted line indicates the velocity of young hCPCs in the absence of ephrin A1. Data
are mean±SD (n=4). *P0.0001. H, Expression of ephrin A1 in young and old human myocardium. *P=0.013. Optical density (O.D.) data were
normalized to the expression of cardiac α-actinin (α-CA) and GAPDH. Young hearts: 34–38 years-old; Old: 68–70 years-old. I, Distribution of
ephrin A1 (white) in p16INK4a
-positive (green, arrows) and negative cardiomyocytes (α-sarcomeric actin: α-SA, red) in young and old human
hearts. hCPC indicates human cardiac progenitor cell; and HGF, hepatocyte growth factor.
by guest on July 14, 2015http://circ.ahajournals.org/Downloaded from
5. Goichberg et al EphA2 Dysfunction in Old hCPCs 2215
failed to reach the center of the cells (Figure 2D and 2E, and
Movie II in the online-only Data Supplement).
The movement of endocytic vesicles from the plasma
membrane to the perinuclear area is coupled with their pro-
gressive enlargement.30
Exposure of young hCPCs to eph-
rin A1 resulted in a time-dependent increase in the average
size of the EphA2-containing vesicles (Figure 2F and 2G).
In young hCPCs, EphA2-endosomes, 3 µm2
, were found in
the perinuclear region and smaller EphA2-vesicles, 2 µm2
,
were predominantly located at the periphery of the cells
(Figure 2F). Five minutes after stimulation with ephrin A1,
the size of the EphA2 clusters was comparable in young and
old hCPCs (Figure 2G). However, the evolution of EphA2-
vesicles into larger endosomes was significantly hindered in
old hCPCs (Figure 2F and 2G). These results suggest that
defects in the maturation of the primary endocytic vesicles
carrying ephrin A1/EphA2 occur in old hCPCs and may have
an impact on the fate of the internalized EphA2 receptor and
its downstream signaling.28,29,31
Primary endosomes containing the ligand/receptor complex
are transported to and fused with early endosomes that func-
tion as sorting domain for cargo recycling to the cell surface, or
cargo degradation in lysosomes.30,31
Early endosomes, which
are recognized by the presence of the early endosome antigen
1 (EEA1), fuse with late endosomes/lysosomes expressing the
lysosomal-associated membrane protein 1 (LAMP1).30,31
The
colocalization of internalized ephrin A1/EphA2 with EEA1-
endosomes increased in a time-dependent manner in young
hCPCs (Figure 3A–3C). However, old hCPCs exhibited a
significant decrease in the colocalization of ephrin A1/EphA2
with EEA1 and an increase in association with LAMP1-
positive vesicles (Figure 3B and 3D). In old hCPCs, the fusion
of ephrin A1/EphA2 with LAMP1-endosomes was apparent
at the cell periphery, and seemingly did not involve EEA1
Figure 2. Endocytosis of ephrin A1 is impaired in old hCPCs. A, Young and old hCPCs were simultaneously treated with fluorescently-
labeled ephrin A1 and transferrin and analyzed by flow-cytometry. The relative amount of intracellular ephrin A1 decreased in old hCPCs,
whereas the quantity of transferrin did not vary in young and old hCPCs. A.U. indicates arbitrary units. B, hCPCs exposed for 15 min to
ephrin A1 (red) and transferrin (green). The distribution of the 2 ligands in cytosolic vesicles is similar in young hCPCs but differs in old
hCPCs. Ephrin A1, red arrows; transferrin, green arrows. C, EphA2 (green) is located on the plasma membrane of untreated young and
old hCPCs (0 min). EphA2 colocalizes with ephrin A1 (red) in the endocytic vesicles (orange) of ligand-stimulated young and old hCPCs
(15 min). Intracellular and perinuclear distribution of endocytic vesicles in young hCPCs (lower left, arrows), and in proximity of the
plasma membrane in old hCPCs (lower right, arrows). Rectangles define areas illustrated at higher magnification in the insets. D and E,
Dynamic analysis of the translocation of ephrin A1–containing endosomes in EGFP-expressing hCPCs (green) treated with fluorescently-
labeled ephrin A1 (red). D, Time-lapse images of EGFP-positive young and old hCPCs; overlaid trajectory of individual vesicles (red)
illustrated with a color-coded time scale (blue-start, yellow-end). See accompanying Video II in the online-only Data Supplement. E, The
distance of the vesicles from the plasma-membrane was computed as percent of cell diameter. Data are mean±SD (n=3). *P=0.03 vs old
at 25 min. F, Images of EphA2 vesicles (upper, white) and color-coded depiction of their size (lower) 15 min after ephrin A1 stimulation.
Note larger EphA2-containing endosomes (yellow-red color) in the center of a young cell (lower left). G, Area of EphA2 clusters formed
in young and old hCPCs after ephrin A1 exposure. Data are mean±SD (n=12). *P0.0001 vs 5 min, †
P0.0001 vs 5 min; **P0.0001 vs
15 min; #
P0.0001 vs corresponding time in young. EGFP indicates enhanced green fluorescent protein; and hCPC, human cardiac
progenitor cell.
by guest on July 14, 2015http://circ.ahajournals.org/Downloaded from
6. 2216 Circulation November 12, 2013
vesicles (Figure 3B). Thus, endosomal targeting of the ligand-
bound EphA2 receptor is altered in old hCPCs; a smaller frac-
tion of internalized EphA2 persists in early endosomes, but a
larger proportion of this receptor is destined to the late endo-
somal compartment, possibly undergoing degradation.30,31
EphA2 Endocytosis Is Mediated by Caveolin-1 and
Src Family Kinases
Clathrin- and caveolin-dependent endocytosis is a major route
by which receptors internalize from the plasma membrane to the
cytoplasm. Endocytosis of Eph receptors is mediated by both
clathrin and caveolin.32,33
The EphA2 protein contains a putative
caveolin-binding motif that directly interacts with caveolin-1
in response to ligand stimulation.32
Caveolin-1 and caveolin-2
isoforms were expressed in hCPCs, whereas caveolin-3 was not
detectable (Figure IIIA in the online-only Data Supplement).
The distribution of EphA2 and caveolin-1 in hCPCs was
determined biochemically and by immunolabeling and confo-
cal microscopy. In response to ephrin A1, caveolin-1 colocal-
ized with EphA2 in the EEA1-endosomes of young hCPCs
(Figure 4AandFigureIIIBintheonline-onlyDataSupplement).
By immunoprecipitation and Western blot, caveolin-1 was
found to form a complex with EphA2 in young hCPCs, and
this protein-to-protein interaction increased significantly with
ephrin A1 stimulation (Figure 4B). The subcellular distribution
of caveolin-2 resembled that of caveolin-1; however, internal-
ized EphA2 showed a preferential association with caveolin-1
(Figure IIIB in the online-only Data Supplement). The presence
of ephrin A1/EphA2 in clathrin-coated vesicles was only occa-
sionally seen (Figure IIIC in the online-only Data Supplement),
and the complex between EphA2 and caveolin-2 or clathrin
did not increase after exposure to ephrin A1 (Figure IIID in the
online-only Data Supplement). Thus, in response to ephrin A1,
caveolin-1 mediates EphA2 endocytosis in young hCPCs.
The association of EphA2 with caveolin-1 and the distri-
bution of EphA2/caveolin-1 in early endosomes after eph-
rin A1 stimulation were altered in old hCPCs (Figure 4A and
4C, and Figure IIIB in the online-only Data Supplement).
The protein level of caveolin-1 was similar in young and old
hCPCs (Figure IIIE in the online-only Data Supplement), but
the subcellular localization of caveolin-1 differed in these
2 cell populations. Old hCPCs showed a loss in the polarized
Figure 3. Fusion of ephrin A1/EphA2 vesicles with early and late endosomes is altered in old hCPCs. A and B, Time-dependent changes
in the sub-cellular distribution of internalized ephrin A1 in young and old hCPCs stimulated with ephrin A1. After 5 min, ephrin A1 (red)
colocalizes with EEA1 (green) and LAMP1 (blue). At 15 and 25 min, the association of ephrin A1 with EEA1 is apparent in young hCPCs
and much less in old hCPCs. The two rectangles define the areas illustrated at higher magnification in panel B. Green arrows in young
hCPCs point to the colocalization of ephrin A1 with EEA1. Light blue arrows in old hCPCs indicate ephrin A1 association with LAMP1.
These vesicles are not labeled with EEA1. C, Quantitative analysis of EphA2 co-localization with EEA1 in young and old hCPCs treated
with ephrin A1. Data are mean±SD (n=6). *P0.0001 vs 5 min, †
P0.0001 vs 5 min; **P0.0001 vs 15 min; #
P0.0001 vs corresponding
time in young. D, Time-dependent changes in the association of EphA2 (blue) with EEA1 (green) and LAMP1 (red) in young and old
hCPCs after treatment with ephrin A1. Rectangles define areas illustrated at higher magnification in the insets. EEA1 indicates endosome
antigen 1; hCPC, human cardiac progenitor cell; and LAMP1, lysosomal-associated membrane protein 1.
by guest on July 14, 2015http://circ.ahajournals.org/Downloaded from
7. Goichberg et al EphA2 Dysfunction in Old hCPCs 2217
pattern of caveolin-1 at the lateral cell membrane, and caveo-
lin-1 accumulated in large structures near the center of the cell
(Figure IIIB in the online-only Data Supplement).
The interaction of EphA2 with caveolin-1 was severely
affected in old hCPCs (Figure 4A and 4B), suggesting that the
recruitment of caveolin-1 to the activated receptor was impaired
as a result of a defect in EphA2 signaling. This hypothesis was
supported by the decrease in EphA2 receptor tyrosine phos-
phorylation in old hCPCs after ephrin A1 binding (Figure 4B);
Eph autophosphorylation is a hallmark of receptor activation.11
The degree of EphA2 phosphorylation triggered by eph-
rin A1 stimulation is determined by the equilibrium between
autophosphorylation of receptor tyrosine kinases and dephos-
phorylation of tyrosine residues by protein tyrosine phospha-
tases.28,34
Dephosphorylation of EphA2 may be accelerated in
old hCPCs, attenuating EphA2 signaling. However, inhibition
of protein tyrosine phosphatases with pervanadate led to a
reduction in ephrin A1-induced EphA2 endocytosis (Figure
IV in the online-only Data Supplement), arguing against the
possibility that an increased protein tyrosine phosphatase
activity interferes with EphA2 function in old hCPCs.
In young cells stimulated with ephrin A1, the endosomes
carrying EphA2 and caveolin-1 or EEA1 were character-
ized by accumulation of phospho-tyrosine labeling, which
was greatly reduced in old hCPCs exposed to ephrin A1
(Figure V in the online-only Data Supplement). These
results suggest that EphA2 receptor tyrosine kinase signal-
ing is maintained in endosomes of young hCPCs, whereas
EphA2 autophosphorylation and endocytosis were markedly
reduced in old hCPCs, negatively impacting on the EphA2
downstream pathway.
The Src family kinases (SFK) are well-established down-
stream effectors of the Eph receptors.11,12
Consistent with
previous observations in hCPCs,10
EphA2 stimulation with
ephrin A1 induced SFK activation and enhanced the binding
of EphA2 to SFK (Figure 4B). In young hCPCs, ephrin A1
promoted the formation of endocytic vesicles in which EphA2
colocalized with the phosphorylated active forms of SFK and
caveolin-1 (Figure 4C). Caveolin-1 phosphorylation at Tyr14
controls the internalization of caveolae and is implicated in
the signaling cascade regulating cell motility.35,36
Inhibition of
SFK, which phosphorylate caveolin-1, prevented the increase
Figure 4. EphA2 binding to downstream effectors in endosomes is inhibited in old hCPCs. A, Colocalization of caveolin-1 (red), EEA1
(green) and EphA2 (blue) in the cytosol of young hCPCs exposed to ephrin A1 for 25 min. This colocalization is markedly attenuated in old
hCPCs. Rectangles define areas illustrated at higher magnification in the insets. B, Immunoprecipitation and Western blotting of EphA2
protein (IP: EphA2) from young and old hCPCs in the presence (+) or absence (−) of ephrin A1. pTyr indicates phospho-tyrosine. O.D. data
were normalized to the efficiency of EphA2 immunoprecipitation relative to unstimulated cells (−). Data are mean±SD (n=3). pTyr: *P=0.037;
SFK: *P=0.033; caveolin-1: *P=0.023. C, Accumulation of Tyr14
-caveolin-1 (red), Tyr416
-SFK (green) and EphA2 (blue) in endocytic vesicles
of young and old hCPCs stimulated with ephrin A1. Rectangles define areas illustrated at higher magnification in the insets. D-G, Young
hCPCs pretreated with SFK inhibitor (SFKi) or DMSO vehicle (control) were exposed to ephrin A1 for 25 min or left unstimulated (−).
D, Color-coded images illustrating the intensity of Tyr14
-caveolin-1 labeling in hCPCs. E, Color-coded representation of the caveolin-1
labeling pattern in ephrin A1-treated hCPCs. F, Ephrin A1–induced EphA2 endocytosis (white) in control and SFKi-treated hCPCs.
G, Fluorometric measurement of the internalized fluorescently labeled ephrin A1 at 15 min. Data are mean±SD (n=3). *P=0.021. EEA1
indicates endosome antigen 1; hCPC, human cardiac progenitor cell; and SFK, Src family kinases.
by guest on July 14, 2015http://circ.ahajournals.org/Downloaded from
8. 2218 Circulation November 12, 2013
in Tyr14
-caveolin-1 in young hCPCs after ephrin A1 treat-
ment (Figure 4D). Additionally, it decreased the accumula-
tion of caveolin-1 in endocytic vesicles (Figure 4E), affecting
EphA2 endocytosis (Figure 4F) and ephrin A1 internaliza-
tion (Figure 4G). Thus, in young hCPCs, activation of SFK is
required for caveolin-1–mediated EphA2 endocytosis.
As emphasized above, HGF-induced hCPC migration
requires EphA2 activity.10
Stimulation of hCPCs with HGF
led to EphA2 accumulation at the plasma membrane (see
Figure 1E), where ruffles and protrusion indicative of high
membrane activity were found. Phosphorylated SFK and
caveolin-1 were detected in these regions of membrane acti-
vation (Figure 5A). The combination of ephrin A1 and HGF
had a synergistic or addictive effect on EphA2 endocytosis
(Figure 5B). Thus, HGF/c-Met signaling affects the cellular
distribution of EphA2 receptor, favoring its interaction with
downstream targets and promoting cell motility.
Accumulating evidence supports the view that the func-
tion of receptor tyrosine kinases is sustained in endosomes,
which are operatively defined as signaling endosomes.30,37
In young hCPCs, activated EphA2 receptors and their
downstream targets, SFK, are present in EEA1-endosomes,
possibly reflecting the generation of signaling endosomes.
The dynamin inhibitor-dynasore38
blocks caveolae inter-
nalization and ephrin A1-induced EphA2 endocytosis,
abrogating hCPC motility (Figure 6 in the online-only
Data Supplement). In old hCPCs, attenuated EphA2 auto-
phosphorylation correlated with the decrease in the for-
mation of protein complexes with SFK or caveolin-1 (see
Figure 4B). EphA2 localization in endosomes containing
caveolin-1 or EEA1 was also reduced (see Figure 4A and
4C, and Figure IIIB and Figure V in the online-only Data
Supplement). Thus, in old hCPCs, post-translational mod-
ifications may occur in EphA2 receptor, interfering with
tyrosine kinase activity, endocytosis, and the formation of
signaling endosomes.
Protein Oxidation Inhibits EphA2 Function in
Old hCPCs
Aging is associated with a progressive intracellular accu-
mulation of reactive oxygen/nitrogen species (ROS).39,40
Two fluorescent indicators of ROS were used to detect
oxidative stress by confocal microscopy and to measure
ROS level fluorometrically in hCPCs. By both approaches,
old hCPCs were characterized by a significantly higher
oxidative stress than young hCPCs (Figure 6A and 6B).
Controlled production of ROS is critical for signal trans-
duction, whereas an excessive generation of ROS impairs
receptor tyrosine kinase activity.41
Exposure of young
hCPCs to acute oxidative stress with H2
O2
markedly
reduced the ephrin A1–induced EphA2 phosphorylation
(Figure 6C), mimicking the defects observed in old hCPCs
(see Figure 4B). SFK activation and EphA2 endocytosis
were notably diminished in H2
O2
-treated young hCPCs
(Figure 6D and 6E), impairing their migratory ability
(Figure 6F). Importantly, a shift in the isoelectric point (pI)
of the EphA2 protein was detected in old hCPCs and simi-
lar changes were found in young hCPCs in the presence
of H2
O2
(Figure 6G). Thus, ROS may induce oxidation of
the EphA2 receptor in old hCPCs, precluding its activation
and downstream signaling.
These findings prompted us to determine whether treatment
of old hCPCs with antioxidants positively affected EphA2 sig-
naling. Old hCPCs, exposed for 1 day to N-acetyl-L-cysteine
or polyethylene glycol-catalase, were stimulated with ephrin
A1. With N-acetyl-L-cysteine, the association of caveolin-1
with EphA2 was moderately improved, pointing to an ame-
lioration in endocytosis of the ephrin A1/EphA2 complex
(Figure 6H). Moreover, cell-permeable catalase decreased
oxidative stress and favored in a subset of old hCPCs the co-
localization of the ligand-receptor pair with EEA1 (Figure 6I
and 6J), mimicking the pathway of EphA2 internalization
observed in young cells (see Figure 3A–3C). The limited
effects of antioxidants on EphA2 endocytosis imposed on us
the search for alternative strategies aiming at the functional
restoration of the receptor.
Figure 5. EphA2 and c-Met signaling pathways interact in
hCPCs. A, Accumulation of Tyr416
-SFK (green), Tyr14
-caveolin-1
(red), and EphA2 (blue) in the areas of membrane activity
(arrows) formed in young hCPCs in response to HGF. Individual
fluorescent signals (upper panels); merge (lower left panel).
Rectangles define areas illustrated at higher magnification in
the 3 insets. EphA2 colocalization with Tyr416
-SFK and Tyr14
-
caveolin-1 is depicted in insets 1 and 2. Inset 3 shows the
absence of this phenomenon. B, EphA2 (white) endocytosis
in young hCPCs treated with HGF (lower left), ephrin A1
(upper right), or both (lower right). Control, untreated hCPCs.
hCPC indicates human cardiac progenitor cell; and SFK,
Src family kinases.
by guest on July 14, 2015http://circ.ahajournals.org/Downloaded from
9. Goichberg et al EphA2 Dysfunction in Old hCPCs 2219
Exogenous EphA2 Improves the Motility of
Old hCPCs
Old hCPCs were infected with a lentivirus carrying a full-length
EphA2-EGFP fusion protein or a lentivirus carrying EGFP
only (Figure 7A and 7B). Exogenous EphA2, recognized by
the EGFP tag, displayed the expected expression pattern on the
plasma membrane (Figure 7C). With respect to endogenous
EphA2, ephrin A1 induced a 5-fold higher level of tyrosine
phosphorylation of the exogenous EphA2 receptor (Figure 7D),
which underwent efficient endocytosis and co-localization with
caveolin-1 (Figure 7E and 7F). Moreover, exogenous EphA2
exhibited greater association with EEA1-endosomes than
the endogenous EphA2 protein in the same cell (Figure 7G).
Conversely, endogenous EphA2 receptors in the same hCPC
were primarily colocalized with LAMP1 (Figure 7H). The
correction of the defects in EphA2 endocytosis improved the
motile behavior of old hCPCs exposed to HGF (Figure 7I and
7J, and Movie III in the online-only Data Supplement). Thus,
Figure 6. Oxidative stress inhibits EphA2 signaling in hCPCs. A, DHE labeling in young and old hCPCs. Arrows point to accumulations
of oxidized DHE in the nuclei of old cells. B, Fluorometric measurement of H2
DCFDA intensity. Data are mean±SD (n=6). *P=0.018. C–E,
Young hCPCs were pretreated with H2
O2
or left untreated (control) for 30 min. Cells were then stimulated with ephrin A1 for 25 min (+)
or left unstimulated (−). C, Phospho-tyrosine level of the EphA2 receptor (pTyr-EphA2) by immunoprecipitation and Western blotting (IP:
EphA2). O.D. data are normalized to the efficiency of EphA2 immunoprecipitation, expressed relative to control. Data are mean±SD (n=3).
*P=0.049. D, Color-coded images of Tyr416
-SFK labeling in ephrin A1–treated hCPCs. E, Ephrin A1–induced EphA2 endocytosis (white) in
control and H2
O2
-treated hCPCs. F, Transwell migration assay of young hCPCs (young), H2
O2
-exposed young hCPCs (young-H2
O2
) and
untreated old hCPCs (old). The number of spontaneously migrated cells (−) and in response to HGF (+) are shown. Data are mean±SD
(n=4). *P=0.004 vs. (−) young hCPCs. G, Two-dimensional gel electrophoresis of the EphA2 receptor (2D:EphA2) in untreated young
hCPCs, young hCPCs exposed to H2
O2
(young-H2
O2
), and untreated old hCPCs; pI values are indicated. The overlay histogram shows the
line scan of the O.D. distribution for each condition. H, Colocalization of caveolin-1 (red) and EphA2 (green) in the cytosol of old hCPCs
exposed to ephrin A1. This colocalization is markedly increased in cells pre-treated with NAC (right). Rectangles define areas illustrated at
higher magnification in the insets. Control, no NAC. I, Oxidized DHE (red, arrows) is detected in the nuclei of old hCPCs in the absence of
PEG-catalase (left: control). Treatment with PEG-catalase (right) attenuated oxidative stress in old hCPCs. J, Ephrin A1 (red) colocalizes
with EEA1 (green) in old hCPCs treated with PEG-catalase (right). LAMP1 (blue). Rectangles define the areas illustrated at higher
magnification in the insets. Control, no PEG-catalase. DHE indicates dihydroethidium; EEA1, endosome antigen 1; hCPC, human cardiac
progenitor cell; LAMP1, lysosomal-associated membrane protein 1; NAC, N-acetyl-L-cysteine; and PEG, polyethylene glycol-catalase.
by guest on July 14, 2015http://circ.ahajournals.org/Downloaded from
10. 2220 Circulation November 12, 2013
the restoration of EphA2 receptor activity re-established the
migratory capacity of old hCPCs.
Sorting of Young and Old hCPCs Based on
Differential Responses to Ephrin A1
The recognition that defects in the ephrin A1/EphA2 effector
pathway alter the molecular mechanisms responsible for hCPC
migration provided a unique opportunity to establish whether
this system can be used to separate young hCPCs with pre-
served growth reserve from old non-functional hCPCs. Young
hCPCs efficiently adhere to immobilized recombinant ephrin
A1 ligand (Figure 8A and 8B), a process that is abrogated after
siRNA-mediated EphA2 knockdown.10
The defect in EphA2
receptor activity in old hCPCs substantially reduced their
ability to adhere to ephrin A1–coated surfaces (Figure 8B).
hCPCs with a younger phenotype were isolated from the
heterogeneous pool of old cells based on their preferential
retention on ephrin A1-substrates (Figure 8A). In comparison
with unsorted and non-adherent old cells, the subset of hCPCs
adhering to ephrin A1 displayed a 2-fold lower frequency in
the expression of the senescence-associated markers p16INK4a
and γH2A.X (Figure 8C and 8D). Thus, EphA2 receptor func-
tion can be implemented in the selection of hCPCs with high
therapeutic potential.
Discussion
In the present study we provide a potential mechanism for
the age-associated decline in the motility of hCPCs. The
Figure 7. Functional EphA2 receptor potentiates ephrin A1 signaling in old hCPCs. A, Old hCPCs were infected with a lentivirus (LV)
carrying EphA2-EGFP or EGFP only. Western blotting: EphA2-EGFP fusion protein (eEphA2) has a higher molecular weight (green arrow)
than endogenous EphA2 (red arrow). Molecular weight is indicated in kDa. B, Flow-cytometry: EphA2 (red), eEphA2 (green), and EGFP
in old hCPCs. Secondary IgG, control (grey). C, In the absence of ephrin A1, exogenous EphA2 (orange: native EGFP fluorescence and
immunolabeled red) is highly expressed and is localized on the membrane of old hCPCs. Individual fluorescent signals are illustrated in
the lower panels. D, Immunoprecipitation of EphA2 protein (IP: EphA2) and immunoblotting of phospho-tyrosine (IB: pTyr) in LV EphA2-
EGFP old hCPCs in the presence (+) or absence (−) of ephrin A1. O.D. data were normalized to the efficiency of eEphA2 and EphA2
immunoprecipitation relative to unstimulated cells (−). Data are mean±SD (n=4). *P=0.035. Exogenous EphA2 (eEphA2, green arrows)
has a higher molecular weight than endogenous EphA2 (EphA2, red arrows). E, EphA2 endocytosis after 15-min stimulation with ephrin
A1 of LV EGFP and LV EphA2-EGFP old hCPCs. The number of EphA2-containing vesicles is higher in LV EphA2-EGFP hCPCs. F,
Exogenous EphA2 (native EGFP fluorescence and immunolabeled red) colocalizes with caveolin-1 (blue) in old LV EphA2-EGFP hCPCs
stimulated for 15 min with ephrin A1. This is apparent in area 1 (arrows) shown at higher magnification in the adjacent panel. Endogenous
EphA2 (immunolabeled red) failed to colocalize with caveolin-1 (see area 2 at low and high magnification). G and H, In old LV EphA2-
EGFP hCPCs, exogenous EphA2 (orange: native EGFP fluorescence and immunolabeled red) colocalizes with EEA1 (G, blue; green
arrow in inset 1) but not with LAMP1 (H, blue; green arrows in the insets) after stimulation with ephrin A1 for 15 min. Endogenous EphA2
(immunolabeled red) does not co-localize with EEA1 (G, blue arrow in inset 2) but colocalizes with LAMP1 (H; blue arrows in the insets).
I, Time-lapse images of chemotaxis of old LV EphA2-EGFP and LV EGFP hCPCs in response to HGF. See accompanying Video III in the
online-only Data Supplement. J, Fraction of migrating cells. Data are mean±SD (n=4). *P=0.002. EEA1 indicates endosome antigen 1;
EGFP, enhanced green fluorescent protein; and hCPC, human cardiac progenitor cell.
by guest on July 14, 2015http://circ.ahajournals.org/Downloaded from
11. Goichberg et al EphA2 Dysfunction in Old hCPCs 2221
inadequate activation of the EphA2 receptor in old hCPCs
precludes an efficient signal transduction, which is required
for the initiation of cell polarization and movement of hCPCs
in vitro and in the injured myocardium in vivo. Cellular
aging does not affect the protein level of EphA2 receptor in
hCPCs nor the early events involved in receptor binding to
the ephrin A1 ligand. In analogy with other cell systems,42
functional alterations in senescent hCPCs do not depend on
changes in receptor density and affinity to the ligand, but are
coupled with abnormalities in the activity of receptor tyro-
sine kinases.
Collectively, our data support the view that oxidative stress
is an important determinant of cellular and organ aging.39,40
The accumulation of ROS in old hCPCs induces post-trans-
lational modifications of the EphA2 protein interfering with
the receptor tyrosine kinase function. Although the specific
residues affected by oxidative stress were not identified,
oxidation is known to abrogate receptor activity.41
The age-
dependent consequences of EphA2 receptor oxidation were
corroborated by comparing the signaling capacity of endog-
enous and exogenously expressed EphA2 receptors in old
hCPCs. In contrast to endogenous EphA2, autophosphory-
lation of the exogenous EphA2 receptor was profoundly
increased after ephrin A1 stimulation. Consequently, endo-
cytosis and the formation of signaling endosomes were cor-
rected by restoring EphA2 function.
The recognition that tyrosine kinase activity is implicated
in EphA2 receptor endocytosis is consistent with previous
findings.29,43
Our work further demonstrates that alterations
in the EphA2 endocytic pathway prevent vesicle maturation.
The dynamic process of vesicle maturation is characterized
by centripetal trafficking of the ephrin A1/EphA2–containing
endosomes and vesicle enlargement, both essentially absent
in old hCPCs. Moreover, the amount of internalized ephrin A1
ligand in nonmoving vesicles adjacent to the cell surface was
decreased in old hCPCs. These defects in the translocation of
maturing endosomes carrying EphA2 receptors oppose sig-
nalosome assembly, which is required for the rearrangement
of the cytoskeleton and acquisition of the motile configuration
in old hCPCs.
In the course of endosome maturation, the primary endo-
cytic vesicles containing the internalized cargo fuse with early
endosomes at the cell periphery and form larger endosomes
as they move towards the nucleus, where the majority of
lysosomes are localized.30
In young hCPCs, fusion of inter-
nalized ephrin A1/EphA2 complex with the early endosomes
was followed by the association with late endosomes/lyso-
somes distributed in the perinuclear area. Conversely, in old
hCPCs, fusion of EphA2 receptors with early endosomes was
significantly reduced, whereas their interaction with LAMP1-
expressing vesicles at the cell periphery indicated an alter-
native pathway or their potential degradation. Thus, cellular
aging alters the EphA2 endocytic route, possibly affecting the
half-life of the EphA2 receptor and its function.
Results in this study show that activation of EphA2 by
ephrin A1 regulates phosphorylation of caveolin-1 and its
recruitment to endocytic vesicles. Although the expression of
caveolin-1 protein was similar in young and old hCPCs, old
cells lacked the polarized caveolin-1 distribution, reflecting an
abnormal migratory cell phenotype.44
Ephrin A1 treatment did
not correct this alteration in caveolin-1 localization, indicat-
ing that the integrity of the EphA2 pathway constitutes the
primary modulator of caveolin-1 function in hCPCs. In this
regard, exogenously introduced signaling-competent EphA2
receptors restored the endosomal accumulation of caveolin-1,
promoting effective endocytosis. The relevance of EphA2
signaling for the polarization and migration of hCPCs is sup-
ported by the findings demonstrating that phosphorylated SFK
Figure 8. Adhesion to ephrin A1
enriches the pool of young hCPCs.
A, Schematic representation of the
sorting steps for the separation of
hCPCs with functional (green) and
dysfunctional (brown) EphA2 receptors.
The heterogeneous cell pool is
exposed to ephrin A1–coated surfaces.
The nonadherent fraction contains
primarily old cells. The adherent
fraction is enriched with young hCPCs.
B, Adhesion assay to ephrin A1 or to
control human IgG-coated plates. The
efficiency of adhesion in young and old
hCPCs is expressed relative to the input
cell number. Data are mean±SD (n=4).
*P0.0001 vs control young; **P0.0001
vs young hCPCs that adhered to ephrin
A1. C, Expression of p16INK4a
(top,
green) and γH2A.X (bottom, green)
in hCPCs separated according to the
adhesion assay (ie, unsorted control,
and adherent and nonadherent hCPCs).
D, Percent of hCPCs positive for p16INK4a
and γH2A.X. Data are mean±SD (n=5).
*P=0.0023 vs control, **P0.0001
vs adherent, †
P=0.0048 vs control,
#
P0.0001 vs adherent. hCPC indicates
human cardiac progenitor cell; and IgG,
immunoglobulin G.
by guest on July 14, 2015http://circ.ahajournals.org/Downloaded from
12. 2222 Circulation November 12, 2013
colocalize with EphA2 and activated caveolin-1 in the endo-
somes. Inhibition of SFK, an established downstream target
of EphA2, prevents phosphorylation of caveolin-1 at Tyr14
and
the generation of caveolin-1-containing vesicles. Attenuation
in endocytosis of ephrin A1/EphA2 by SFK inhibition nega-
tively affects hCPC chemotaxis.10
The spatially- and temporally-restricted compartment of
signaling endosomes is implicated in the biological func-
tion of receptor tyrosine kinases.29,31
Oncogenic Met receptor
mutants promote cancer cell migration and are characterized
by an enhanced signaling capacity resulting from their pref-
erential accumulation and sustained function in endosomes.45
Similarly, endocytosis is required for activation of the down-
stream effectors of the VEGF receptor46
and vessel sprout-
ing.47
In contrast, mutation of the EphA8 receptor, which
interferes with endocytosis, prevents axon repulsion during
development.48
Our results indicate that formation of signal-
ing endosomes is required to elicit migratory responses in
hCPCs, raising the possibility that EphA2 receptor activity
in old hCPCs is not sufficient for the signalosome assembly.
In old hCPCs, the internalized EphA2 may be targeted to an
alternative pathway of receptor recycling/degradation leading
to premature signal termination. This hypothesis is supported
by the restoration of the motility-related signaling cascade in
old hCPCs overexpressing exogenous intact EphA2 receptors.
The ectopic receptor is efficiently phosphorylated and sub-
jected to endocytosis, displaying a vesicle maturation pattern
typical of young cells, which promotes signaling endosome
formation and cell migration.
The loss of migratory ability in old hCPCs affects their
translocation within the myocardium, impairing cell turnover
in the aging heart.4
This defect interferes with efficient car-
diac repair, having important clinical implications. Extreme
caution, however, has to be exercised in the extrapolation of
in vitro findings to the in vivo condition. As shown here and
previously,10
after myocardial infarction, ephrin A1 enhances
the motility and the regenerative potential of hCPCs express-
ing intact EphA2 receptor. Although the manifestations of the
aging cardiac phenotype are more complex than those found
acutely after ischemic injury, the restoration of CPC move-
ment leads to enhanced cardiomyogenesis, decreased fibrosis,
and functional improvement in the senescent rat heart.4
Our
data indicate that the expression of functional EphA2 recep-
tors may be implemented for the isolation of hCPCs that pos-
sess a young phenotype and higher proliferative capacity. Thus
far, no methodology is available for the in vivo separation of
human progenitor cells with distinct growth reserve, the most
critical determinant of successful cell therapy in patients. This
is particularly relevant because autologous hCPCs are cur-
rently being tested in phase 1 clinical trials with encouraging
results.20,49,50
Sources of Funding
This work was supported by National Institutes of Health grants.
Polina Goichberg is supported by the Brigham and Women’s Hospital
Fund to Sustain Research Excellence.
Disclosures
None.
References
1. Leri A, Kajstura J, Anversa P. Role of cardiac stem cells in cardiac patho-
physiology: a paradigm shift in human myocardial biology. Circ Res.
2011;109:941–961.
2. Anversa P, Kajstura J, Rota M, Leri A. Regenerating new heart with stem
cells. J Clin Invest. 2013;123:62–70.
3. Torella D, Rota M, Nurzynska D, Musso E, Monsen A, Shiraishi I, Zias
E, Walsh K, Rosenzweig A, Sussman MA, Urbanek K, Nadal-Ginard
B, Kajstura J, Anversa P, Leri A. Cardiac stem cell and myocyte aging,
heart failure, and insulin-like growth factor-1 overexpression. Circ Res.
2004;94:514–524.
4. Gonzalez A, Rota M, Nurzynska D, Misao Y, Tillmanns J, Ojaimi C,
Padin-Iruegas ME, Müller P, Esposito G, Bearzi C, Vitale S, Dawn B,
Sanganalmath SK, Baker M, Hintze TH, Bolli R, Urbanek K, Hosoda
T, Anversa P, Kajstura J, Leri A. Activation of cardiac progenitor cells
reverses the failing heart senescent phenotype and prolongs lifespan. Circ
Res. 2008;102:597–606.
5. Kajstura J, Gurusamy N, Ogórek B, Goichberg P, Clavo-Rondon C,
Hosoda T, D’Amario D, Bardelli S, Beltrami AP, Cesselli D, Bussani
R, del Monte F, Quaini F, Rota M, Beltrami CA, Buchholz BA, Leri
A, Anversa P. Myocyte turnover in the aging human heart. Circ Res.
2010;107:1374–1386.
6. Chimenti C, Kajstura J, Torella D, Urbanek K, Heleniak H, Colussi C,
Di Meglio F, Nadal-Ginard B, Frustaci A, Leri A, Maseri A, Anversa P.
Senescence and death of primitive cells and myocytes lead to premature
cardiac aging and heart failure. Circ Res. 2003;93:604–613.
7. Klein R. Eph/ephrin signaling in morphogenesis, neural development and
plasticity. Curr Opin Cell Biol. 2004;16:580–589.
8. Holmberg J, Genander M, Halford MM, Annerén C, Sondell M, Chumley
MJ, Silvany RE, Henkemeyer M, Frisén J. EphB receptors coordi-
nate migration and proliferation in the intestinal stem cell niche. Cell.
2006;125:1151–1163.
9. Chumley MJ, Catchpole T, Silvany RE, Kernie SG, Henkemeyer M. EphB
receptors regulate stem/progenitor cell proliferation, migration, and polar-
ity during hippocampal neurogenesis. J Neurosci. 2007;27:13481–13490.
10. Goichberg P, Bai Y, D’Amario D, Ferreira-Martins J, Fiorini C, Zheng
H, Signore S, del Monte F, Ottolenghi S, D’Alessandro DA, Michler RE,
Hosoda T, Anversa P, Kajstura J, Rota M, Leri A. The ephrin A1-EphA2
system promotes cardiac stem cell migration after infarction. Circ Res.
2011;108:1071–1083.
11. Pasquale EB. Eph receptors and ephrins in cancer: bidirectional signalling
and beyond. Nat Rev Cancer. 2010;10:165–180.
12. Coulthard MG, Morgan M, Woodruff TM, Arumugam TV, Taylor SM,
Carpenter TC, Lackmann M, Boyd AW. Eph/Ephrin signaling in injury
and inflammation. Am J Pathol. 2012;181:1493–1503.
13. Urbanek K, Cesselli D, Rota M, Nascimbene A, De Angelis A,
Hosoda T, Bearzi C, Boni A, Bolli R, Kajstura J, Anversa P, Leri A.
Stem cell niches in the adult mouse heart. Proc Natl Acad Sci USA.
2006;103:9226–9231.
14. Linke A, Müller P, Nurzynska D, Casarsa C, Torella D, Nascimbene A,
Castaldo C, Cascapera S, Böhm M, Quaini F, Urbanek K, Leri A, Hintze
TH, Kajstura J, Anversa P. Stem cells in the dog heart are self-renewing,
clonogenic, and multipotent and regenerate infarcted myocardium, improv-
ing cardiac function. Proc Natl Acad Sci USA. 2005;102:8966–8971.
15. Urbanek K, Rota M, Cascapera S, Bearzi C, Nascimbene A, De Angelis
A, Hosoda T, Chimenti S, Baker M, Limana F, Nurzynska D, Torella D,
Rotatori F, Rastaldo R, Musso E, Quaini F, Leri A, Kajstura J, Anversa P.
Cardiac stem cells possess growth factor-receptor systems that after acti-
vation regenerate the infarcted myocardium, improving ventricular func-
tion and long-term survival. Circ Res. 2005;97:663–673.
16. Bearzi C, Rota M, Hosoda T, Tillmanns J, Nascimbene A, De Angelis A,
Yasuzawa-Amano S, Trofimova I, Siggins RW, Lecapitaine N, Cascapera
S, Beltrami AP, D’Alessandro DA, Zias E, Quaini F, Urbanek K, Michler
RE, Bolli R, Kajstura J, Leri A, Anversa P. Human cardiac stem cells. Proc
Natl Acad Sci USA. 2007;104:14068–14073.
17. De Angelis A, Piegari E, Cappetta D, Marino L, Filippelli A, Berrino L,
Ferreira-Martins J, Zheng H, Hosoda T, Rota M, Urbanek K, Kajstura J,
Leri A, Rossi F, Anversa P. Anthracycline cardiomyopathy is mediated by
depletion of the cardiac stem cell pool and is rescued by restoration of
progenitor cell function. Circulation. 2010;121:276–292.
18. Cesselli D, Beltrami AP, D’Aurizio F, Marcon P, Bergamin N, Toffoletto
B, Pandolfi M, Puppato E, Marino L, Signore S, Livi U, Verardo R, Piazza
S, Marchionni L, Fiorini C, Schneider C, Hosoda T, Rota M, Kajstura J,
Anversa P, Beltrami CA, Leri A. Effects of age and heart failure on human
cardiac stem cell function. Am J Pathol. 2011;179:349–366.
by guest on July 14, 2015http://circ.ahajournals.org/Downloaded from
13. Goichberg et al EphA2 Dysfunction in Old hCPCs 2223
19. Baerlocher GM, Vulto I, de Jong G, Lansdorp PM. Flow cytometry and
FISH to measure the average length of telomeres (flow FISH). Nat Protoc.
2006;1:2365–2376.
20. Bolli R, Chugh AR, D’Amario D, Loughran JH, Stoddard MF, Ikram
S, Beache GM, Wagner SG, Leri A, Hosoda T, Sanada F, Elmore JB,
Goichberg P, Cappetta D, Solankhi NK, Fahsah I, Rokosh DG, Slaughter
MS, Kajstura J, Anversa P. Cardiac stem cells in patients with ischaemic
cardiomyopathy (SCIPIO): initial results of a randomised phase 1 trial.
Lancet. 2011;378:1847–1857.
21. Hosoda T, D’Amario D, Cabral-Da-Silva MC, Zheng H, Padin-Iruegas
ME, Ogorek B, Ferreira-Martins J, Yasuzawa-Amano S, Amano K, Ide-
Iwata N, Cheng W, Rota M, Urbanek K, Kajstura J, Anversa P, Leri A.
Clonality of mouse and human cardiomyogenesis in vivo. Proc Natl Acad
Sci USA. 2009;106:17169–17174.
22. Burton DG. Cellular senescence, ageing and disease. Age (Dordr).
2009;31:1–9.
23. Signer RA, Morrison SJ. Mechanisms that regulate stem cell aging and
life span. Cell Stem Cell. 2013;12:152–165.
24. de Jesus BB, Blasco MA. Assessing cell and organ senescence biomark-
ers. Circ Res. 2012;111:97–109.
25. Tchkonia T, ZhuY, van Deursen J, Campisi J, Kirkland JL. Cellular senes-
cence and the senescent secretory phenotype: therapeutic opportunities. J
Clin Invest. 2013;123:966–972.
26. Rodier F, Muñoz DP, Teachenor R, Chu V, Le O, Bhaumik D, Coppé JP,
Campeau E, Beauséjour CM, Kim SH, DavalosAR, Campisi J. DNA-SCARS:
distinct nuclear structures that sustain damage-induced senescence growth
arrest and inflammatory cytokine secretion. J Cell Sci. 2011;124(Pt 1):68–81.
27. van Tuyn J, Adams PD. Signalling the end of the line. Nat Cell Biol.
2012;14:339–341.
28. Pitulescu ME, Adams RH. Eph/ephrin molecules–a hub for signaling and
endocytosis. Genes Dev. 2010;24:2480–2492.
29. Andersson ER. The role of endocytosis in activating and regulating signal
transduction. Cell Mol Life Sci. 2012;69:1755–1771.
30. Huotari J, Helenius A. Endosome maturation. EMBO J. 2011;
30:3481–3500.
31. Platta HW, Stenmark H. Endocytosis and signaling. Curr Opin Cell Biol.
2011;23:393–403.
32. Vihanto MM, Vindis C, Djonov V, Cerretti DP, Huynh-Do U. Caveolin-1
is required for signaling and membrane targeting of EphB1 receptor tyro-
sine kinase. J Cell Sci. 2006;119(Pt 11):2299–2309.
33. Bouvier D, Tremblay ME, Riad M, Corera AT, Gingras D, Horn KE,
Fotouhi M, Girard M, Murai KK, Kennedy TE, McPherson PS, Pasquale
EB, Fon EA, Doucet G. EphA4 is localized in clathrin-coated and synaptic
vesicles in adult mouse brain. J Neurochem. 2010;113:153–165.
34. Janes PW, Nievergall E, Lackmann M. Concepts and consequences of Eph
receptor clustering. Semin Cell Dev Biol. 2012;23:43–50.
35. Nethe M, Hordijk PL. A model for phospho-caveolin-1-driven turnover of
focal adhesions. Cell Adh Migr. 2011;5:59–64.
36. Boscher C, Nabi IR. Caveolin-1: role in cell signaling. Adv Exp Med Biol.
2012;729:29–50.
37. Murphy JE, Padilla BE, Hasdemir B, Cottrell GS, Bunnett NW.
Endosomes: a legitimate platform for the signaling train. Proc Natl Acad
Sci USA. 2009;106:17615–17622.
38. Macia E, Ehrlich M, Massol R, Boucrot E, Brunner C, Kirchhausen
T. Dynasore, a cell-permeable inhibitor of dynamin. Dev Cell.
2006;10:839–850.
39. Finkel T, Holbrook NJ. Oxidants, oxidative stress and the biology of age-
ing. Nature. 2000;408:239–247.
40. Sohal RS, Orr WC. The redox stress hypothesis of aging. Free Radic Biol
Med. 2012;52:539–555.
41. Kang DH, Lee DJ, Lee KW, Park YS, Lee JY, Lee SH, Koh YJ, Koh GY,
Choi C, Yu DY, Kim J, Kang SW. Peroxiredoxin II is an essential antioxi-
dant enzyme that prevents the oxidative inactivation of VEGF receptor-2
in vascular endothelial cells. Mol Cell. 2011;44:545–558.
42. Wheaton K, Sampsel K, Boisvert FM, Davy A, Robbins S, Riabowol K.
Loss of functional caveolae during senescence of human fibroblasts. J Cell
Physiol. 2001;187:226–235.
43. Nievergall E, Lackmann M, Janes PW. Eph-dependent cell-cell adhe-
sion and segregation in development and cancer. Cell Mol Life Sci.
2012;69:1813–1842.
44. Beardsley A, Fang K, Mertz H, Castranova V, Friend S, Liu J. Loss of
caveolin-1 polarity impedes endothelial cell polarization and directional
movement. J Biol Chem. 2005;280:3541–3547.
45. Joffre C, Barrow R, Ménard L, Calleja V, Hart IR, Kermorgant S. A direct
role for Met endocytosis in tumorigenesis. Nat Cell Biol. 2011;13:827–837.
46. Simons M. An inside view: VEGF receptor trafficking and signaling.
Physiology (Bethesda). 2012;27:213–222.
47. Nakayama M, Nakayama A, van Lessen M, Yamamoto H, Hoffmann S,
Drexler HC, Itoh N, Hirose T, Breier G, Vestweber D, Cooper JA, Ohno S,
Kaibuchi K, Adams RH. Spatial regulation of VEGF receptor endocytosis
in angiogenesis. Nat Cell Biol. 2013;15:249–260.
48. Yoo S, KimY, Noh H, Lee H, Park E, Park S. Endocytosis of EphA recep-
tors is essential for the proper development of the retinocollicular topo-
graphic map. EMBO J. 2011;30:1593–1607.
49. Chugh AR, Beache GM, Loughran JH, Mewton N, Elmore JB, Kajstura
J, Pappas P, Tatooles A, Stoddard MF, Lima JA, Slaughter MS, Anversa
P, Bolli R. Administration of cardiac stem cells in patients with ischemic
cardiomyopathy: the SCIPIO trial: surgical aspects and interim analysis
of myocardial function and viability by magnetic resonance. Circulation.
2012;126(11 Suppl 1):S54–S64.
50. Makkar RR, Smith RR, Cheng K, Malliaras K, Thomson LE, Berman
D, Czer LS, Marbán L, Mendizabal A, Johnston PV, Russell SD,
Schuleri KH, Lardo AC, Gerstenblith G, Marbán E. Intracoronary car-
diosphere-derived cells for heart regeneration after myocardial infarc-
tion (CADUCEUS): a prospective, randomised phase 1 trial. Lancet.
2012;379:895–904.
Clinical Perspective
Human cardiac progenitor cells (hCPCs) have recently been introduced in the experimental treatment of ischemic cardiomy-
opathy in humans. One of the critical variables of hCPC function is dictated by their motile state that conditions the translo-
cation of cells to the damaged myocardium. Cardiac aging is coupled with alterations in the migratory capacity of hCPCs,
although the mechanisms involved are largely unknown. We have found that the inadequate activation of the EphA2 receptor
in old hCPCs affects their movement in vitro and in the injured myocardium in vivo. Cellular aging does not change the
protein level of EphA2 receptors in hCPCs nor the early events involved in receptor binding to the ephrin A1 ligand, pointing
to abnormalities in the activity of this receptor tyrosine kinase in senescent cells. Our findings support the view that oxida-
tive stress is a crucial determinant of hCPC aging. The accumulation of reactive oxygen species in old hCPCs induces post-
translational modifications of the EphA2 protein interfering with the receptor tyrosine kinase function. Although the specific
residues affected by oxidative stress were not identified, oxidation is known to abrogate receptor activity. The age-dependent
consequences of EphA2 receptor oxidation were reversed by exogenously expressed functionally-competent EphA2 recep-
tors in old hCPCs. Importantly, protocols have been defined for the preferential isolation of young efficient hCPCs, a strategy
that may have significant implications in the future management of chronic heart failure.
by guest on July 14, 2015http://circ.ahajournals.org/Downloaded from
14. SUPPLEMENTAL MATERIAL
Supplemental Methods
Human CPCs
Human c-kit-positive cardiac progenitor cells (hCPCs) were isolated from discarded myocardial
tissue and cultured ex vivo as previously described (IRB protocol 2010P002475).1,2
Specimens
were obtained from patients who underwent elective cardiac surgery, or consisted of donor hearts
declined for transplantation and explanted hearts. Myocardial samples were enzymatically
dissociated and small cardiac cells were sorted for c-kit and cultured. Expanded hCPCs were
employed in the in vitro and in vivo studies described in the subsequent sections. To induce
replicative senescence, hCPCs were expanded for 4-7 passages (P) and further propagated till
P11-15. Stress-induced senescence was achieved by treatment of hCPCs at P4-P7 with 0.5 µM
doxorubicin (Sigma) for 18 hr. Cells were then washed and cultured for additional 3-5 days (see
Figure S1A). In all studies, hCPCs obtained at early (“young”) and late (“old”) passages were
employed, together with hCPCs cultured in the absence (“young”) and presence (“old”) of
doxorubicin. Stimulation with ephrin A1 involved treatment of hCPCs with 2 µg/mL of
recombinant mouse ephrin A1-human Fc (RD) for 5-30 min. Control cells were exposed to
purified human IgG (Bethyl Laboratories). Treatment with 100-200 ng/mL recombinant human
HGF (RD) was also implemented.
Inhibition of SFK activity was obtained by treating hCPCs for 30 min with 10 μM PP2
(Millipore) dissolved in dimethylsulphoxide (DMSO). Endocytosis was inhibited by incubating
hCPCs for 30 min with 20 µM of the cell-permeable dynamin inhibitor hydroxy-dynasore
(Sigma) dissolved in DMSO. In both assays, control hCPCs were exposed to an equal volume of
vehicle only.
1
15. The level of reactive oxygen species (ROS) in hCPCs was assessed with Image-IT LIVE
Green ROS Detection Kit for microscopy (Life Technologies) according to manufacturer
instructions. Young and old hCPCs were incubated with H2DCFDA, 50 μM, for 30 min.
Fluorescence intensity was measured with Wallac1420 VICTOR2 plate reader (PerkinElmer),
488 nm excitation wavelength, and normalized to the number of cells as determined based on
Hoechst33342 nucleic acid stain (Life Technologies). The superoxide indicator dihydroethdium
(DHE; Life Technologies) was also used (1 μM, 30 min) to analyze microscopically changes in
oxidative stress. To reduce the cellular level of ROS, old hCPCs were either treated over-night
with 5 mM N-acetyl-L-cysteine (NAC; Sigma), pH 7.4; or exposed to 500 U of polyethylene
glycol (PEG)-catalase (Sigma).
Immunofluorescence and Confocal Microscopy Analysis
For indirect immunolabeling, hCPCs were plated on glass coverslips, fixed for 25 min with 4%
paraformaldehyde, permeabilized for 5 min with 0.5% Triton X-100, and incubated with specific
antibodies for 45 min at ambient temperature.1-6
Primary antibodies included goat anti-human
EphA2 (RD), rabbit anti-EphA2 (Santa Cruz), rabbit anti-human c-kit (BioCare Medical),
rabbit anti-human c-kit (DAKO), mouse anti-human c-Met (RD), mouse anti-human Ki-67
(DAKO), mouse anti-human p16INK4a
(Abcam), rabbit anti-53BP1 (Cell Signaling), mouse anti-
phospho-histone H2A.X (Ser139) (Millipore), mouse anti-EEA1 (BD Transduction Laboratories),
sheep anti-human LAMP1 (RD), rabbit anti-caveolin-1 (Sigma), goat anti-caveolin-2 (RD),
mouse anti-human caveolin-3 (RD), mouse anti-clathrin heavy chain (Abcam), mouse anti-
human phospho-caveolin-1 (pY-14) (BD Transduction Laboratories), rabbit anti-phospho-Src
family (Tyr416) (Cell Signaling), rabbit anti-phosphotyrosine (Millipore), and PY-Plus mouse
anti-phosphotyrosine (Life Technologies). Secondary reagents, including donkey IgG conjugated
2
16. with fluorescein isothiocyanate (FITC), tetramethyl rhodamine isothiocyanate (TRITC), cyanine
5 (Cy5), AlexaFluor-488, AlexaFluor-565, and AlexaFluor-647, were purchased from Jackson
ImmunoResearch or Life Technologies. DNA was labeled with 4;6-diamidino-2-phenylindole
(DAPI; Sigma). AlexaFluor-647-conjugated phalloidin was obtained from Life Technologies.
Recombinant ephrin A1-human Fcγ was detected with FITC- or TRITC- conjugated donkey anti-
human IgG recognizing Fcγ fragment (Jackson ImmunoResearch).
Thin tissue sections (5 µm) were obtained from ventricular myocardium of paraffin-
embedded young and old human donor hearts, and labeled with rabbit anti-ephrin A1 (Life
Technologies), goat anti-p16INK4a
(Santa Cruz), and mouse anti α-sarcomeric actin (Sigma)
antibodies as previously described.2,3,6,7
Images were acquired using BioRad Radiance 2100 (BioRad) or Olympus Fluoview
FV1000 (Olympus) confocal microscopes. The lookup tables intensity color-coding was
performed using ImageJ software (NIH). Co-localization analysis of EphA2 and EEA1 and the
determination of Pearson’s coefficient of correlation were done with the Image J JACoP (Just
Another Colocalization Plugin). Estimation of vesicle size by automated image segmentation and
surface rendering were performed using Imaris 7.4 software (Bitplane).
Immunoprecipitation, Immunoblotting, and Two-Dimensional Gel Analysis
Young and old hCPCs were lysed in RIPA buffer containing protease and phosphatase inhibitors.
Human heart tissue was processed in lysis buffer containing 0.5% deoxycholic acid (Sigma). To
estimate relative level of protein expression, 25-50 μg of protein extract was used for SDS-
PAGE.2-4,7,8
Western blot was performed with the primary antibodies listed above and HRP-
conjugated secondary reagents (Jackson ImmunoResearch). Equal loading was documented by
immunoblotting with rabbit anti-GAPDH (Cell Signaling) or mouse anti-cardiac α-actinin
3
17. (Sigma) antibody. For immunoprecipitation, 100 μg of proteins were incubated overnight with 5
μg/mL goat anti-human EphA2 (RD), followed by 1 hr incubation with PureProteome protein
A magnetic beads (Millipore), according to manufacturer’s instruction. EphA2 was detected
using rabbit anti-EphA2 (Santa Cruz). Two-dimensional electrophoresis analysis included young
hCPCs, old hCPCs, and young hCPCs exposed to acute oxidative stress, 300 μM H2O2 for 30
min. Protein cell lysates was obtained in Tris-HCl buffer with 6M urea, 30% glycerol and 2%
SDS; in all cases, 200 μg proteins were separated using ReadyStrip IPG Strips pH3-10 (BioRad)
with PROTEAN IEF system (BioRad) and further analyzed by immunoblotting. Optical density
of the bands was evaluated using ImageJ.
Flow-Cytometry Studies
The expression of EphA2 on the plasma membrane of hCPCs was determined with goat anti-
human EphA2 (RD), followed by staining with AlexaFluor-647-conjugated anti-goat IgG
(Jackson ImmunoResearch). c-Met was detected with FITC-conjugated rat anti-human c-Met
(eBioscience). Secondary reagents and isotype-matched IgG were used as background controls.
Telomere length in hCPCs was measured by flow-cytometry and fluorescence in situ
hybridization (Flow-FISH), following a previously described protocol (Baerlocher et al., 2006;
Bolli et al., 2011).9,10
hCPCs were combined with L5178Y-R mouse lymphoma cells of known
telomere length (48 kb).1,10,11
L5178Y-S mouse lymphoma cells carrying 7 kb-long telomeres
were analyzed as control for assay fidelity. Cells were incubated in a solution containing 0.3
μg/mL of AlexaFluor-647-conjugated (CCCTAA)3 peptide nucleic acid (PNA) probe (Panagene).
Blank samples consisted of cells not exposed to the PNA probe. DNA denaturation was
performed at 87ºC for 15 min and was followed by 2 hr hybridization at room temperature.
Samples were also labeled with AlexaFluor-488-conjugated rat anti-mouse CD45 (BioLegend) to
4
18. distinguish mouse lymphocytes and hCPCs. DNA was counterstained with 0.5 µg/mL propidium
iodide solution (Sigma). Calibration of the flow-cytometer and calculations of the molecules of
equivalent soluble fluorochrome (MESF) units were performed using Quantum APC
microspheres (Bang Laboratories). Acquisition was performed with FACPCanto II flow-
cytometer (BD Biosciences) and data were analyzed using FlowJo v7/9 software (Tree Star).
Transwell Migration
Spontaneous motility and chemotaxis of young and old hCPCs were examined as previously
described:2
cells were treated with 2 μg/mL ephrin A1 for 10 min and loaded in the upper well of
the uncoated transwell permeable support system (8 μm pore size; Corning). Lower wells
contained growth medium with or without 200 ng/mL recombinant human HGF (RD). After 5
hr of incubation, transmigrated cells were detached from the filter with Trypsin-EDTA (Sigma),
and their number was determined by flow-cytometry. Control cells were studied in the absence
of ephrin A1 stimulation. In a set of experiments, cells were pre-treated for 30 min with 300 µM
H2O2 or 20 µM dynasore.
Lentiviral Infection of hCPCs
The pLentiV plasmid for the lentiviral expression of EGFP expression, and the 3-plasmid system
to generate lentiviral particles (LV-EGFP) were previously described.12
Full-length human
EphA2 sequence (EPHA2:Homo sapiens, Gene ID: 1969) was obtained from the pJP1520
retroviral expression vector, purchased from the DNASU Plasmid Repository PSI:Biology-
MR Biodesign Institute (Arizona State University, Tempe, AZ). PCR-based site-directed
mutagenesis was performed to remove the termination codon in the EphA2 open reading frame,
followed by ligation with the pLentiV plasmid to enable expression of the fusion protein EphA2-
5
19. EGFP. The plasmid for lentiviral expression of RFP was purchased from Thermo Scientific.
Infection of hCPCs was carried out as described.1,2,6,12
Imaging of hCPC Translocation in Vivo
Young and old hCPCs were infected with lentiviruses expressing EGFP or RFP, respectively.
The two cell populations were combined in a 1:1 ratio, pre-treated for 10 min with 2 μg/mL of
ephrin A1, and mixed with 0.1% volume of InSpek Blue 2.5 µM fluorescent microspheres (Life
Technologies). The procedures followed were in accordance with institutional guidelines.
Shortly after coronary ligation, 100,000 hCPCs were injected at 4 different sites in the border
zone of the hearts of 2-3 month-old C57BL/6 mice.2
One hr later, hearts were excised, mounted
on the stage of a two-photon microscope (Bio-Rad Radiance 2100MP), and continuously
perfused with oxygenated Tyrode solution. Observation of the left ventricular free wall and
acquisition of the images was performed with LaserSharp 2000 (BioRad) over a period of 1-3 hr
per observation field, for a cumulative time of 6-8 hr per heart. Cell trajectories were generated
using ImageJ manual tracking plugin. Cell velocity (distance/time) was calculated, and the
random tissue movement during the imaging was compensated by measuring the displacement of
fluorescent microspheres.
Endocytosis of Ephrin A1 and Transferrin
Young and old hCPCs were simultaneously incubated with 1 µg/mL of AlexaFluor-647-
conjugated transferrin (Life Technologies) and 1 µg/mL of ephrin A1-FITC to assess the
efficiency of ligand internalization into the cytosol. Prior to cell exposure, recombinant ephrin
A1-human Fc was pre-clustered for 5 min with 1.5 µg/mL FITC-conjugated anti-human Fc
(Jackson ImmunoResearch). Following incubation with the two ligands for 5-30 min, hCPCs
were subjected to a 2 min acid wash (0.5 M NaCl/0.5 M acetic acid, pH 2.5) to detach the
6
20. residual ligand bound to the cell surface.13
Washing of the cells in a buffer solution at pH7.4
allowed the retention of the total bound ligand on the plasma membrane and in the cells.
Fluorescence intensity was determined with a plate reader and normalized to the number of cells,
as above, or examined by flow-cytometry. The proportion of the internalized ligand was
quantified as % fluorescence intensity after acid wash versus wash at pH 7.4. In a set of
experiments, hCPCs were pre-treated with PP2 or H2O2, as above.
Live imaging of endocytosis dynamics of transferrin and ephrin A1 was studied in young
and old hCPCs, which were plated on glass-bottom culture dishes (MatTek). Cells were
incubated for 5-45 min with 2 µg/mL of TexasRed-conjugated transferrin (Life Technologies)
and pre-clustered ephrin A1-FITC; or ephrin A1-TRITC in hCPCs expressing EGFP. Time-lapse
acquisition was performed with Olympus IX71 inverted epifluorescent microscope using
CellSens Dimension software (Olympus). Automated recognition and tracking of ephrin A1-
TRITC vesicles were performed with Imaris 7.4 software using ImarisTrack module (Bitplane).
Live Imaging of hCPC Migration in Vitro
EGFP-expressing or EphA2-EGFP-infected old hCPCs were plated in a μ-slide I flowchamber
(ibidi), subjected to polarized stimulation with HGF, as recommended by manufacturer, and
imaged for 7 hr at 37ºC. Time-lapse acquisition was performed as described above and the
number of migrating cells, cell velocity and the directionality of movement were analyzed with
ImageJ using manual tracking and chemotaxis tool plugin.
Cell Sorting by Adhesion to Ephrin A1
Adhesion assay of hCPCs to immobilized ephrin A1 was performed as previously published.2
Briefly, Reacti-Bind Protein A/G-coated 96-well plates (Fisher Scientific) were incubated
overnight at 4°C with 0.3 μg/cm2
of recombinant ephrin A1-Fcγ (RD) or human IgG (Bethyl
7
21. Laboratories). Residual Fc-binding sites were blocked with 2% bovine serum albumin (Sigma).
Before plating, hCPCs were labeled with 10 μM Calcein AM (Life Technologies).
Approximately 10,000 calcein-loaded hCPCs were seeded in each well. Plates were spun down
for 2 min and subsequently incubated at 37ºC for 45 minutes. Following extensive washing, the
fraction of adhered hCPCs was estimated with fluorescent microplate reader, 488 nm excitation
wavelength.
To assess the expression of p16INK4a
and the presence of γH2A.X foci in ephrin A1-adhering
and non-adhering hCPCs, the non-adherent cells were collected after the adhesion step. The
adherent cells were detached from the plates with a non-enzymatic cell dissociation solution
(Sigma). The two populations, as well as unsorted hCPCs incubated with IgG-coated plates, were
plated on glass coverslips and analyzed by immunolabeling and confocal microscopy.
Statistical Analysis
Significance between two groups was determined by two-tailed unpaired Student’s t test. For
multiple comparisons, the ANOVA test with Bonferroni correction was employed. Quantitative
data are expressed as mean±SD.
References to Supplemental Methods
1. Bearzi C, Rota M, Hosoda T, Tillmanns J, Nascimbene A, De Angelis A, Yasuzawa-Amano
S, Trofimova I, Siggins RW, Lecapitaine N, Cascapera S, Beltrami AP, D'Alessandro DA,
Zias E, Quaini F, Urbanek K, Michler RE, Bolli R, Kajstura J, Leri A, Anversa P. Human
cardiac stem cells. Proc Natl Acad Sci USA. 2007;104:14068-14073.
2. Goichberg P, Bai Y, D'Amario D, Ferreira-Martins J, Fiorini C, Zheng H, Signore S, del
Monte F, Ottolenghi S, D'Alessandro DA, Michler RE, Hosoda T, Anversa P, Kajstura J,
8
22. Rota M, Leri A. The Ephrin A1-EphA2 system promotes cardiac stem cell migration after
infarction. Circ Res. 2011;108:1071-1083.
3. Gonzalez A, Rota M, Nurzynska D, Misao Y, Tillmanns J, Ojaimi C, Padin-Iruegas ME,
Muller P, Esposito G, Bearzi C, Vitale S, Dawn B, Sanganalmath SK, Baker M, Hintze TH,
Bolli R, Urbanek K, Hosoda T, Anversa P, Kajstura J, Leri A. Activation of cardiac
progenitor cells reverses the failing heart senescent phenotype and prolongs lifespan. Circ
Res. 2008;102:597-606.
4. De Angelis A, Piegari E, Cappetta D, Marino L, Filippelli A, Berrino L, Ferreira-Martins J,
Zheng H, Hosoda T, Rota M, Urbanek K, Kajstura J, Leri A, Rossi F, Anversa P.
Anthracycline cardiomyopathy is mediated by depletion of the cardiac stem cell pool and is
rescued by restoration of progenitor cell function. Circulation. 2010;121:276-292.
5. Cesselli D, Beltrami AP, D'Aurizio F, Marcon P, Bergamin N, Toffoletto B, Pandolfi M,
Puppato E, Marino L, Signore S, Livi U, Verardo R, Piazza S, Marchionni L, Fiorini C,
Schneider C, Hosoda T, Rota M, Kajstura J, Anversa P, Beltrami CA, Leri A. Effects of age
and heart failure on human cardiac stem cell function. Am J Pathol. 2011;179:349-366.
6. Kajstura J, Bai Y, Cappetta D, Kim J, Arranto C, Sanada F, D'Amario D, Matsuda A,
Bardelli S, Ferreira-Martins J, Hosoda T, Leri A, Rota M, Loscalzo J, Anversa P. Tracking
chromatid segregation to identify human cardiac stem cells that regenerate extensively the
infarcted myocardium. Circ Res. 2012;111:894-906.
7. Torella D, Rota M, Nurzynska D, Musso E, Monsen A, Shiraishi I, Zias E, Walsh K,
Rosenzweig A, Sussman MA, Urbanek K, Nadal-Ginard B, Kajstura J, Anversa P, Leri A.
Cardiac stem cell and myocyte aging, heart failure, and insulin-like growth factor-1
overexpression. Circ Res. 2004;94:514-524.
9
23. 8. Urbanek K, Rota M, Cascapera S, Bearzi C, Nascimbene A, De Angelis A, Hosoda T,
Chimenti S, Baker M, Limana F, Nurzynska D, Torella D, Rotatori F, Rastaldo R, Musso E,
Quaini F, Leri A, Kajstura J, Anversa P. Cardiac stem cells possess growth factor-receptor
systems that after activation regenerate the infarcted myocardium, improving ventricular
function and long-term survival. Circ Res. 2005;97:663-673.
9. Baerlocher GM, Vulto I, de Jong G, Lansdorp PM. Flow cytometry and FISH to measure the
average length of telomeres (Flow FISH). Nat Protoc. 2006;1:2365-2376.
10. Bolli R, Chugh AR, D'Amario D, Loughran JH, Stoddard MF, Ikram S, Beache GM, Wagner
SG, Leri A, Hosoda T, Sanada F, Elmore JB, Goichberg P, Cappetta D, Solankhi NK, Fahsah
I, Rokosh DG, Slaughter MS, Kajstura J, Anversa P. Cardiac stem cells in patients with
ischaemic cardiomyopathy (SCIPIO): Initial results of a randomised phase 1 trial. Lancet.
2011;378:1847-1857.
11. D'Amario D, Fiorini C, Campbell PM, Goichberg P, Sanada F, Zheng H, Hosoda T, Rota M,
Connell JM, Gallegos RP, Welt FG, Givertz MM, Mitchell RN, Leri A, Kajstura J, Pfeffer
MA, Anversa P. Functionally competent cardiac stem cells can be isolated from
endomyocardial biopsies of patients with advanced cardiomyopathies. Circ Res.
2011;108:857-861.
12. Hosoda T, D'Amario D, Cabral-Da-Silva MC, Zheng H, Padin-Iruegas ME, Ogorek B,
Ferreira-Martins J, Yasuzawa-Amano S, Amano K, Ide-Iwata N, Cheng W, Rota M, Urbanek
K, Kajstura J, Anversa P, Leri A. Clonality of mouse and human cardiomyogenesis in vivo.
Proc Natl Acad Sci USA. 2009;106:17169-17174.
10
24. 13. Goichberg P, Kalinkovich A, Borodovsky N, Tesio M, Petit I, Nagler A, Hardan I, Lapidot T.
cAMP-induced PKCzeta activation increases functional CXCR4 expression on human
CD34+ hematopoietic progenitors. Blood. 2006;107:870-879.
Legends to Supplemental Figures
Figure 1. Ageing of hCPCs and telomere length. A, Protocols for the induction of senescence of
hCPCs. B, Telomere length measured by Flow-FISH in young (black line) and old (red line)
hCPCs incubated with the telomere probe or blank solution (control: grey line). C and D,
Telomere length in each cell class is shown as mean±SD (n=7). *P0.0001. E, Morphology of
young and old hCPCs expressing c-kit (green) and EphA2 (grey). Individual fluorescent signals
are shown in the lower panels. Nuclei are stained with DAPI (blue).
Figure 2. EphA2 and c-Met receptors in hCPCs. A, Young (left) and old (right) hCPCs co-
labeled with EphA2 (green) and c-Met (red). Individual fluorescent signals are shown in the
lower panels. B, Protein level of EphA2 and c-Met in young and old hCPCs. GAPDH, loading
control. C, Expression of EphA2 and c-Met receptors on the plasma membrane of hCPCs
measured by flow-cytometry. Control, cells stained with a secondary reagent only (EphA2) or an
isotype-matched IgG (c-Met).
Figure 3. Caveolin-mediated EphA2 endocytosis in hCPCs. A, Expression of caveolin-1, -2 and
-3 isoforms in hCPCs. Human cardiomyocytes (hCMs), positive control for caveolin-3. GAPDH,
loading control. B, Sub-cellular distribution of caveolin-1 (red), caveolin-2 (blue) and EphA2
(green) in young and old hCPCs in the presence and absence (-) of ephrin A1. Areas included in
the rectangles are shown at higher magnification in the insets. Asterisks indicate accumulation of
caveolins -1 and -2 at the plasma membrane of untreated young cells (upper left panel) and in
11
25. central area of untreated old hCPCs (lower left panel). EphA2 co-localizes predominantly with
caveolin-1 (white arrowheads) in young ephrin A1-treated hCPCs (upper right panel). Co-
localization of EphA2 with caveolin-2 is less evident. Co-labeling of internalized EphA2 with
caveolins is markedly decreased (yellow, arrowheads) in old ephrin A1-treated hCPCs (lower
right panel). C, Association of caveolin-1 (red, left) and clathrin (red, right) with vesicles
containing the internalized EphA2 (green) in young hCPCs treated for 15 min with ephrin A1.
Areas in the rectangles are shown at higher magnification in the insets. Arrows point to an
endocytic vesicle co-labeled with EphA2 and caveolin-1. D, EphA2 binding to caveolin-2 and
clathrin was established by co-immunoprecipitation (IP: EphA2) in young hCPCs treated with
ephrin A1 for 25 min (+). (-) untreated hCPCs. E, Expression of the caveolin-1 protein in young
and old hCPCs. GAPDH, loading control.
Figure 4. Inhibition of phospho tyrosine phosphatase activity prevents EphA2 endocytosis in
hCPCs. hCPCs exposed to orthovanadate (left panels, control) or pervanadate (right panels). In
both cases, young hCPCs were stimulated for 15 min with ephrin A1. Following inhibition of
phospho tyrosine phosphatases with pervanadate, phospho-tyrosine labeling (upper right panel:
pTyr, red) increased and EphA2 (mid-right panel: green) failed to accumulate in the endocytic
vesicles. Lower panels, merge. Phalloidin, grey.
Figure V. Phospho-tyrosine residues accumulate in the endosomes of young hCPCs. A and B,
Endocytic vesicles containing EphA2 (blue), phospho-tyrosine (pTyr, green), and caveolin-1 (A,
red) or EEA1 (B, red) are present in young and old hCPCs stimulated with ephrin A1 for 15 min.
Areas in rectangles are shown at higher magnification in the insets. Arrows point to the co-
localization of pTyr and EphA2 in the endosomes of young cells. With respect to young hCPCs,
12
26. note the lower level of pTyr and the decreased co-labeling of EphA2 with caveolin-1 and EEA1
in old hCPCs following exposure to ephrin A1.
Figure 5. Dynamin inhibition abrogates EphA2 endocytosis and cell migration. A, hCPCs were
pre-treated for 30 min with dynasore or DMSO vehicle (control). The sub-cellular distribution of
EphA2 (green) in endocytic vesicles after ephrin A1 stimulation for 15 min is prevented by
dynasore. Areas in rectangles are shown at higher magnification in the insets. Arrows point to
the co-location of EphA2 (green) and caveolin-1 (red) in endosomes of control cells and to the
retention of EphA2 and caveolin-1 at the membrane of dynasore-treated cells. B, Transwell
migration of control and dynasore-treated hCPCs in the absence (-) and presence (+) of HGF.
Data are mean±SD (n=3). *P=0.0069 vs. (- control), #
P=0.007 vs. (- control), †P0.0001 vs. (+
control).
Legends to Supplemental Videos
Video 1. Translocation of the transplanted young and old hCPCs in the infarcted myocardium.
Young (green) and old (red) hCPCs were pre-stimulated with ephrin A1 and co-transplanted in
the infarct border zone. Images were acquired every 2 min. Time is indicated (h:min:sec).
Video 2. Dynamic analysis of the ephrin A1-containing vesicles in young and old hCPCs. Young
(left) and old (right) hCPCs expressing EGFP (green) were stimulated with pre-clustered
TRITC-ephrin A1 (red) and monitored for the indicated time. Images were acquired every 5 sec.
Overlay shows the trajectory of individual vesicles generated by automated image segmentation.
Time is indicated (min).
Video 3. Improved motility of old hCPCs after overexpression of functional EphA2. Old hCPCs
were infected with lentivirus carrying EphA2-EGFP fusion protein (LV EphA2-EGFP, right) or
13
27. 14
EGFP only (LV EGFP, left). Cells were stimulated with HGF and monitored for the indicated
time. Images were acquired every 15 min. Time is indicated (h:min:sec).