Sensors, Wearables, Wi-Fi, Video and other Technologies for Market Researchers
•
10 likes•1,195 views

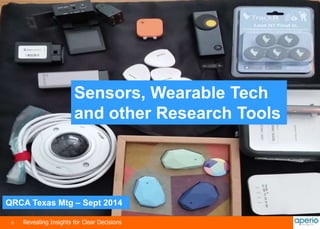
A look at new technology for conducing marketing research. Sensors, wearable cameras, Wi-Fi and Video analytics and other emerging tools for observing and understanding consumer behavior.

Recommended
Recommended
More Related Content
Similar to Sensors, Wearables, Wi-Fi, Video and other Technologies for Market Researchers
Similar to Sensors, Wearables, Wi-Fi, Video and other Technologies for Market Researchers (20)
More from Mike Courtney
More from Mike Courtney (12)
Recently uploaded
Recently uploaded (20)
Sensors, Wearables, Wi-Fi, Video and other Technologies for Market Researchers
- 1. Sensors, Wearable Tech and other Research Tools QRCA Texas Mtg – Sept 2014 0 Revealing Insights for Clear Decisions
- 2. Revealing Insights for Clear Decisions www.aperioinsights.com aperio (Latin) to reveal, uncover, make clear
- 3. WE ARE A RESEARCH COMPANY WITH A SOFTWARE MINDSET “ 2 Revealing Insights for Clear Decisions “
- 4. 3 Revealing Insights for Clear Decisions
- 5. Now Playing… The Dashboard Mystery Rated LTE 4 Revealing Insights for Clear Decisions I can’t tell, and that scares me! What’s going on in there?
- 6. 5 Revealing Insights for Clear Decisions
- 7. 6 Revealing Insights for Clear Decisions
- 8. Digital Ethnography — Sensors, Video and Apps 7 Revealing Insights for Clear Decisions
- 9. Click here for video 8 Revealing Insights for Clear Decisions
- 10. Phone Software Selection 9 Revealing Insights for Clear Decisions 9 PhoneSheriff AirWatch iPinions + TESTING Lifemetrics TESTING CuriousAnalytic s TESTING Software Price $89/year per device $5-$10/device per month for enterprise volume Project based pricing based on number of respondents Project based pricing based on number of respondents Project based pricing based on number of respondents Features • Requires Jailbreak/rooting • Requires access to physical device for setup • Parental control SW to monitor and filter teen activity • Intrusive • Leading enterprise grade mobile device management (MDM) • Provides ability to provision and control SW and HW access remotely • Limited data logging capabilities • Downloadable app • Common phone activity and app usage data captured and accessible online • Intended for research • Owned by parent company ResearchNow • In market ~ 1 year • Downloadable app • and app usage data captured and accessible online • Intended for research • Owned by parent company SurveyAnalytics • In market ~ 1 year • Downloadable app • and app usage data captured and accessible online • Intended for research • Developed by experienced market researcher • In market ~ 6 months Low Impact Solution Preferred • Available for Android and iOS • Convenient install/de-install • Detailed data capture • Minimal impact to device performance
- 11. OBD2 Dongles – Connected Car Trackers ELM327 v1.5b Bluetooth OBD-II Wireless Transceiver Dongle 10 Revealing Insights for Clear Decisions Plug-N-Track Davis Instruments 8226 CarChip Pro Carvoyant Device Base HW Price $23.80 $149.00 $74.26 $199 Service Fee N/A – Bluetooth Only $19.99/month or $180 prepaid for 12-months N/A – USB Cable Only 12-months service included with developer kit pricing Cellular WAN Solutions Preferred • Convenient install/de-install • No end user interaction required • Remote data access
- 12. Baseline Car ODB Data Capture Device Baseline ODB logging device Carvoyant unit with cellular WAN connection Location and diagnostic data via API – RPM – Speed – Miles Driven – Geo-Location – Battery Voltage – Diagnostic Trouble Codes – Fuel Usage Rate – Fuel Level – Odometer Reading Key Advantages – No cables or end user wireless device configuration needed – Developer resources willing to customize API access 11 Revealing Insights for Clear Decisions
- 13. ODB Car Data Processing Steps Currently Carvoyant batch processes data from device at the unit level and sends JSON via tar.gz file JSON Example 12 Revealing Insights for Clear Decisions 12 Unzip and convert JSON file into .csv file then manipulate the data format for import into Tableau API level access to data is available and be used with IFFT type triggers [ { "id":1351632, "timestamp":"2013-05-28 18:55:32+0000", "key":"GEN_WAYPOINT", "value":"32.116093,-80.807762", "translatedValue":"32.116093,- 80.807762" },{ "id":1351633, "timestamp":"2013-05-28 18:55:32+0000", "key":"GEN_SPEED", "value":"31.2", "translatedValue":"31.2 mph" },{ "id":1351634, "timestamp":"2013-05-28 18:55:32+0000", "key":"GEN_VOLTAGE", "value":"13.8", "translatedValue":"13.8V" } ] Formatted for Tableau
- 14. OBD2 Dongles – Connected Car Trackers Cont. Automatic Fuse 13 Revealing Insights for Clear Decisions Mojio • Smartphone app that connects you to your cars • Off-the-shelf gizmo that plugs into your car’s diagnostics outlet • Personal cloud to connect your car with the rest of your life • Auto accessory that talks to your car’s onboard computer • Uses your smartphone’s GPS & data plan to upgrade your car's capabilities. • A cellular and GPS device that connects to almost any car • Let you know what’s happening under the hood and behind the wheel
- 15. Equipment Selection Camera & DVR Options 14 Revealing Insights for Clear Decisions 14 Stick-On” Inexpensive Easy install Built-In DVR /storage Single & dual cameras “Component” Expensive Technician install Best control Up to 4 Cameras in a single video stream
- 16. Equipment Selection Camera & DVR Options 15 Revealing Insights for Clear Decisions 15 “Stick-On” Trade Offs 1/3 Field-Of-View
- 17. Minimalist Baseline — If Had to Choose a Single Camera 16 Revealing Insights for Clear Decisions 16 For criteria of this project, we recommend: “Stick-On” over “Component” R200 Dual-Camera over the others –< $100 per unit including memory & shipping – Simple, small & effective –Countless pointing options –Can capture over 18 hours –Easy to install & post-process –Night vision – Albeit no GPS
- 18. Equipment Selection Mounting Systems & In-Car Setup 17 Revealing Insights for Clear Decisions 17 Options Suction Cup Clamps & Fixtures – Proprietary – Standard 1/4-20 Camera Mount Best all-around location, shown with included proprietary mount FMVSS safety crash tested mount, with a standard 1/4-20 adaptor
- 19. Example Video Data Capture and Compilation 18 Revealing Insights for Clear Decisions
- 20. 19 Revealing Insights for Clear Decisions
- 21. Yum! What other data can you feed me? 20 Revealing Insights for Clear Decisions
- 22. Wearable Video Tools – Streaming Too! Record up to 5 hours of video. Consumer product will be discontinued by end of 2014 Looxcie HD Looxcie LX2 21 Revealing Insights for Clear Decisions
- 23. Wearable Cameras – Still Image Gear Narrative Clip • 5MP camera • Up to 4,000 images per charge • Internal rechargeable battery 22 Revealing Insights for Clear Decisions Autographer • 5MP low-light image sensor • Wide-angle lens • Camera has 5 distinct sensors • GPS module • Up to 27 000 images stored • 8GB internal memory • Internal rechargeable battery • Up to 12 hours of continuous use
- 24. Connected BLE Sensors ― Activity Tracking to Understand Habits Easily monitor and track activities via low energy Bluetooth sensors. 23 Revealing Insights for Clear Decisions
- 25. BLE Beacons & Tags Estimote Beacons Small wireless sensors that you can attach to any location or object. They broadcast tiny radio signals which your smartphone can receive and interpret, unlocking micro-location and contextual awareness. 24 Revealing Insights for Clear Decisions Trackr BLE Tags Bluetooth Low Energy-powered dongles helps you find missing items ― car keys, wallet, purse or even your cat Gimbal Beacons (QUALCOMM) Lets shopkeepers offer area-based discounts and information to customers as they wander through stores, with position accuracy down to one foot.
- 26. Video Heat Mapping Uses software to locate, count and track the movement of people focused within 40x40 sponsored event area (represented in the output as colored dots) – The video processing technology provides a 'heat map' style indication of crowd density and movement, which includes a 'privacy' mode that dramatically blurs out the images of individual people. It does NOT support facial recognition or provide personal ID information – Two different (2) camera views – Data can be filtered and reviewed for different time windows within the total hours captured. 25 Revealing Insights for Clear Decisions Solution leverages discrete cameras commonly found in retail environments On-Site laptop prepares live camera data for analysis
- 27. Video Path Maps & Heat Maps 26 Revealing Insights for Clear Decisions Trip wire set between the living room and the kitchen. Note: Arrows showing traffic mostly heading towards the food. Transform video into analytics and business intelligence tool for deeper understanding of consumers’ behaviors and need states.
- 28. Video Camera Placement CAMERA 2 – SIDE ENTRY Two cameras were placed overhead to provide coverage for most of the 40x40 booth space. 27 Revealing Insights for Clear Decisions CAMERA 1 – FRONT ENTRY
- 29. Video Camera Placement cont. Bar was placed in far corner. Activity in booth can be visualized from overhead video. 28 Revealing Insights for Clear Decisions
- 30. Video Heat Maps Using video heat maps provides a non-anecdotal record of activity. Multiple camera angles can help understand patterns of activity otherwise not visible from one perspective. 29 Revealing Insights for Clear Decisions
- 31. Video Heat Maps Cont. High-traffic and areas of increased dwell time included seating space and around the display vehicle. 30 Revealing Insights for Clear Decisions
- 32. Video Trip Wire Observations Three “digital trip wires” were set up within the software for each of the two cameras to estimate how many people entered an area and which direction they headed. Analysis over time may indicate high and low-traffic areas, points of congestion, etc. 31 Revealing Insights for Clear Decisions NOTE: Drivers entrance trip wire was moved between Saturday and Sunday to more accurately reflect traffic counts. SATURDAY TRIP WIRES Camera 1 Camera 2 SUNDAY TRIP WIRES Camera 1 Camera 2 23 Aug - Trip Wire Front Entry 811 23 Aug - Trip Wire Side-Entrance 682 Total Aug. 23 Entries 1,493 24 Aug - Trip Wire Front Entry 821 24 Aug - Trip Wire Side-Entrance 711 Total Aug. 24 Entries 1,532 Total Aug. 23 + 24 Entries 3,025
- 33. Video Trip Wire Observations Cont. Trip wire activity was similar for Saturday and Sunday with peak times at the 40x40 event space from noon – 2 PM. 32 Revealing Insights for Clear Decisions
- 34. Video Path Maps The video processing technology provides a ‘directional path map' of crowd movement. System counts how many people cross that trip wire and also indicates which direction most people went. Monitoring path maps over time provided feedback to optimize floor plans and merchandising placement to purposely guide consumers to highlighted points of interest. Majority of attendees gravitated towards the drink reception area (44%) or towards the vehicle (42%) upon entering the event display area. 33 Revealing Insights for Clear Decisions
- 35. Video Path Maps Cont. Directional traffic was split evenly among those who went left vs. right (49%). 34 Revealing Insights for Clear Decisions
- 36. Wi-Fi Analytics Tool Senses Wi-Fi devices such as smartphones that come within range of the test gear – Only senses devices that have Wi-Fi turned on and are sending/receiving data packets The test gear logs the unique ID of each device (MAC address) along with the general zone of location – The only information we observed about a device is the MAC ID and manufacturer. We did not capture phone number, name, what activity was performed on device, etc. Solution tracks which devices “came back” and were logged again at a later time or date to indicate repeat traffic 35 Revealing Insights for Clear Decisions
- 37. Example: LA Studio Stage 6 – Indoor Triangulation System Red nodes represent the location of the three access points, placed on the overhead lighting truss to focus on the 40x40 event display area. 36 Revealing Insights for Clear Decisions
- 38. Wi-Fi Analytics – Known Devices Solution is able to filter out known devices – venue access points, staff devices, etc. 37 Revealing Insights for Clear Decisions
- 39. Wi-Fi Analytics – Repeat Visitors Analysis over two days shows 509 repeat visitors to event display area. 38 Revealing Insights for Clear Decisions Repeat visitors may include food servers and wait staff who may have been carrying a smartphone with Wi-Fi turned on.
- 40. Example of System Recognizing Location of Known Devices 39 Revealing Insights for Clear Decisions
- 41. Wi-Fi Device Zone Map Over 2 days, captured Wi-Fi samples representing 3,701 MAC addresses; when compared with 3,025 entries to the event display area (video trip wires), suggests that ~81% of active Wi-Fi devices near the venue crossed a virtual trip wire to enter the 40x40 space. 40 Revealing Insights for Clear Decisions Legend: • Green dots = access points • Yellow dots = known devices • Orange dots = event attendees Note: Not all attendees carried a Wi-Fi enabled device, or had their device on, device may be in ‘sleep’ or ‘low power mode’ where the Wi-Fi is largely inactive 23 Aug - Wi-Fi Samples 325,554 24 Aug - Wi-Fi Samples 287,546 23+24 Aug - Total Wi-Fi Samples 613,100 23 Aug - Saturday IDs 1,903 24 Aug - Sunday IDs 1,798 23+24 Aug - Total MAC IDs 3,701 23+24 Aug - Total IDs 3,701 23+24 Aug - Unique IDs 3,192 23+24 Aug - Repeat MAC IDs 509
- 42. Facial Sentiment ― Cara Emotion from IMRSV Computer vision software platform – Uses existing cameras (wearable, mobile, tablet, PC) – Measures audience data: emotions, demographics and attention time in the real world Detects multiple people up to 25 feet using basic web camera Requires no calibration or setup; runs on low power/low latency embedded devices 90+% accuracy and responds in less than 20 milliseconds Available for Windows, OSX, Linux, Android and coming soon to iOS 41 Revealing Insights for Clear Decisions
- 43. Demo: Cara Emotion from IMRSV 42 Revealing Insights for Clear Decisions
- 44. Voice Emotion Sentiment ― Moodies Emotion Analytics 43 Revealing Insights for Clear Decisions
- 45. In summary, Why Use This Stuff? Sensors and Wearables provide context for QUAL 44 Revealing Insights for Clear Decisions Augments and Validates Diary exercises Reduce Bias Detect Patterns of Behavior a Human Might Miss
- 46. THANK YOU 45 Revealing Insights for Clear Decisions Mike Courtney mike@aperioinsights.com 469-363-0109 | aperioinsights.com
- 47. About Aperio Insights Who We Are Marketing research professionals who have run global research departments for Fortune 500 companies and have a passion for helping companies understand their customers’ motivation and preferences at a deeper level. We help uncover what they like, don’t like and how much they are willing to pay for it. We’re all familiar with the problem of “drowning in data” and the need for results that go beyond simple “information” to deliver truly actionable insights. – Raw data drowns you – Information overloads you – Insight guides you What We Do We are a full service research agency experienced in both qualitative and quantitative methodologies. As highly trained researchers, we have in-house expert moderators, experienced survey writers, and analysts using the latest methods and technology. Our sole purpose is to provide clients a level of understanding and clarity that guides and ultimately results in better decisions. Why We Do It Understanding customer needs and preferences is an important part of identifying and validating new opportunities. It is important to continually test and explore customer attitudes and beliefs to leverage opportunities while controlling risk. How We Do It – Laser focus on problem definition with a deep emphasis on actionable objective. – Expert research design, data collection and analysis -- Our team holds advanced degrees in marketing research, statistics and consumer psychology. – A multimedia approach to communicating the insights and recommendations. Why It Matters The best marketing research won’t make the decisions for you, but leveraging research can drastically reduce wasting time and money in the long run. Aperio Insights helps clients make knowledgeable, fact based decisions. 46 Revealing Insights for Clear Decisions
- 48. e: mike@aperioinsights.com m: 469.363.0109 www.aperioinsights.com 47 Revealing Insights for Clear Decisions