1. Equity Shares 65.34% 9.70%
Auto 4.50%
Mahindra & Mahindra Ltd. 1.69%
Tata Motors Ltd. 1.06%
TVS Motor Company Ltd. 0.88%
Hero Motocorp Ltd. 0.86%
Auto Ancillaries 2.16%
Motherson Sumi Systems Ltd. 1.46%
Exide Industries Ltd. 0.35%
Apollo Tyres Ltd. 0.35%
Banks 12.00%
• HDFC Bank Ltd. 5.25%
ICICI Bank Ltd. 2.60%
Axis Bank Ltd. 1.51%
Kotak Mahindra Bank Ltd. 0.96%
IndusInd Bank Ltd. 0.77%
State Bank Of India 0.44%
Union Bank Of India 0.35%
The Federal Bank Ltd. 0.12%
Cement 3.13%
ACC Ltd. 1.71%
Grasim Industries Ltd. 0.87%
Ambuja Cements Ltd. 0.56%
Chemicals 0.36%
Tata Chemicals Ltd. 0.30%
Deepak Fertilizers and Petrochemicals Corporation Ltd. 0.06%
Construction 0.40%
Sobha Ltd. 0.40%
Construction Project 1.05%
Larsen & Toubro Ltd. 1.05%
Consumer Durables 2.28%
Titan Company Ltd. 1.03%
Havells India Ltd. 1.00%
Bata India Ltd. 0.26%
Consumer Non Durables 5.24%
• ITC Ltd. 3.01%
Tata Global Beverages Ltd. 0.82%
Procter & Gamble Hygiene and Health Care Ltd. 0.48%
United Spirits Ltd. 0.42%
Manpasand Beverages Ltd. 0.27%
Berger Paints India Ltd. 0.23%
Ferrous Metals 0.55%
Steel Authority Of India Ltd. 0.55%
Finance 4.24%
Bajaj Finserv Ltd. 1.66%
Mahindra & Mahindra Financial Services Ltd. 0.92%
HDFC Ltd. 0.86%
Max India Ltd. 0.57%
Sundaram Finance Ltd. 0.23%
Industrial Capital Goods 0.84%
Bharat Heavy Electricals Ltd. 0.55%
Thermax Ltd. 0.30%
Industrial Products 0.56%
FAG Bearings India Ltd. 0.33%
Bharat Forge Ltd. 0.23%
Minerals/Mining 1.51%
Coal India Ltd. 1.51%
Oil 1.85%
Oil & Natural Gas Corporation Ltd. 1.07%
Oil India Ltd. 0.78%
Pesticides 0.55%
PI Industries Ltd. 0.38%
Rallis India Ltd. 0.17%
Petroleum Products 3.23%
• Reliance Industries Ltd. 2.71%
Indian Oil Corporation Ltd. 0.52%
Pharmaceuticals 5.14%
Cipla Ltd. 1.90%
Divi's Laboratories Ltd. 1.05%
Lupin Ltd. 0.48%
Pfizer Ltd. 0.43%
53
Equity
Debt
Fund Details
Style Box
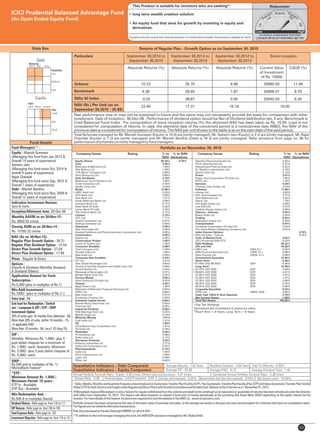
Particulars Since inception
Scheme
Nifty 50 Index
NAV (Rs.) Per Unit (as on
September 30,2015 : 25.89)
Absolute Returns (%) Absolute Returns (%) Absolute Returns (%) Current Value
of Investment
of Rs. 10000
CAGR (%)
10.00
Benchmark
Past performance may or may not be sustained in future and the same may not necessarily provide the basis for comparison with other
investment. Date of inception: 30-Dec-06 . Performance of dividend option would be Net of Dividend distribution tax, if any. Benchmark is
Crisil Balanced Fund Index . For computation of since inception returns (%) the allotment NAV has been taken as Rs. 10.00. Load is not
considered for computation of returns. In case, the start/end date of the concerned period is a nonbusiness date (NBD), the NAV of the
previous date is considered for computation of returns. The NAV per unit shown in the table is as on the start date of the said period.
Total Schemes managed by Mr. Manish Gunwani (Equity) is 10 (9 are jointly managed), Mr. Ashwin Jain (Equity) is 2 (2 are jointly managed), Mr. Rajat
Chandak (Equity) is 7 (3 are jointly managed) and Mr. Manish Banthia (Debt) is 16 (2 are jointly managed). Refer annexure from page no. 86 for
performance of schemes currently managed by fund managers.
Fund Managers** :
Equity : Manish Gunwani
(Managing this fund from Jan 2012 &
Overall 19 years of experience)
Ashwin Jain
(Managing this fund since Oct, 2014 &
overall 8 years of experience)
Rajat Chandak
(Managing this fund since Sep, 2015 &
Overall 7 years of experience)
Debt : Manish Banthia
(Managing this fund since Nov, 2009 &
Overall 12 years of experience)
Indicative Investment Horizon:
3yrs & more
Inception/Allotment date: 30-Dec-06
Monthly AAUM as on 30-Nov-15 :
Rs. 9850.59 crores
Closing AUM as on 30-Nov-15 :
Rs. 10160.32 crores
NAV (As on 30-Nov-15):
Regular Plan Growth Option : 26.31
Regular Plan Dividend Option : 15.54
Direct Plan Growth Option : 27.08
Direct Plan Dividend Option : 17.88
Plans : Regular & Direct
Options :
Growth & Dividend (Monthly Dividend
& Dividend Others)
Application Amount for fresh
Subscription :
Rs.5,000 (plus in multiples of Re.1)
Min.Addl.Investment :
Rs.1000/- (plus in multiples of Re.1/-)
Exit load for Redemption / Switch
out :- Lumpsum & SIP / STP / SWP
Investment Option
20% of units upto 18 months from allotment - Nil
More than 20% of units, within 18 months - 1%
of applicable NAV
More than 18 months - Nil. (w.e.f. 07-Aug-15)
SIP :
Monthly: Minimum Rs. 1,000/- plus 5
post dated cheques for a minimum of
Rs. 1,000/- each; Quarterly: Minimum
Rs. 5,000/- plus 3 post dated cheques of
Rs. 5,000/- each.
SWP :
Rs.500 and in multiples of Re. 1/-
#
MoneyBack Feature
*STP :
Minimum Amount Rs. 1,000/-;
Maximum Period: 10 years :
STP In : Available
STP Out : Available
Min.Redemption Amt. :
Rs.500 & in multiples thereof
* Daily, Weekly, Monthly and Quarterly Frequency has introduced in Systematic Transfer Plan Facility (STP), Flex Systematic Transfer Plan Facility (Flex STP) and Value Systematic Transfer Plan Facility
(ValueSTP)forboth(SourceandTarget)underRegularandDirectPlanswithGrowth/CumulativeandDividendSub-OptionsoftheSchemesw.e.f.December07,2015.
#Moneyback feature (Moneyback is only a feature for regular withdrawal from the scheme and shall not be construed as an assurance or guarantee of returns) has been introduced under the Scheme
with effect from September 10, 2015. This feature will allow investors to redeem a fixed sum of money periodically at the prevailing Net Asset Value (NAV) depending on the option chosen by the
investor.Formoredetailsofthisfeature,InvestorsarerequestedtovisitthewebsiteoftheAMCviz.,www.icicipruamc.com.
Portfolio turnover has been computed as the ratio of the lower value of purchase and sales, to the average net assets in the past one year (sinceinception for schemes that have not completed a year).
Thefiguresarenotnettedforderivativetransactions.
Risk-freeratebasedonthelastOvernightMIBORcut-offof6.84%.
**Inadditiontothefundmanagermanagingthisfund,theADR/GDRexposureismanagedbyMr.ShalyaShah.
Sharpe Ratio : 0.99 Portfolio Beta : 0.81 R squared : 0.85
•Top Ten Holdings
Derivatives are considered at exposure value.
@
Short Term < 8 Years, Long Term > 8 Years.
10.22
4.38
-0.20
23.49
25890.00
20908.57
20040.59
Portfolio as on November 30, 2015
Returns of Regular Plan - Growth Option as on September 30, 2015
Company/Issuer Rating % to % to NAV
NAV Derivatives
Quantitative Indicators – Debt Component Average Maturity : 7.58 Years Modified Duration : 4.64 Years Yield To Maturity : 6.92%
September 30,2014 to
September 30,2015
September 30,2013 to
September 30,2014
September 30,2012 to
September 30,2013
35.70
28.89
38.87
17.31
6.98
1.87
0.56
16.18
11.48
8.79
8.26
Quantitative Indicators – Equity Component
Benchmark Std Dev (Annualised) : 9.53% Net Equity Level : 75.04%
Alembic Pharmaceuticals Ltd. 0.42%
IPCA Laboratories Ltd. 0.31%
Astrazeneca Pharma India Ltd. 0.22%
Dr. Reddy's Laboratories Ltd. 0.18%
Sanofi India Ltd. 0.15%
Power 2.61%
Power Grid Corporation Of India Ltd. 1.36%
NTPC Ltd. 1.24%
Services 0.24%
Thomas Cook (India) Ltd. 0.24%
Software 11.66%
• Infosys Ltd. 3.82%
• HCL Technologies Ltd. 2.77%
Tech Mahindra Ltd. 2.26%
Wipro Ltd. 1.79%
Info Edge (India) Ltd. 0.69%
Just Dial Ltd. 0.23%
Intellect Design Arena Ltd. 0.09%
Telecom - Services 0.35%
Bharti Airtel Ltd. 0.35%
Trading 0.44%
Redington (India) Ltd. 0.44%
Transportation 0.47%
Container Corporation Of India Ltd. 0.24%
The Great Eastern Shipping Company Ltd. 0.22%
Index Futures/Options 9.70%
• Nifty 50 Index - Futures 9.70%
Units of Mutual Fund 0.52%
ICICI Prudential Nifty ETF 0.52%
Debt Holdings 35.22%
CPs and CDs 10.62%
• HDFC Ltd. ICRA A1+ 8.65%
HDB Financial Services Ltd. CARE A1+ 0.98%
Hero Fincorp Ltd. CRISIL A1+ 0.98%
Government Securities 21.82%
@
Short Term 6.36%
• 01.44% GOI IIB 2023 SOV 6.36%
@
Long Term 15.46%
• 07.72% GOI 2025 SOV 5.54%
• 08.60% GOI 2028 SOV 4.31%
07.88% GOI 2030 SOV 2.37%
07.68% GOI 2023 SOV 1.47%
07.35% GOI 2024 SOV 0.96%
08.30% GOI 2042 SOV 0.76%
08.24% GOI 2033 SOV 0.06%
Corporate Securities 0.03%
NTPC Ltd. CRISIL AAA 0.03%
Cash, Call, CBLO & Term Deposits 2.75%
Net Current Assets -1.08%
Total Net Assets 100.00%
Company/Issuer Rating % to % to NAV
NAV Derivatives
ICICI Prudential Balanced Advantage Fund
(An Open Ended Equity Fund)
Std Dev (Annualised) : 8.35%
Entry load : Nil
Dividend History : Refer page no. from 110 to 117
SIP Returns : Refer page no. from 106 to 108
Total Expense Ratio : Refer page no. 125
Investment Objective : Refer page no. from 118 to 121
RiskometerThis Product is suitable for investors who are seeking*:
• long term wealth creation solution
• An equity fund that aims for growth by investing in equity and
derivatives.
*Investors should consult their financial advisers if in doubt about whether the product is suitable for them.
Average P/E : 24.29 Average P/BV : 5.19 Average Dividend Yield : 1.45
Annual Portfolio Turnover Ratio : Equity - 0.25 times, Others (Debt and Derivatives) - 5.01 times Combined Annual Portfolio Turnover Ratio : 5.26 times
2. ICICI Prudential Mutual Fund Corporate Office
ONE BKC, A - Wing, 13th Floor, Bandra-Kurla Complex, Mumbai 400 051, India.
Tel: 022 - 26525000 Fax: 022 - 26528100, website: www.icicipruamc.com, email id: enquiry@icicipruamc.com
Statutory Details & Risk Factors
MutualFundinvestmentsaresubjecttomarketrisks,readallschemerelateddocumentscarefully.
Disclaimer: In the preparation of the material contained in this document, the Asset Management Company (AMC) has used information that is publicly available, including information developed in-house.
Some of the material used in the document may have been obtained from members/persons other than the AMC and/or its affiliates and which may have been made available to the AMC and/or to its affiliates.
Information gathered and material used in this document is believed to be from reliable sources. The AMC however does not warrant the accuracy, reasonableness and / or completeness of any information. We
haveincludedstatements/opinions/recommendationsinthisdocument,whichcontainwords,orphrasessuchas“will”,“expect”,“should”,“believe”andsimilarexpressionsorvariationsofsuchexpressions
that are “forward looking statements”. Actual results may differ materially from those suggested by the forward looking statements due to risk or uncertainties associated with our expectations with respect to,
but not limited to, exposure to market risks, general economic and political conditions in India and other countries globally, which have an impact on our services and / or investments, the monetary and interest
policiesofIndia,inflation,deflation,unanticipatedturbulenceininterestrates,foreignexchangerates, equity prices or other rates or prices etc.
The AMC (including its affiliates), the Mutual Fund, the trust and any of its officers, directors, personnel and employees, shall not be liable for any loss, damage of any nature,
including but not limited to direct, indirect, punitive, special, exemplary, consequential, as also any loss of profit in any way arising from the use of this material in any
manner. The recipient alone shall be fully responsible/are liable for any decision taken on this material.