Would you like to learn how to draw an activity diagram in UML? Our step-by-step tutorial can show you how. You can even use Lucidchart's free editor to create, download, and share activity diagrams.
How to Drawan Activity Diagram
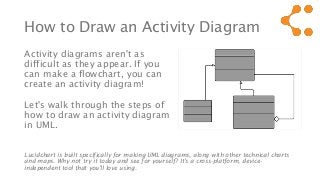
Activity diagrams aren't as
difficult as they appear. If you
can make a flowchart, you can
create an activity diagram!
Let's walk through the steps of
how to draw an activity diagram
in UML.
Lucidchart is built specifically for making UML diagrams, along with other technical charts
and maps. Why not try it today and see for yourself? It's a cross-platform, device-
independent tool that you'll love using.
3.
SELECT A MEDIUM
•You have several options for making
activity diagrams, depending on your
needs.
• Although pen and paper or a whiteboard
can be used, we recommend a robust
software program.
• Compared to their analog counterparts,
digital activity diagrams are easier to
edit, share, and store.
4.
SELECT A MEDIUMCont’d
• For the purposes of this guide, we’ll proceed as though
you’re using Lucidchart.
• Our application has responsive, pre-built shapes and
connectors, so they're simpler to style and rearrange.
• You can even add interactivity to your diagram and share
it with others on your team for real-time collaborative
editing.
5.
IDENTIFY THE COMPONENTS
•Activity diagrams are quite versatile, since they can model
both business and computational systems and flows. Start by
recording the steps of your process. Remember, activity
diagrams can be used to:
• Demonstrate a software system's workflow
• Model applications with parallel processes
• Analyze a use case by showing the what and when of its actions
• Illustrate a complex sequential algorithm
• If your use case fits one of these examples, it may be best
modeled by an activity diagram.
6.
ADD SHAPES ANDSYMBOLS
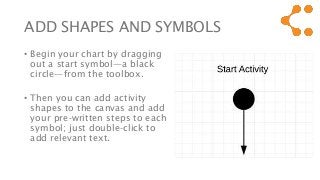
• Begin your chart by dragging
out a start symbol—a black
circle—from the toolbox.
• Then you can add activity
shapes to the canvas and add
your pre-written steps to each
symbol; just double-click to
add relevant text.
7.
CHART THE FLOW
•Activity shapes, or action shapes, reflect each major task
that the user or system (or both) performs.
• To fill out the rest of the diagram, you need to know the
direction of the control flow. This is modeled by
connecting lines between shapes.
ADD SUBSEQUENT SHAPES
•To show overlap among action shapes, use a
synchronization bar with two or more connectors, which
are either ingoing or outgoing depending on your flow.
• When your flow merges or branches out, a diamond
symbol is utilized as the catalyst.
• The diamond, also called a decision shape, represents the
triggering question or answer.
10.
ADD SHAPES Cont’d
•An unlimited number of ingoing and outgoing paths may
enter or leave the decision shape.
• To better define each path, you can drag out a text box or
double click any line to enter text.
• These definitions are known as guards.
11.
ADD SHAPES Cont’d
•The aforementioned steps are usually sufficient for a
simple activity diagram.
• However, other symbols may be used. For example, the
note symbol can communicates messages that don't fit
within the workflow itself.
• Again, to familiarize yourself with these shapes and
meanings, check out this illustrated guide of activity
diagram symbols.
12.
REVIEW PROCESS
• Toensure that you're modeling everything correctly, it
doesn't hurt to have your team members review the
finished document.
• They'll have a fresh perspective that will assist you in
spotting inefficiencies or inaccuracy.