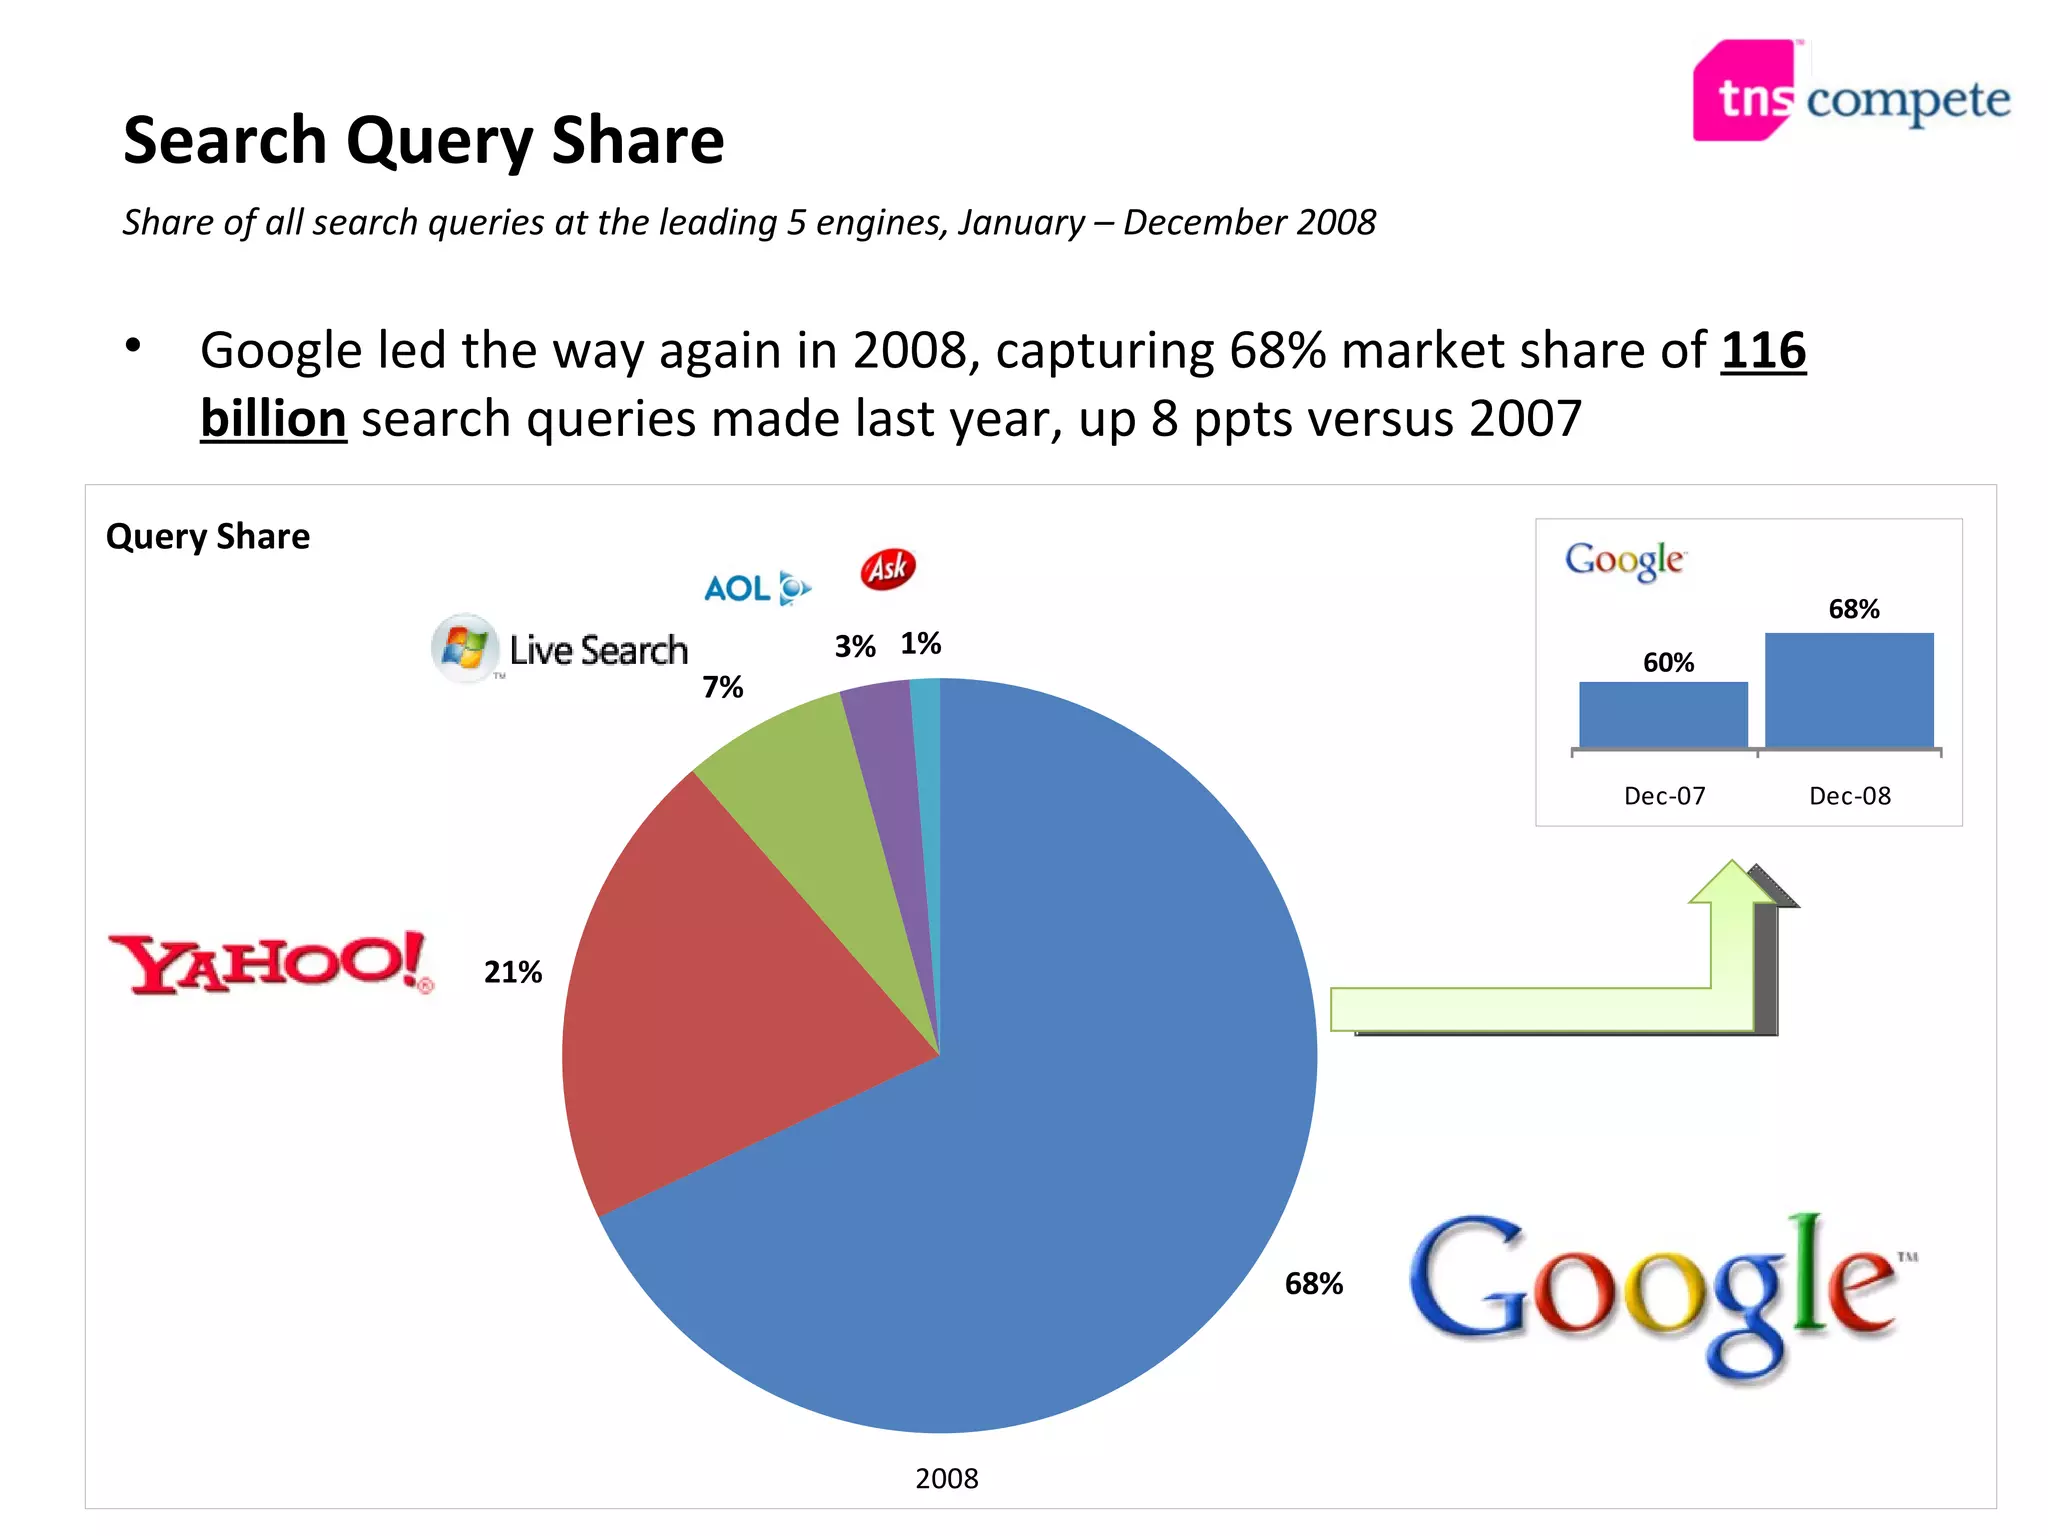
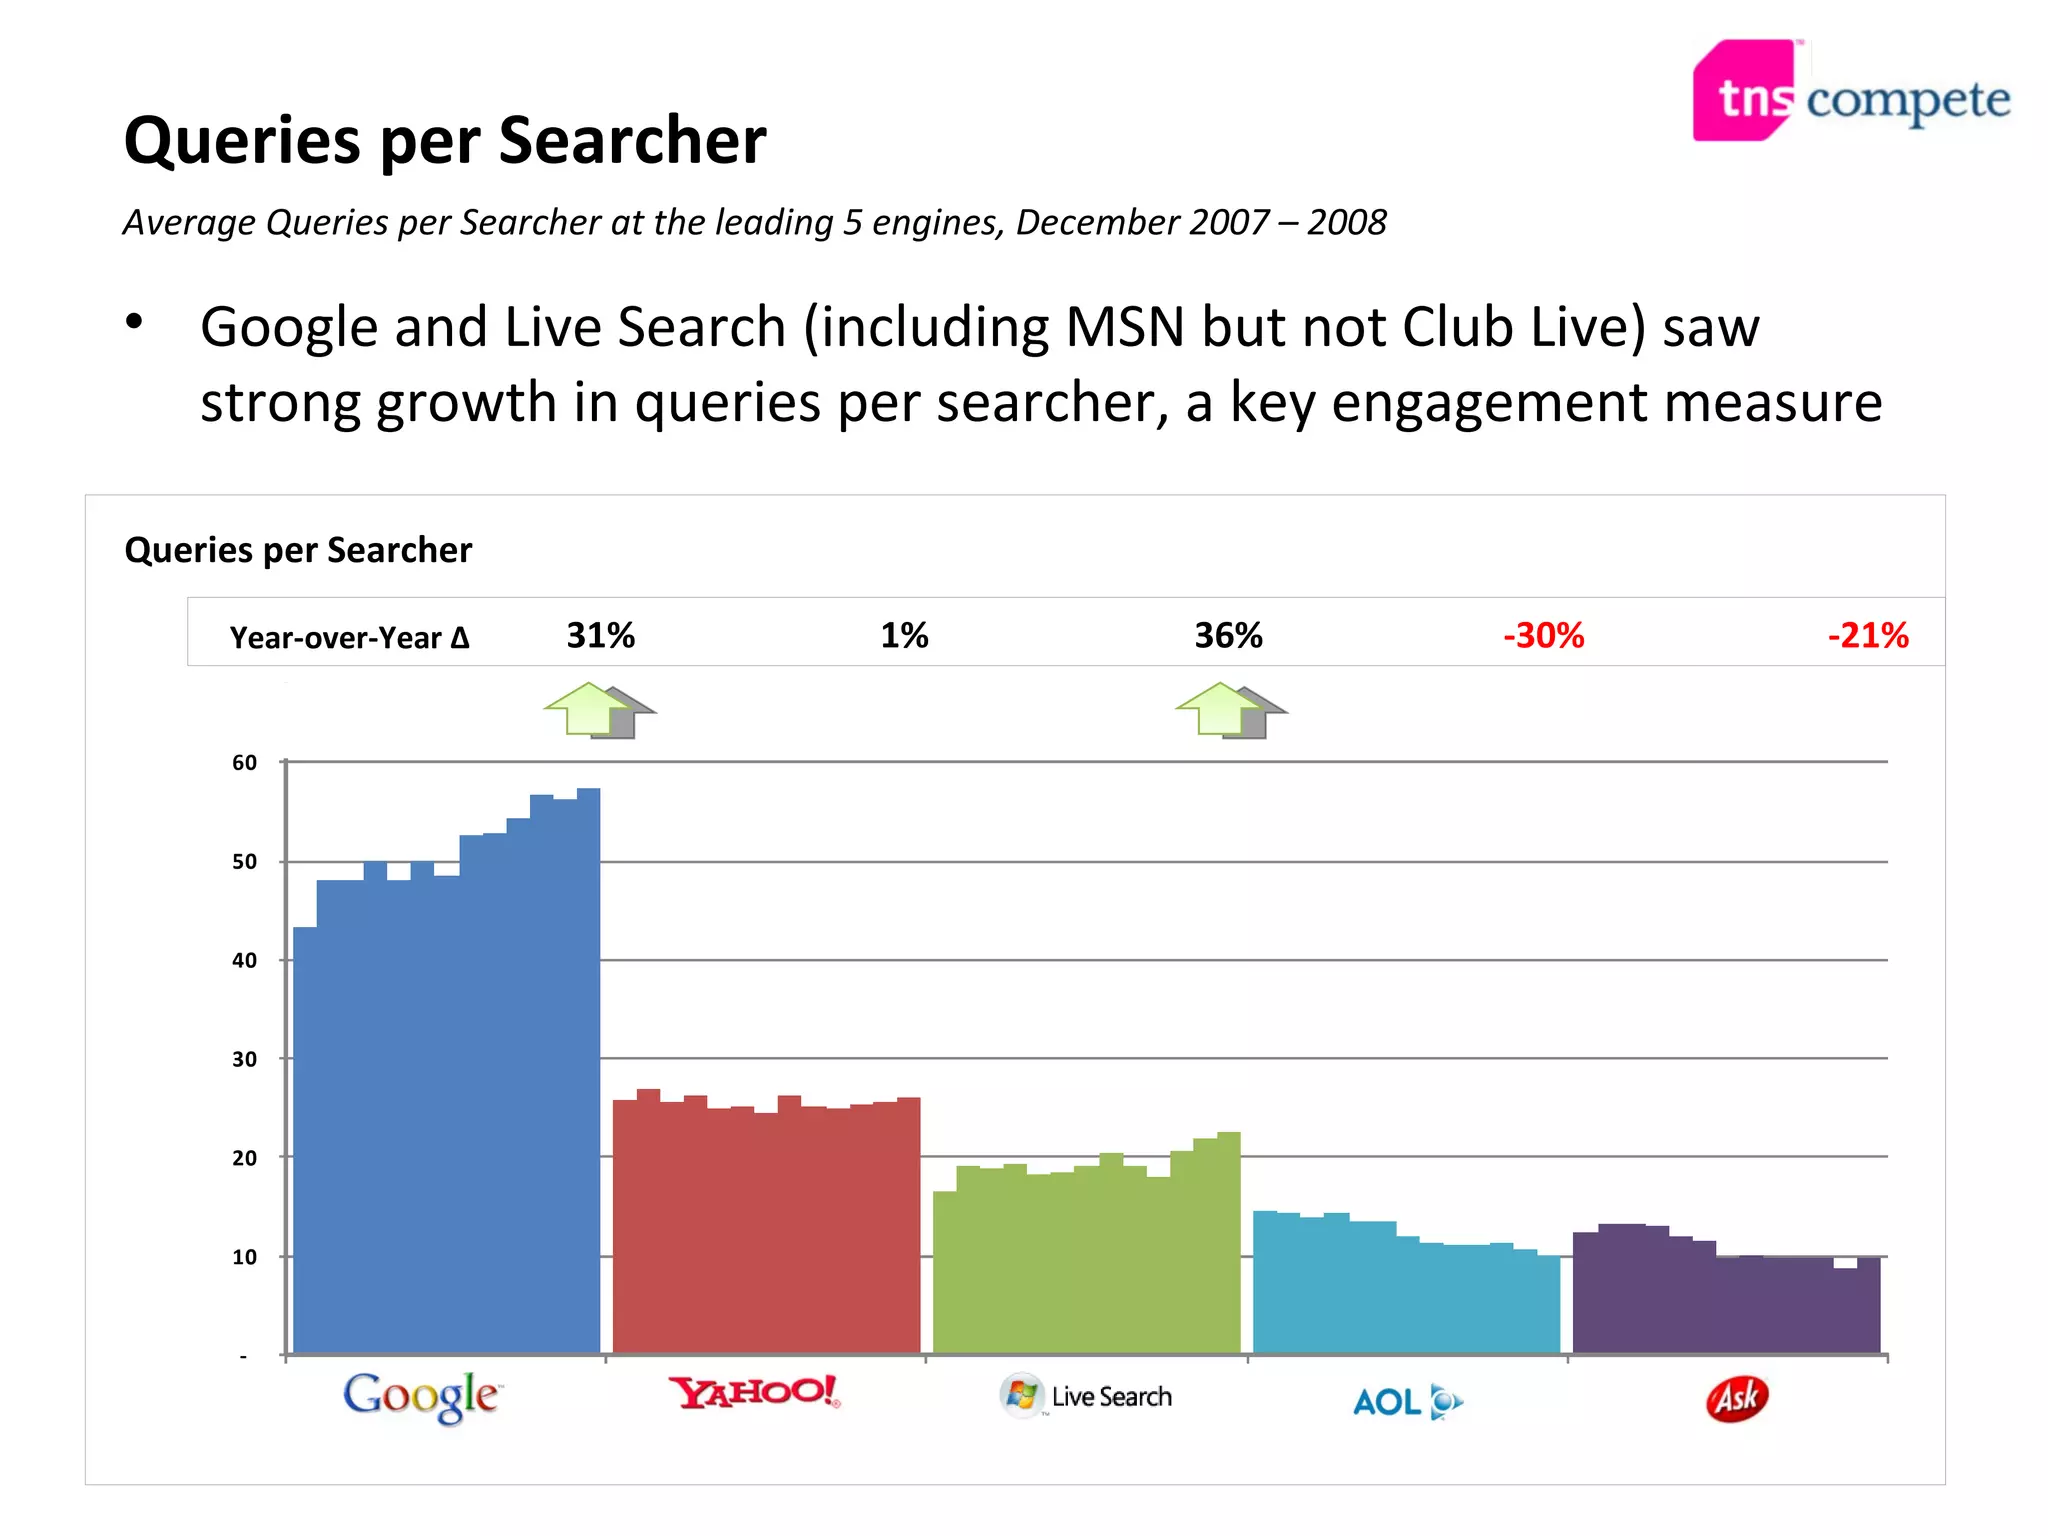
January 30, 2009 Online Media & Search: Major Trends of 2008 Outlook for 2009
Study & Methodology With 2008 officially in the history books, Compete took a look back at the major trends in Online Media & Search over the past year and made some predictions for 2009 Based on the daily web usage of more than two million members of the Compete community, Compete calculates and estimates total US-based traffic for nearly every site on the web Analyzing US traffic to the leading search engines and online media sites, Compete synthesized the major trends of 2008 The top 5 search engines account for 95% of internet searches The top 1,000 sites account for a major share of online media engagement
Google led the way again in 2008, capturing 68% market share of  116 billion   search queries made last year, up 8 ppts versus 2007 Search Query Share Share of all search queries at the leading 5 engines, January – December 2008 2008 Query Share
In a year when most other search engines lost or slightly grew query volume, Google grew 49% to nearly 8b monthly queries Search Query Volume Volume of monthly search queries at the leading 5 engines, December 2007 – 2008 49% 6% 10% -11% -24% Query Volume  (Billions) Year-over-Year ∆ (December 2007 vs. 2008)
Searchers and Engine Loyalty Google had the most searchers, and the highest rate of loyalty Volume of searchers and percentage to use only that engine, January – December 2008 Read as,  “26M people searched at Ask in December 2008, of which 12% searched only at Ask” Number of Searchers and Engine Loyalty Searchers 64% 25% 12% 14% 12% Average Loyalty
Queries per Searcher Google and Live Search (including MSN but not Club Live) saw strong growth in queries per searcher, a key engagement measure Average Queries per Searcher at the leading 5 engines, December 2007 – 2008 Queries per Searcher 31% 1% 36% -30% -21% Year-over-Year ∆
Referrals and Sponsored Referral Share Yahoo had the highest average rate of sponsored referrals Volume of referrals and percentage that were sponsored (paid), December 2007 – 2008 Read as,  “Live made 114M search referrals in December 2008, of which 8% were sponsored referrals” Referral Volume and Sponsored Share Referrals 7% 10% 3% 4% Average Sponsored Rate
Online Media Broadly speaking, the top 1,000 media sites fall into two categories Publisher Media Social Media
Media Category Growth and Reach The US internet population grew faster than the Top 1k Media sites in 2008 Media category Unique Visitor volume and share of Internet Population, December 2007 – 2008 4% -8 ppts -7 ppts Year-over-Year ∆ (December 2007 vs. 2008) Unique Visitors Reach  Media Category Unique Visitor Growth and Reach Publisher UV Publisher Reach Social UV Social Reach 7%
Media Category Visitation Visits to Publishers rose 33%, while number of Social sites visited rose 23% Media category visits and average sites per unique visitor, December 2007 – 2008 33% 19% 23% Year-over-Year ∆ (December 2007 vs. 2008) Visits Average Sites/Unique Visitor Media Category Unique Visitor Growth and Reach Publisher Visits Avg. # of Pub Sites Social Visits Avg. # of Social Sites 28%
Social Media took the lion’s share of the  2.1 trillion   page views made at the top 1k media sites last year, nearly doubling 2007 PV volume Page View Share Share of all page views at the Top 1,000 Media sites, December 2007 – 2008  Publisher Media Social Media Year-over-Year ∆ (December 2007 vs. 2008) 2008
Social Media also took 79% of the  9 billion   hours spent at the top 1k media sites last year, however that was down 1% versus 2007 Share of Time Spent Share of all time spent at the Top 1,000 Media sites, December 2007 – 2008  Publisher Media Social Media Year-over-Year ∆ (December 2007 vs. 2008) 2008
Social Media grew Pages Views enormously at the expense of Time Spent Trended Page Views and Time Spent Page Views and Hours per UV at the Top 1,000 Media sites, December 2007 – 2008  57% 33% -7% Year-over-Year ∆ (December 2007 vs. 2008) 81% Page View and Time Spent per Unique Visitor Page Views Hours Publishers Social Media
Outlook for 2009 Look for Google momentum to continue growth in query volume and market share in 2009 Watch out for Microsoft to as they invest in improving queries per searcher and searcher loyalty Possible Yahoo partnership with Microsoft would create a real rival to Google, with a combined 30% query share and strong base of loyalists Look for visitors and reach at Publisher and Social Media sites to level in 2009, but engagement to skyrocket Expect Social Media to harmonize page views and time spent, striking a balance between user engagement and display CPM Publishers should continue to integrate Social Media functionality to narrow the Social Media edge
Thank you Media inquiries, please contact: Alex Patriquin Senior Associate Online Media & Search Compete, a TNS Media Company p: 617-933-5724 e:  [email_address]

Online Media 2008

  • 1.
    January 30, 2009Online Media & Search: Major Trends of 2008 Outlook for 2009
  • 2.
    Study & MethodologyWith 2008 officially in the history books, Compete took a look back at the major trends in Online Media & Search over the past year and made some predictions for 2009 Based on the daily web usage of more than two million members of the Compete community, Compete calculates and estimates total US-based traffic for nearly every site on the web Analyzing US traffic to the leading search engines and online media sites, Compete synthesized the major trends of 2008 The top 5 search engines account for 95% of internet searches The top 1,000 sites account for a major share of online media engagement
  • 3.
    Google led theway again in 2008, capturing 68% market share of 116 billion search queries made last year, up 8 ppts versus 2007 Search Query Share Share of all search queries at the leading 5 engines, January – December 2008 2008 Query Share
  • 4.
    In a yearwhen most other search engines lost or slightly grew query volume, Google grew 49% to nearly 8b monthly queries Search Query Volume Volume of monthly search queries at the leading 5 engines, December 2007 – 2008 49% 6% 10% -11% -24% Query Volume (Billions) Year-over-Year ∆ (December 2007 vs. 2008)
  • 5.
    Searchers and EngineLoyalty Google had the most searchers, and the highest rate of loyalty Volume of searchers and percentage to use only that engine, January – December 2008 Read as, “26M people searched at Ask in December 2008, of which 12% searched only at Ask” Number of Searchers and Engine Loyalty Searchers 64% 25% 12% 14% 12% Average Loyalty
  • 6.
    Queries per SearcherGoogle and Live Search (including MSN but not Club Live) saw strong growth in queries per searcher, a key engagement measure Average Queries per Searcher at the leading 5 engines, December 2007 – 2008 Queries per Searcher 31% 1% 36% -30% -21% Year-over-Year ∆
  • 7.
    Referrals and SponsoredReferral Share Yahoo had the highest average rate of sponsored referrals Volume of referrals and percentage that were sponsored (paid), December 2007 – 2008 Read as, “Live made 114M search referrals in December 2008, of which 8% were sponsored referrals” Referral Volume and Sponsored Share Referrals 7% 10% 3% 4% Average Sponsored Rate
  • 8.
    Online Media Broadlyspeaking, the top 1,000 media sites fall into two categories Publisher Media Social Media
  • 9.
    Media Category Growthand Reach The US internet population grew faster than the Top 1k Media sites in 2008 Media category Unique Visitor volume and share of Internet Population, December 2007 – 2008 4% -8 ppts -7 ppts Year-over-Year ∆ (December 2007 vs. 2008) Unique Visitors Reach Media Category Unique Visitor Growth and Reach Publisher UV Publisher Reach Social UV Social Reach 7%
  • 10.
    Media Category VisitationVisits to Publishers rose 33%, while number of Social sites visited rose 23% Media category visits and average sites per unique visitor, December 2007 – 2008 33% 19% 23% Year-over-Year ∆ (December 2007 vs. 2008) Visits Average Sites/Unique Visitor Media Category Unique Visitor Growth and Reach Publisher Visits Avg. # of Pub Sites Social Visits Avg. # of Social Sites 28%
  • 11.
    Social Media tookthe lion’s share of the 2.1 trillion page views made at the top 1k media sites last year, nearly doubling 2007 PV volume Page View Share Share of all page views at the Top 1,000 Media sites, December 2007 – 2008 Publisher Media Social Media Year-over-Year ∆ (December 2007 vs. 2008) 2008
  • 12.
    Social Media alsotook 79% of the 9 billion hours spent at the top 1k media sites last year, however that was down 1% versus 2007 Share of Time Spent Share of all time spent at the Top 1,000 Media sites, December 2007 – 2008 Publisher Media Social Media Year-over-Year ∆ (December 2007 vs. 2008) 2008
  • 13.
    Social Media grewPages Views enormously at the expense of Time Spent Trended Page Views and Time Spent Page Views and Hours per UV at the Top 1,000 Media sites, December 2007 – 2008 57% 33% -7% Year-over-Year ∆ (December 2007 vs. 2008) 81% Page View and Time Spent per Unique Visitor Page Views Hours Publishers Social Media
  • 14.
    Outlook for 2009Look for Google momentum to continue growth in query volume and market share in 2009 Watch out for Microsoft to as they invest in improving queries per searcher and searcher loyalty Possible Yahoo partnership with Microsoft would create a real rival to Google, with a combined 30% query share and strong base of loyalists Look for visitors and reach at Publisher and Social Media sites to level in 2009, but engagement to skyrocket Expect Social Media to harmonize page views and time spent, striking a balance between user engagement and display CPM Publishers should continue to integrate Social Media functionality to narrow the Social Media edge
  • 15.
    Thank you Mediainquiries, please contact: Alex Patriquin Senior Associate Online Media & Search Compete, a TNS Media Company p: 617-933-5724 e: [email_address]