1. LIMITS
What is a Limit?
This lesson explains the concept of a limit (in Calculus) from various points of
view.
A GEOMETRIC EXAMPLE:
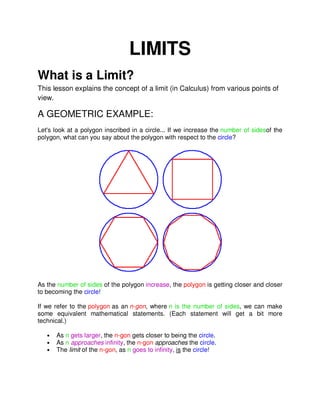
Let's look at a polygon inscribed in a circle... If we increase the number of sidesof the
polygon, what can you say about the polygon with respect to the circle?
As the number of sides of the polygon increase, the polygon is getting closer and closer
to becoming the circle!
If we refer to the polygon as an n-gon, where n is the number of sides, we can make
some equivalent mathematical statements. (Each statement will get a bit more
technical.)
• As n gets larger, the n-gon gets closer to being the circle.
• As n approaches infinity, the n-gon approaches the circle.
• The limit of the n-gon, as n goes to infinity, is the circle!
2. The n-gon never really gets to be the circle, but it will get darn close! So close, in fact,
that, for all practical purposes, it may as well be the circle. That's what limits are all
about!
Archimedes used this idea (WAY before Calculus was even invented) to find the area of
a circle before they had a value for PI! (They knew PI was the circumference divided by
the diameter... But, hey, they didn't have calculators back then.)
SOME NUMERICAL EXAMPLES:
EXAMPLE 1:
Let's look at the sequence whose nth
term is given by n/(n+1). Recall, that we let n=1 to
get the first term of the sequence, we let n=2 to get the second term of the sequence
and so on.
What will this sequence look like?
1/2, 2/3, 3/4, 4/5, 5/6,... 10/11,... 99/100,... 99999/100000,...
What's happening to the terms of this sequence? Can you think of a number that these
terms are getting closer and closer to? Yep! The terms are getting closer to 1! But, will
they ever get to 1? Nope! So, we can say that these terms are approaching 1. Sounds
like a limit! The limit is 1.
As n gets bigger and bigger, n/(n+1) gets closer and closer to 1...
EXAMPLE 2:
Now, let's look at the sequence whose nth
term is given by 1/n. What will this sequence
look like?
1/1, 1/2, 1/3, 1/4, 1/5,... 1/10,... 1/1000,... 1/1000000000,...
3. As n gets bigger, what are these terms approaching? That's right! They are
approaching 0. How can we write this in Calculus language?
What if we stick an x in for the n? Maybe it will look familiar... Do you remember what
the graph of f(x)=1/x looks like? Keep reading to see our second example shown in
graphical terms!
SOME GRAPHICAL EXAMPLES:
On the previous page, we saw what happened to the sequence whose nth term is given
by 1/n as n approaches infinity... The terms 1/n approached 0.
Now, let's look at the graph of f(x)=1/x and see what happens!
The x-axis is a horizontal asymptote... Let's look at the blue arrow first. As x gets really,
really big, the graph gets closer and closer to the x-axis which has a height of 0. So, as
x approaches infinity, f(x) is approaching 0. This is called a limit at infinity.
Now let's look at the green arrow... What is happening to the graph as x gets really,
really small? Yep, the graph is again getting closer and closer to the x-axis (which is 0.)
It's just coming in from below this time.
4. But what happens as x approaches 0?
Since different things happen, we need to look at two separate cases: what happens as
x approaches 0 from the left and at what happens as x approaches 0 from the right:
and
Since the limit from the left does not equal the limit from the right...
Let's look at a more complicated example...
Given this graph of f(x)...
5. First of all, let's look at what's happening around the dashed blue line. Recall that this is
called a vertical asymptote.
So...
Another way to think about the limit is the find the height of the graph at (or really close
to) the given x. Think about a little mountain climbing ant (call him Pierre) who is
crawling on the graph. What is Pierre's altitude when he's climbing towards an x? That's
the limit!
Let's try some more...
Let's look at what's happening at x = -7... The limit from the right is the same as the limit
from the left... But there's a hole at x = -7!
6. That's ok! We don't care what happens right at the point, just in the neighborhood
around that point. So...
Can you find the limit of f(x) as x approaches -3?
That's right!
How about the limit of f(x) as x approaches 0?
Right again!
Let's look at one more type of limit. To do this we'll show you the screen of a
TI-92 graphing calculator!
This is the graph of
(If you have a TI-92, the viewing window here is -1.5, 2.1, 1, -3.3, 4.7, 1, 2.)
It sure wiggles around a lot! But, we see that