Downloaded 234 times

![Q&A 42U Confidential ©2008 42U All rights reserved Slide For More Information Contact Your 42U Data Center Efficiency Consultant: 1-800-638-2638 or www.42U.com For a Copy of Today’s Presentation Email: [email_address] Please Type Your Questions In The Chat Window Thank You](https://image.slidesharecdn.com/42upowerstrategieswebinarpresentation081015-091214110143-phpapp01/75/Data-Center-Power-Strategies-28-2048.jpg)

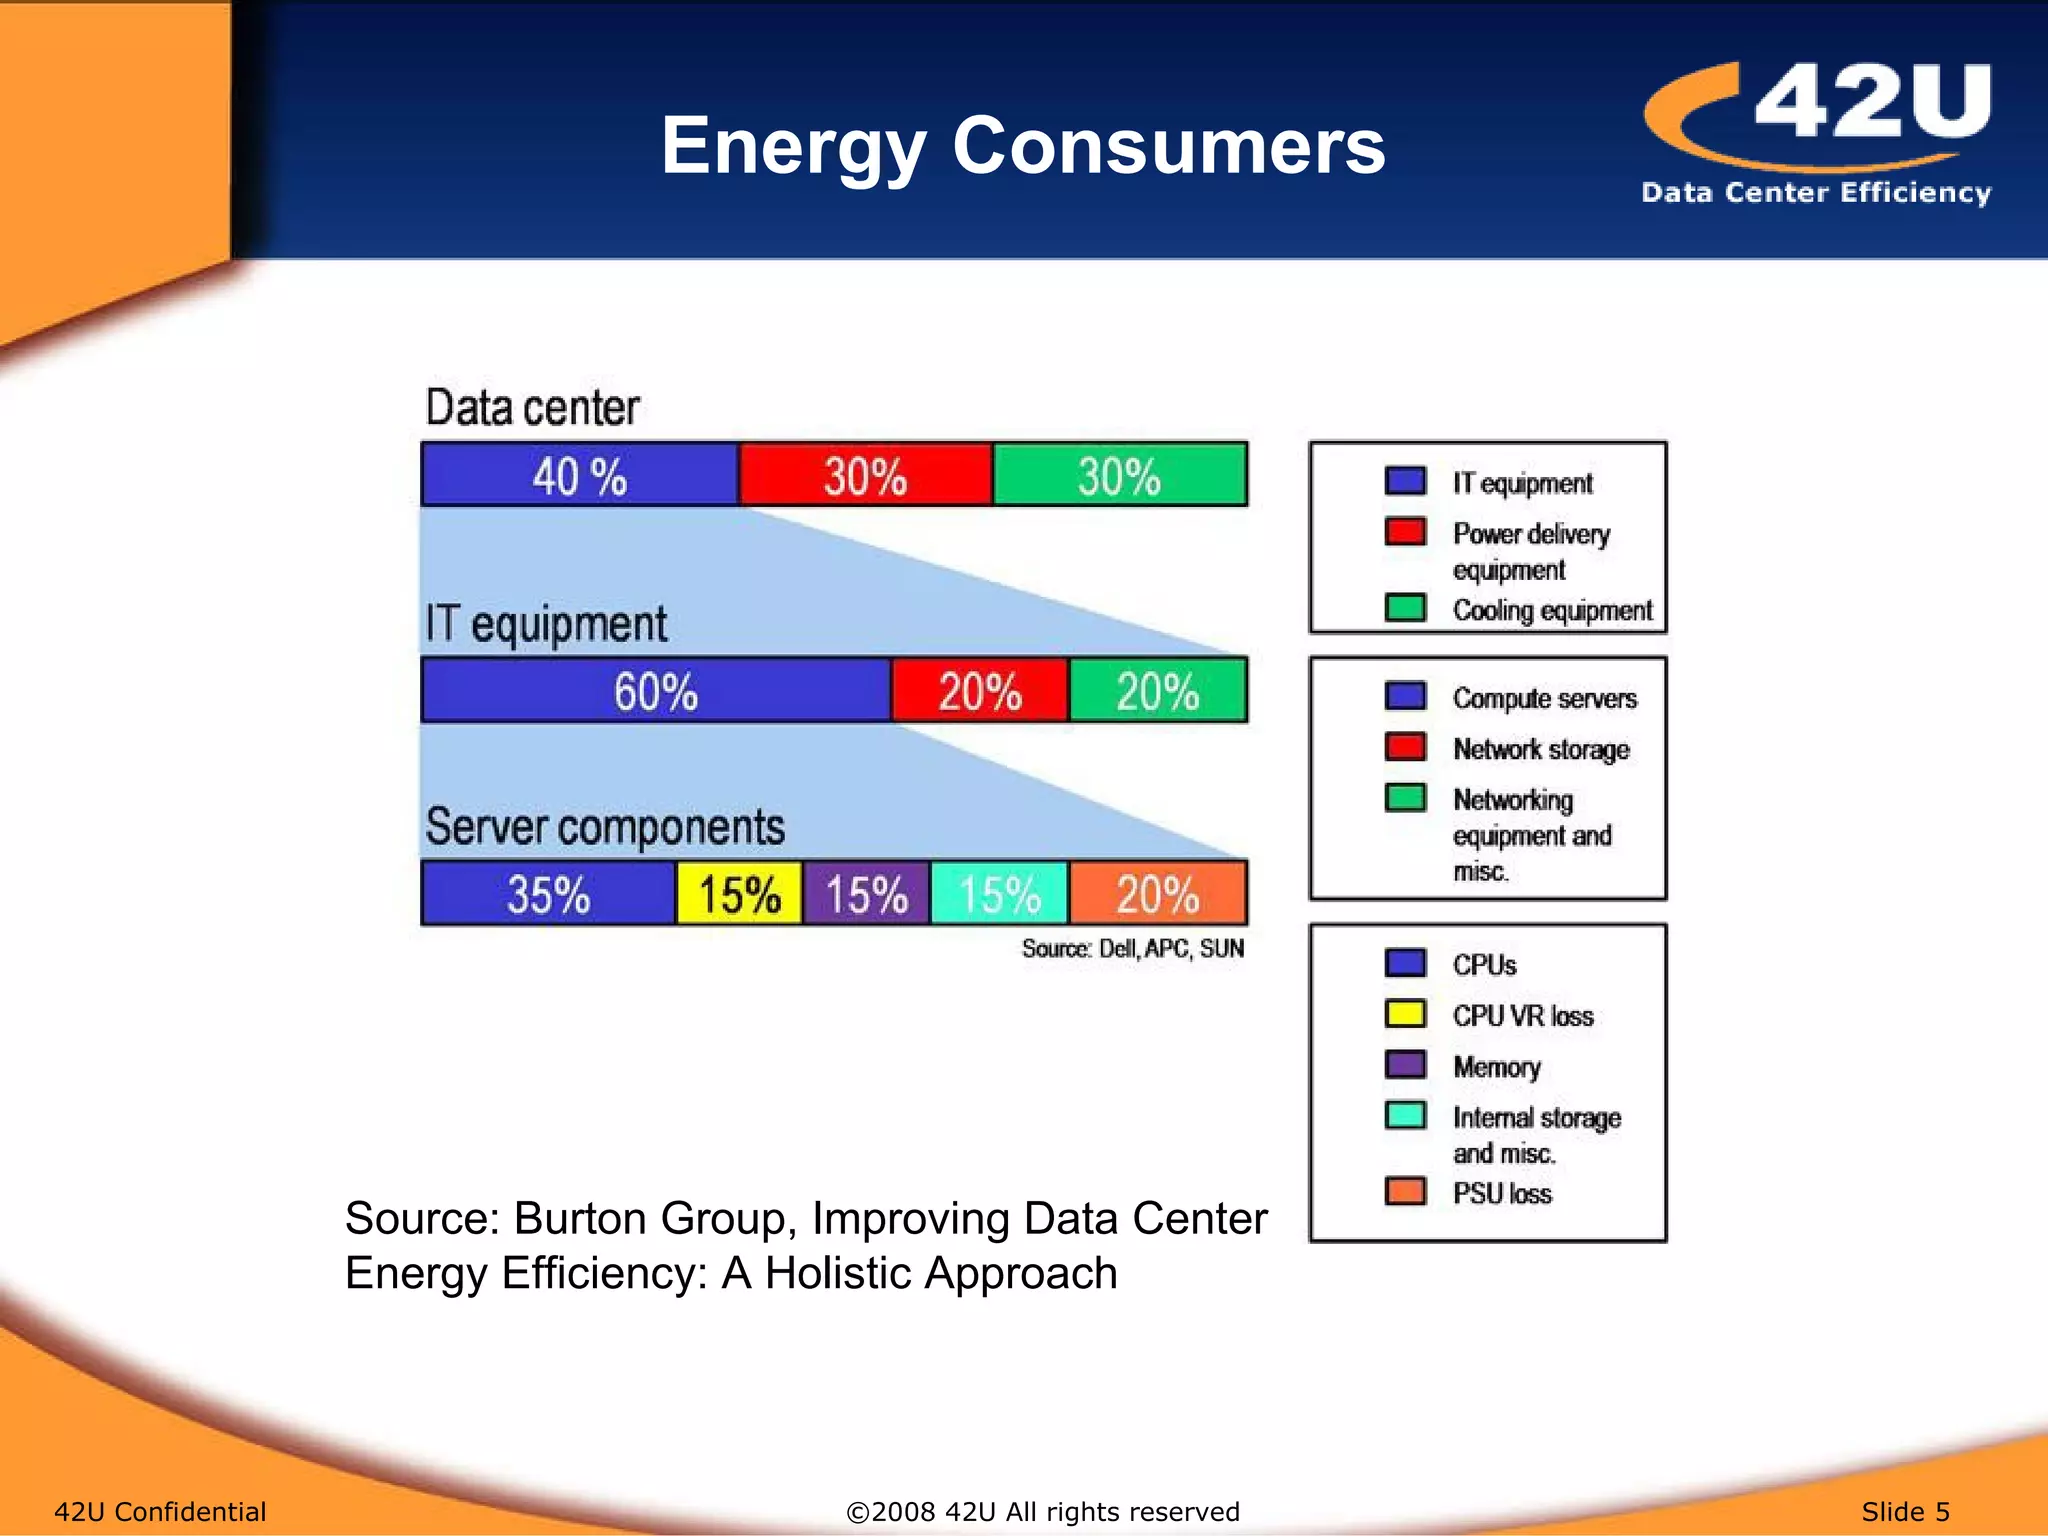
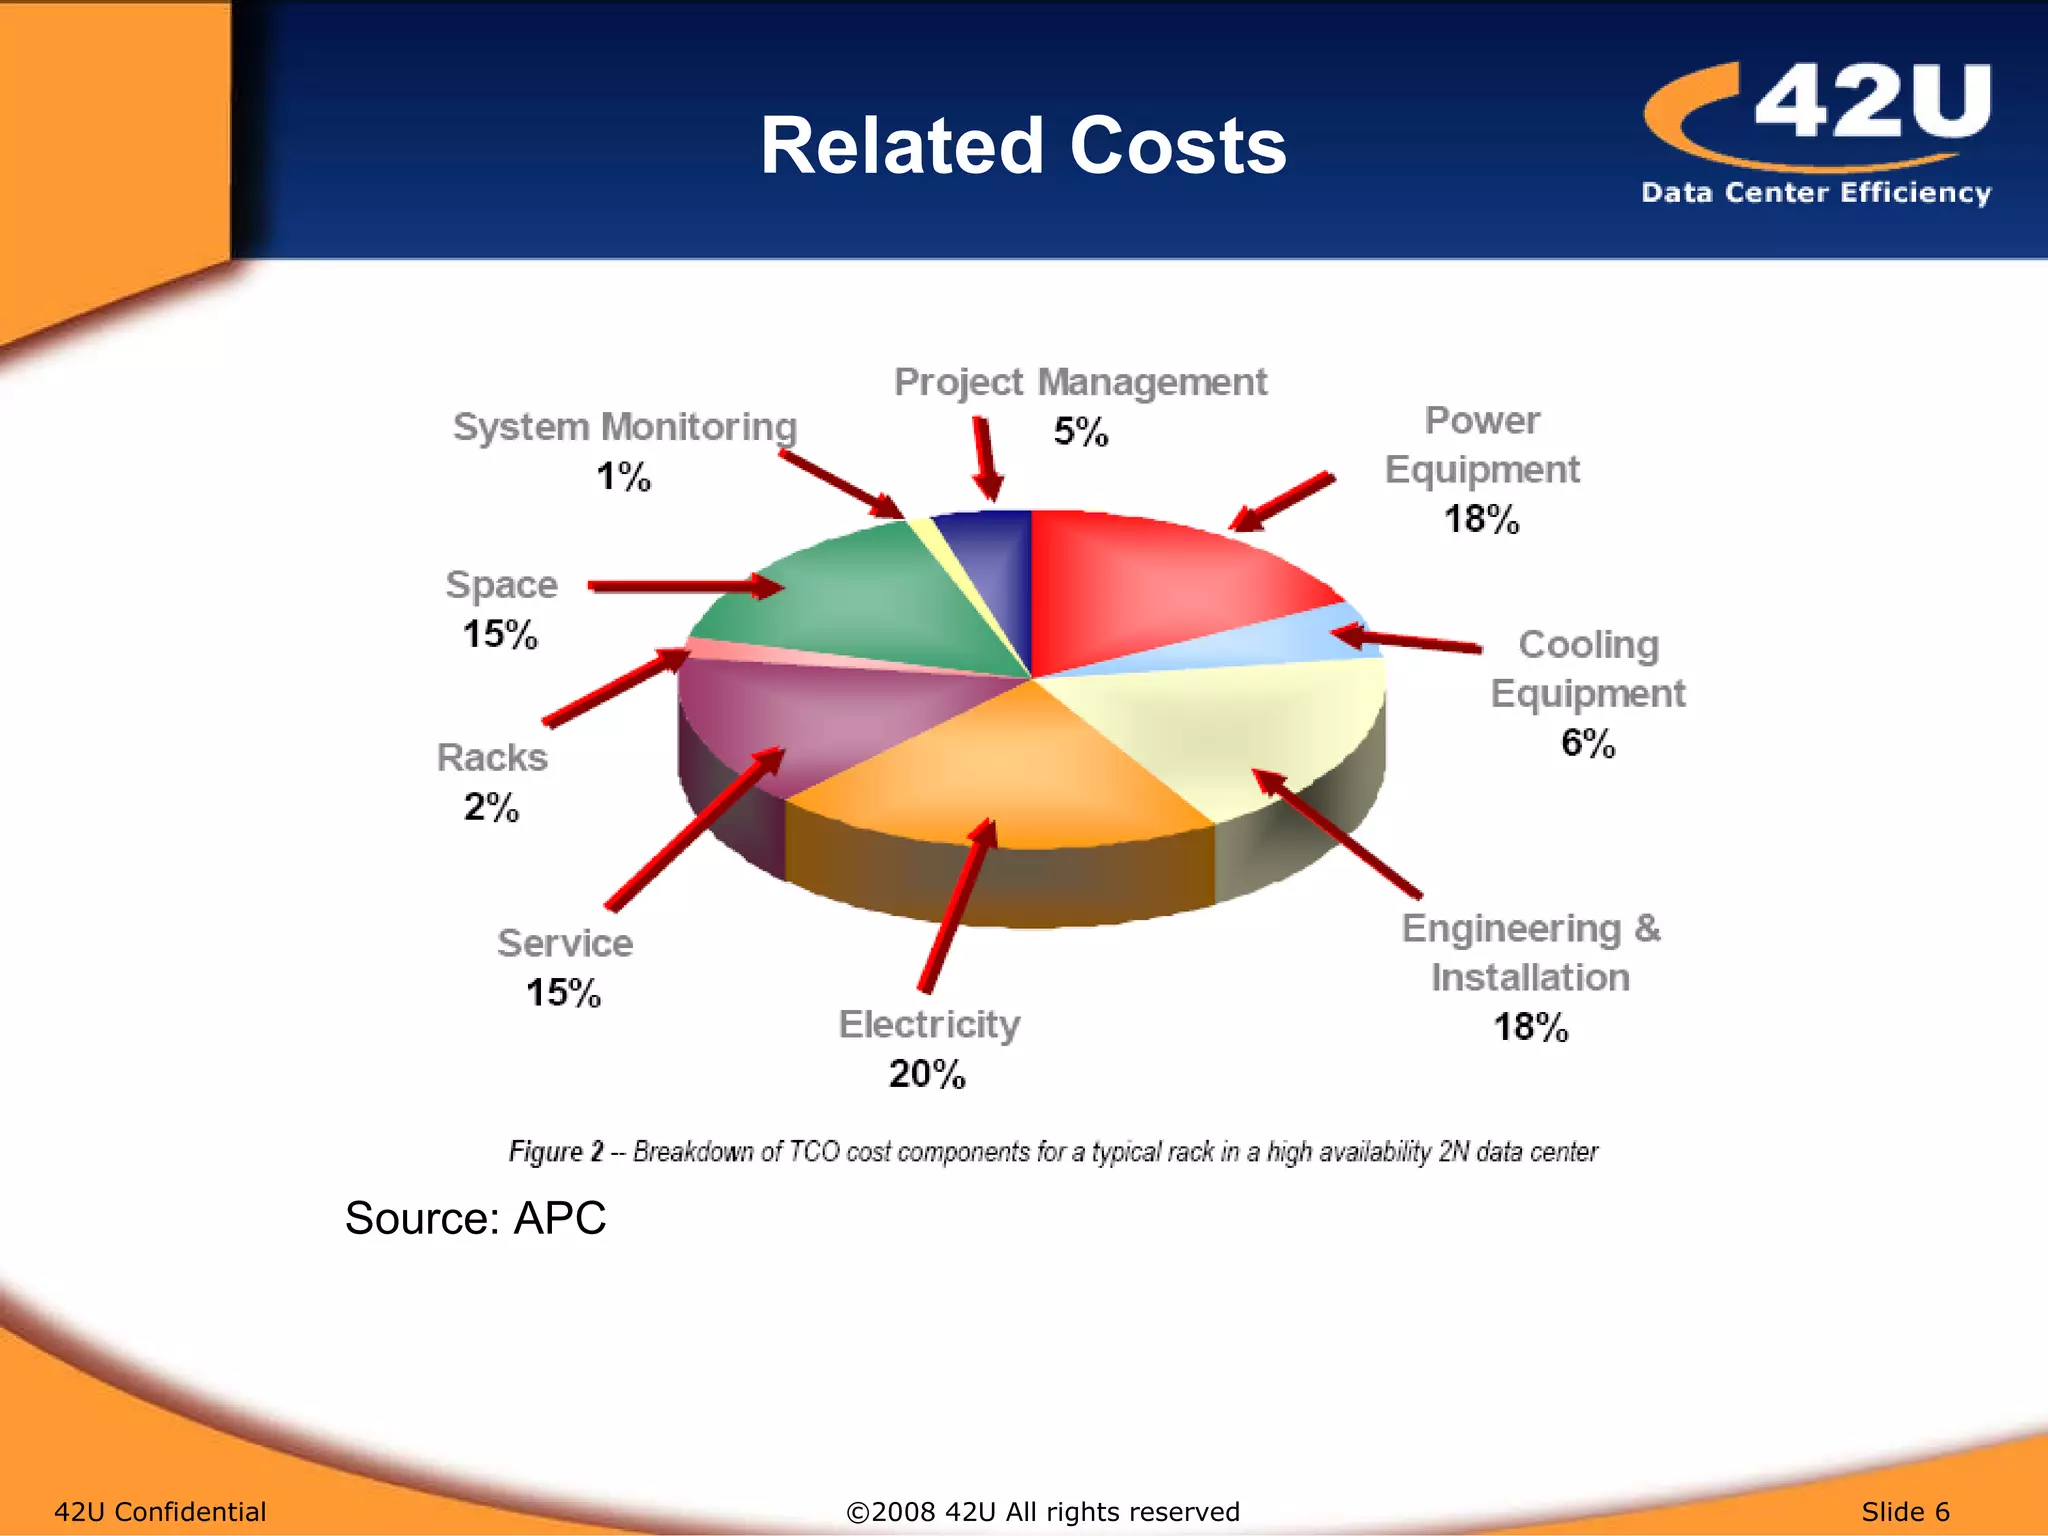
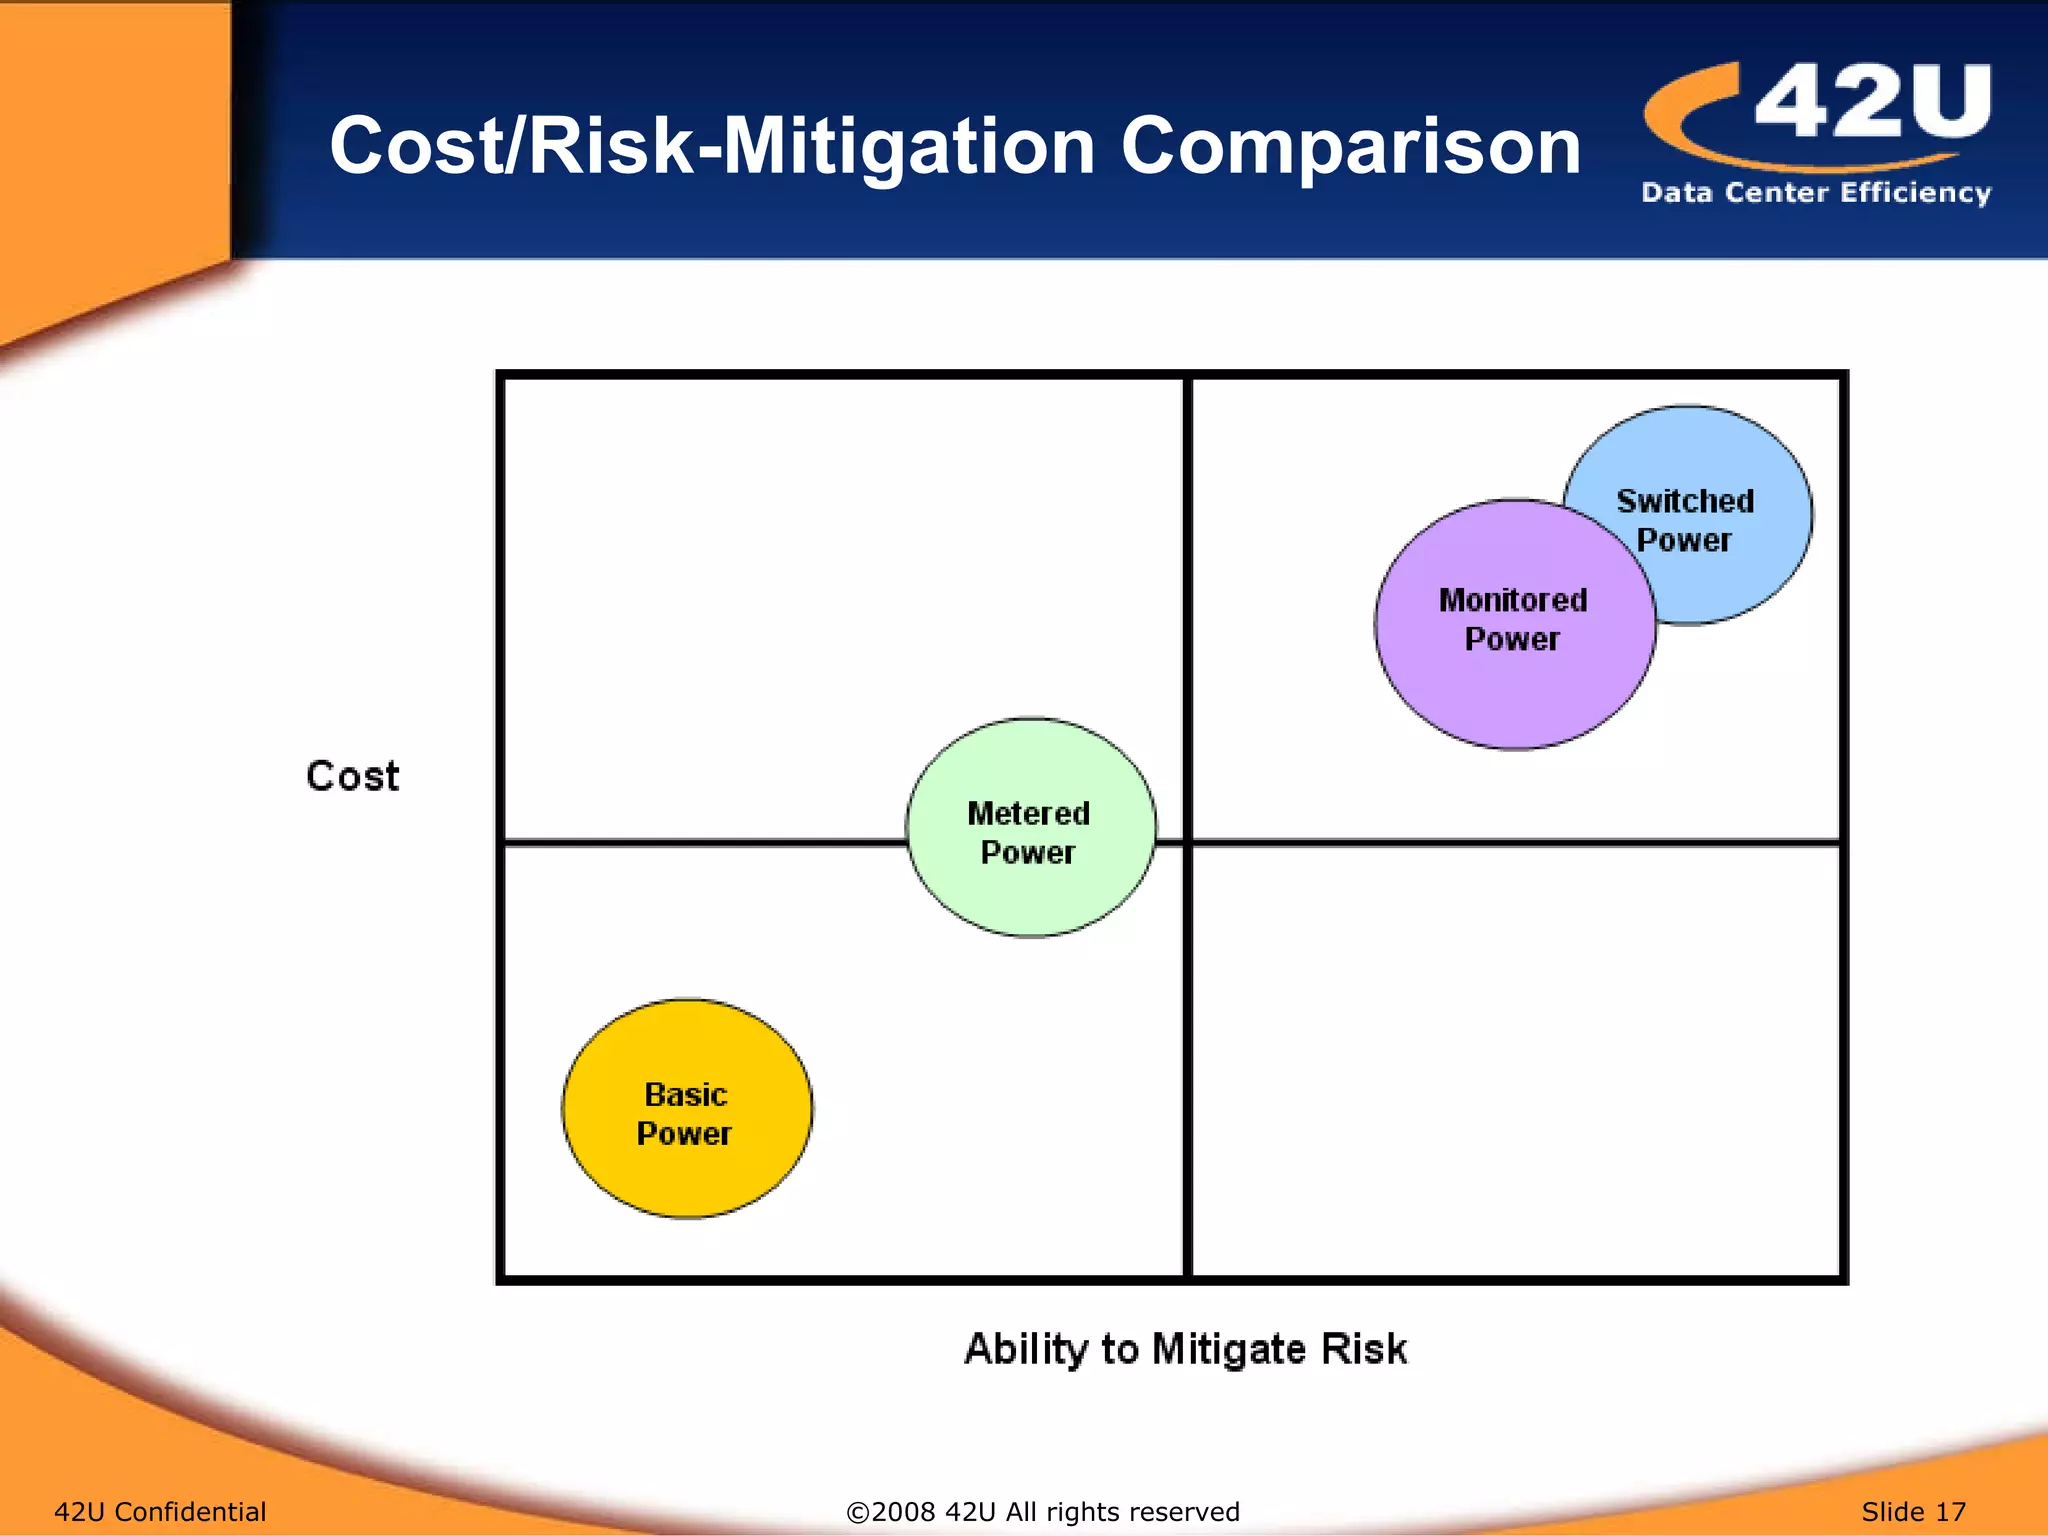
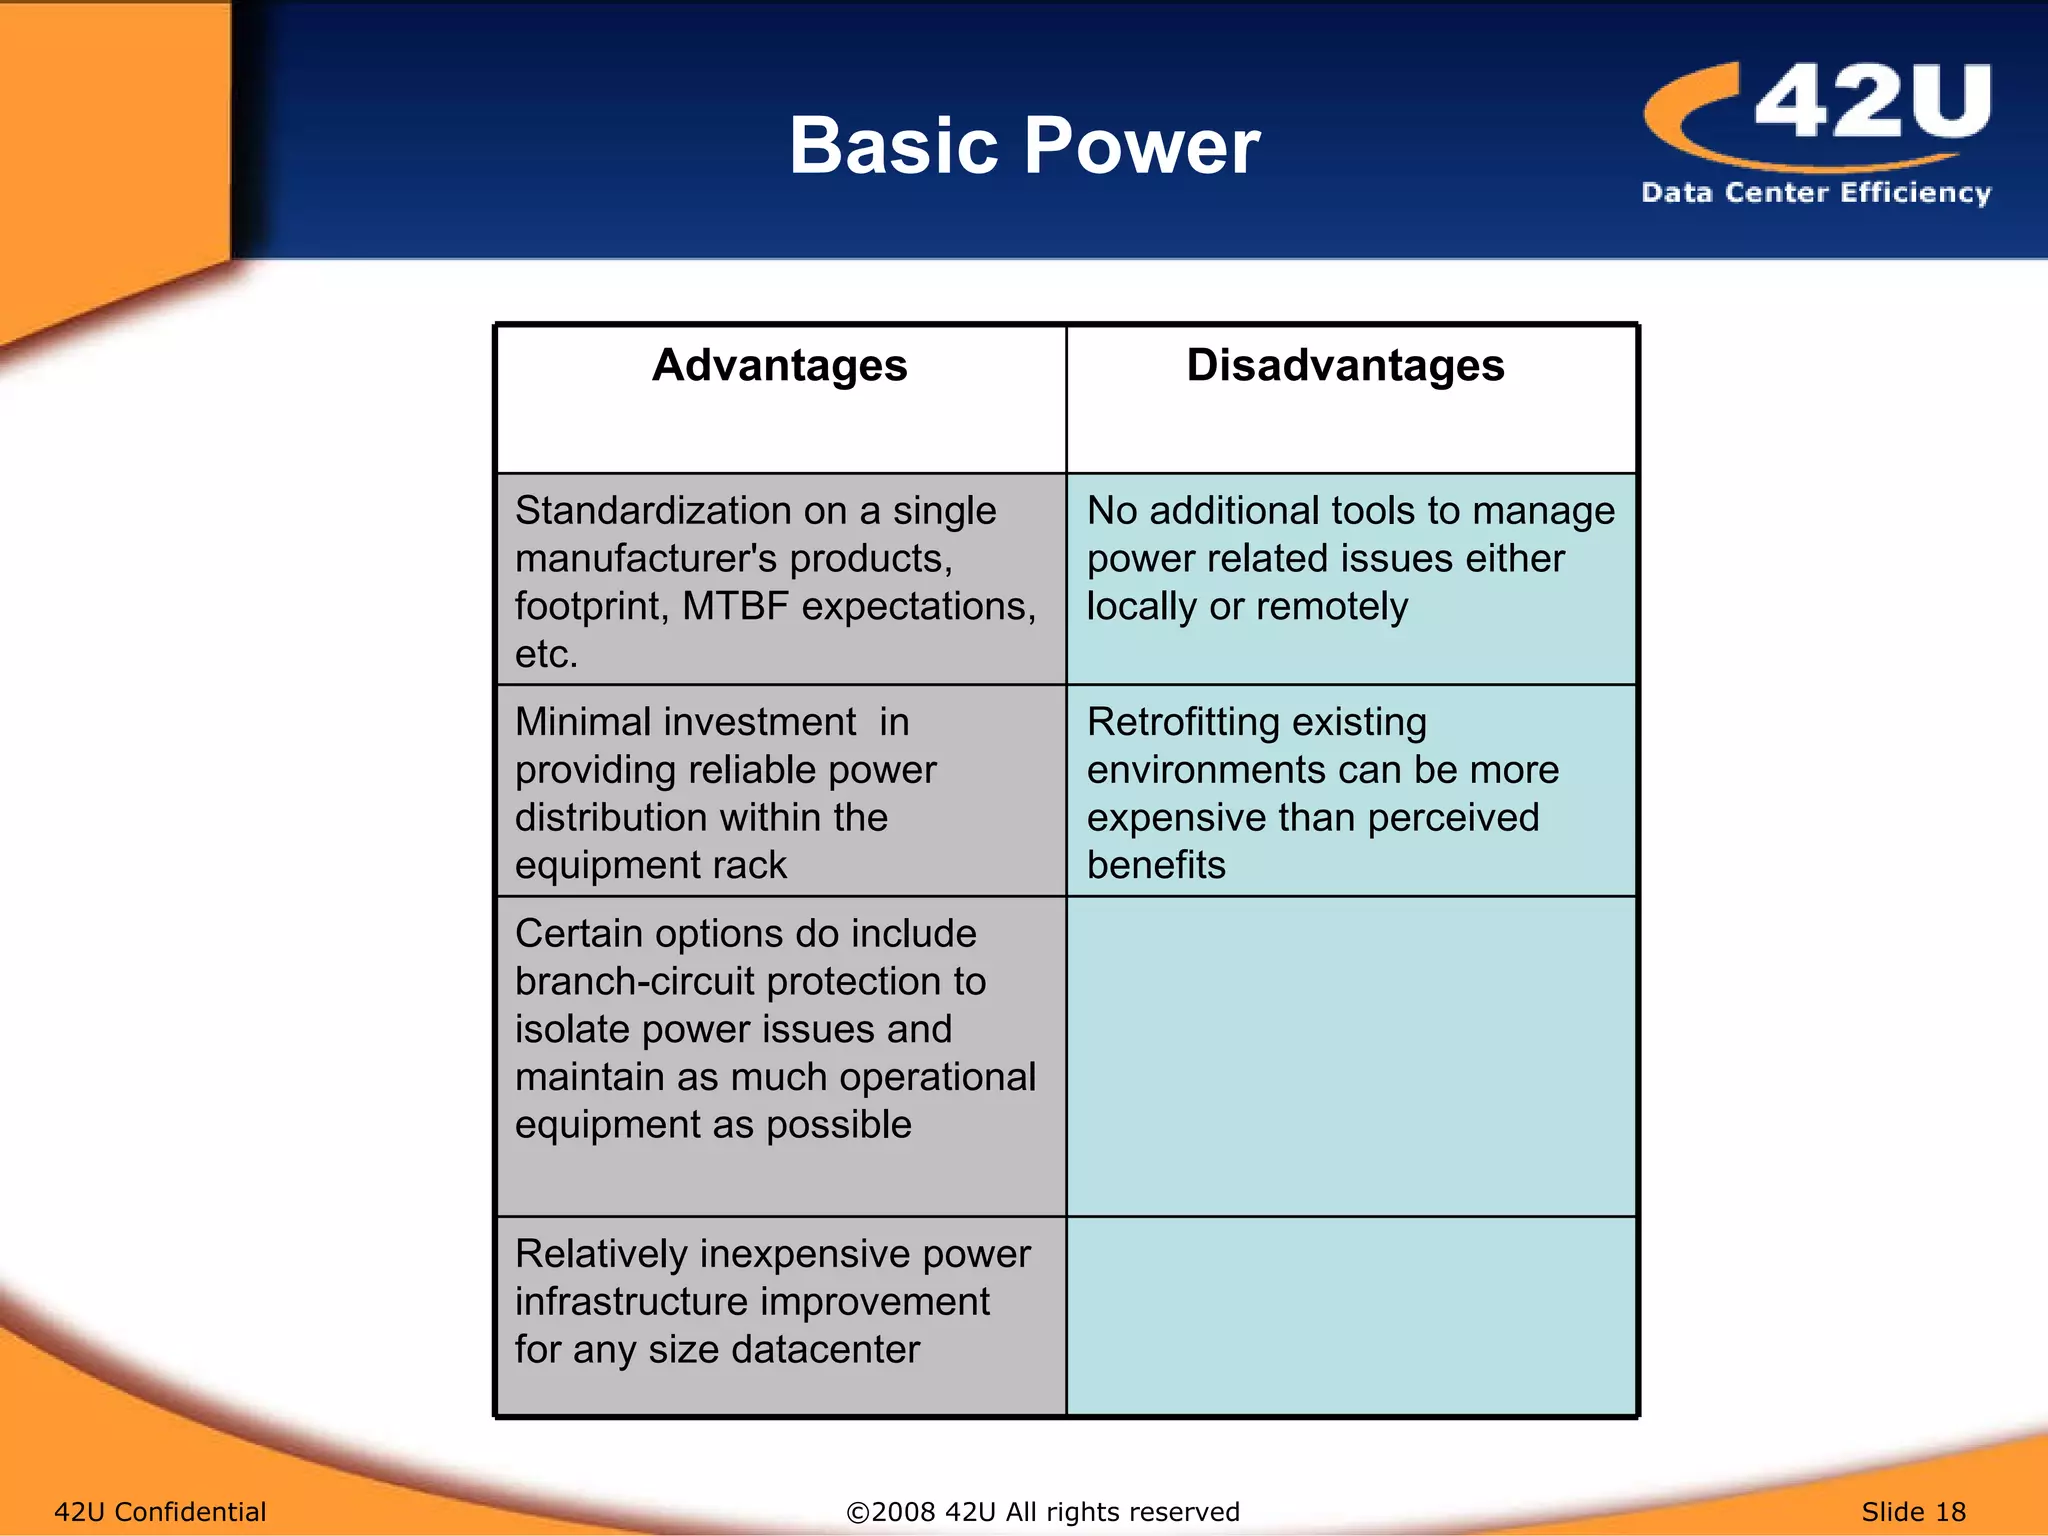
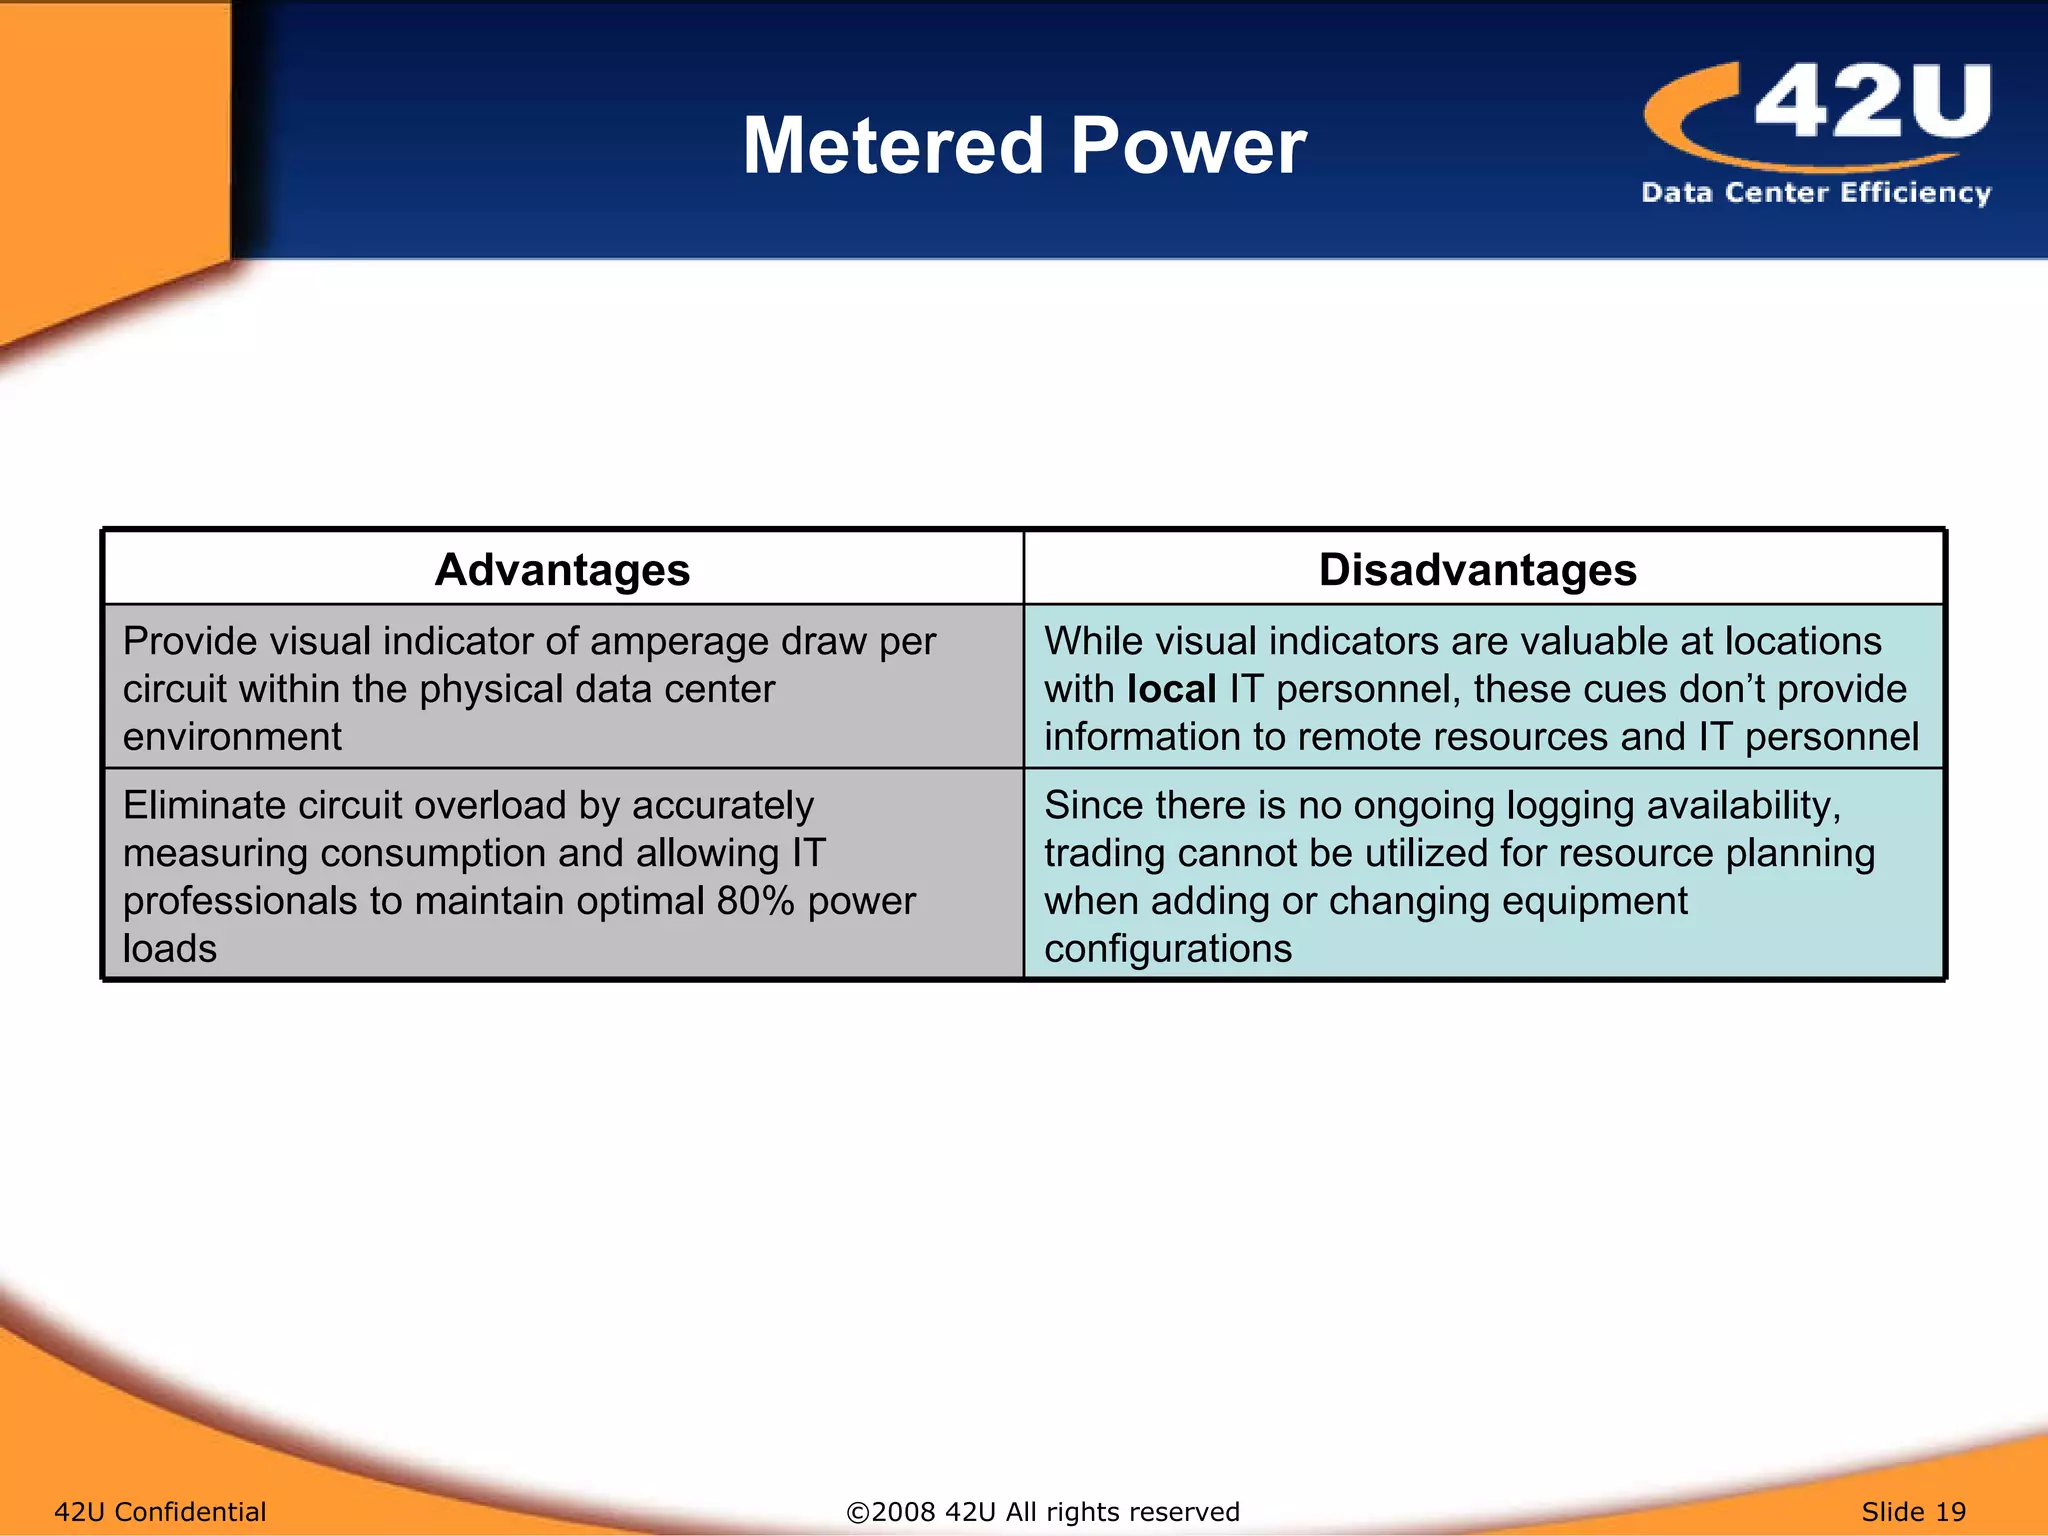
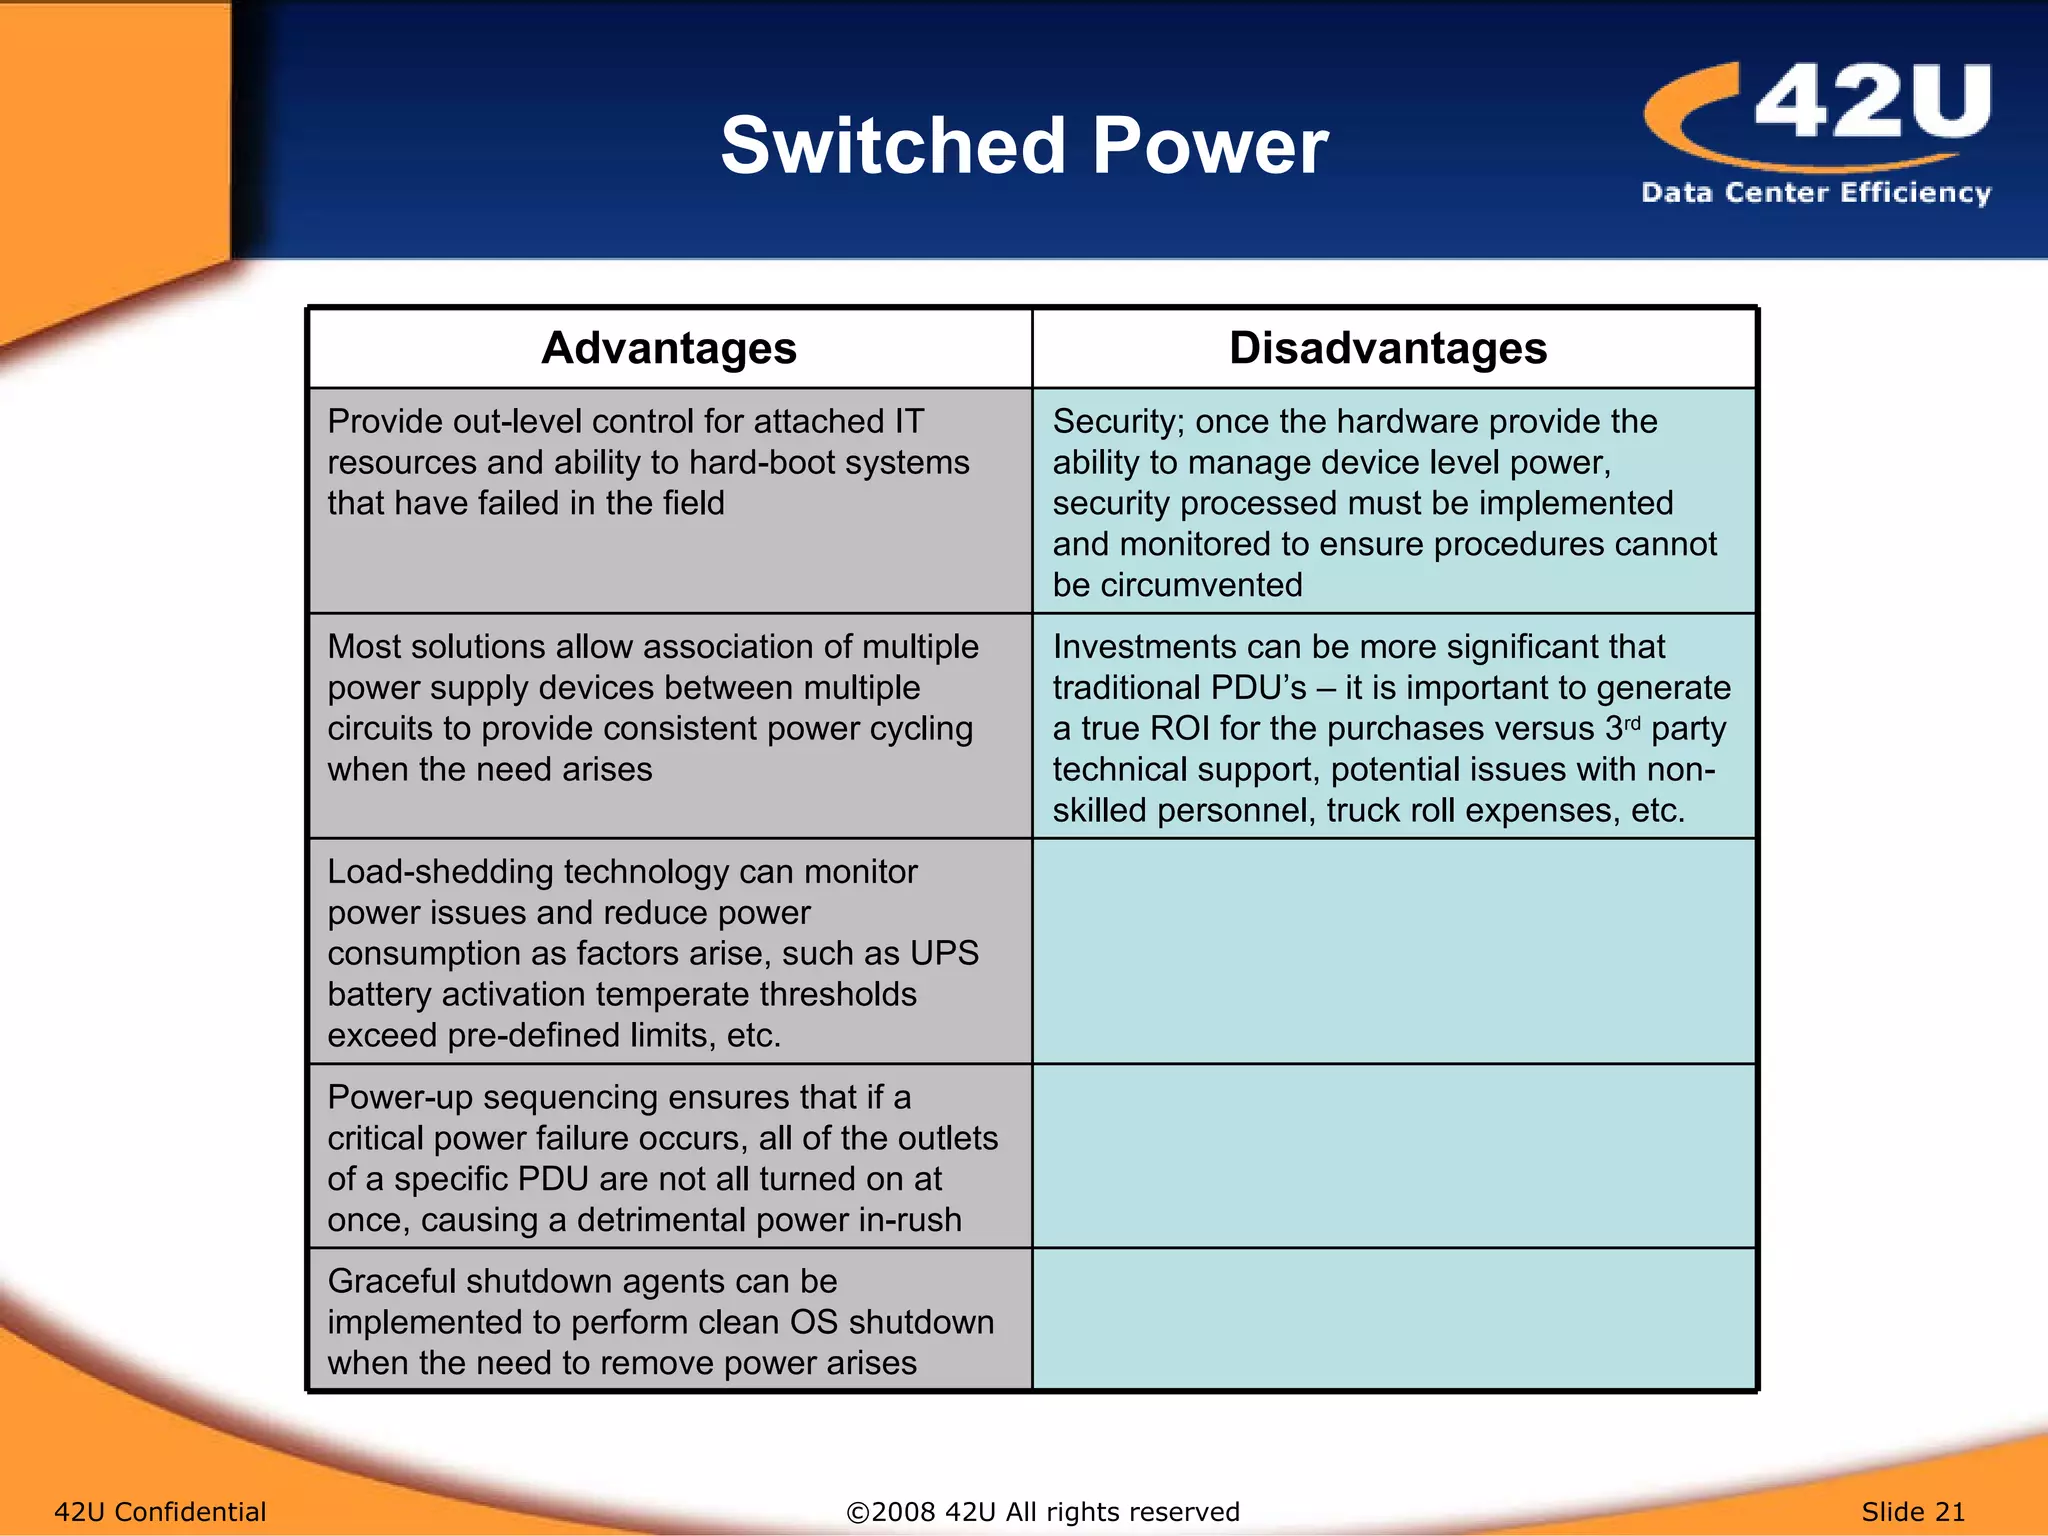
The document outlines strategies for enhancing power efficiency in data centers, emphasizing the importance of monitoring and managing energy consumption to identify cost reduction opportunities. It discusses various power management alternatives, including metered, monitored, and switched power solutions, highlighting their advantages and disadvantages. The content aims to guide organizations in optimizing energy use, thereby reducing operational costs and enhancing overall data center efficiency.


![Vibe Coding vs. Spec-Driven Development [Free Meetup]](https://cdn.slidesharecdn.com/ss_thumbnails/vibecodingvsspecdrivendevelopment-251209105622-43f455e7-thumbnail.jpg?width=640&height=640&fit=bounds)


