SlideShare a Scribd company logo
1 of 42
2-1
CHAPTER 2
Financial Statements
and the Annual Report
OVERVIEW OF EXERCISES, PROBLEMS, AND CASES
Estimated
Time in
Learning Objective Exercises Minutes Level
1. Describe the objectives of financial reporting.
2. Describe the qualitative characteristics of accounting information. 1 10 Easy
3. Explain the concept and purpose of a classified balance sheet 2 10 Easy
and prepare the statement. 9* 10 Mod
4. Use a classified balance sheet to analyze a company's
financial position.
5. Explain the difference between a single-step and a multiple-step 3 10 Easy
income statement and prepare each type of income statement. 4 10 Mod
9* 10 Mod
10* 5 Easy
11* 15 Mod
6. Use a multiple-step income statement to analyze a 5 10 Easy
company’s operations. 10* 5 Easy
11* 15 Mod
7. Identify the components of the statement of retained earnings
and prepare the statement. 6 10 Mod
9* 10 Mod
8. Identify the components of the statement of cash flows and 7 10 Easy
prepare the statement.
9. Read and use the financial statements and other elements in the 8 20 Diff
annual report of a publicly held company.
*Exercise, problem, or case covers two or more learning objectives
Level = Difficulty levels: Easy; Moderate (Mod); Difficult (Diff)
FINANCIAL ACCOUNTING SOLUTIONS MANUAL
2-2
Problems Estimated
and Time in
Learning Objective Alternates Minutes Level
1. Describe the objectives of financial reporting. 15* 45 Diff
2. Describe the qualitative characteristics of accounting information. 1 15 Diff
2 15 Mod
11* 35 Mod
12* 20 Mod
3. Explain the concept and purpose of a classified balance sheet 3 50 Mod
and prepare the statement. 13* 60 Mod
4. Use a classified balance sheet to analyze a company's 4 20 Easy
financial position. 5 15 Mod
11* 35 Mod
14* 35 Mod
15* 45 Diff
5. Explain the difference between a single-step and a multiple-step 6 30 Mod
income statement and prepare each type of income statement. 7 45 Mod
12* 20 Mod
13* 60 Mod
6. Use a multiple-step income statement to analyze a 8 35 Mod
company's operations. 14* 35 Mod
7. Identify the components of the statement of retained earnings and 11 30 Mod
prepare the statement. 13* 60 Mod
8. Identify the components of the statement of cash flows and 9 30 Mod
prepare the statement. 15* 45 Diff
9. Read and use the financial statements and other elements 10 30 Diff
in the annual report of a publicly held company.
*Exercise, problem, or case covers two or more learning objectives
Level= Difficulty levels: Easy’ Moderate (Mod); Difficult (Diff)
CHAPTER 2 FINANCIAL STATEMENTS AND THE ANNUAL REPORT 2-3
Estimated
Time in
Learning Objective Cases Minutes Level
1. Describe the objectives of financial reporting.
2. Describe the qualitative characteristics of accounting information. 6 30 Mod
3. Explain the concept and purpose of a classified balance sheet, 1 25 Easy
and prepare the statement. 3* 20 Mod
4. Use a classified balance sheet to analyze a company's 2 30 Mod
financial position. 3* 20 Mod
7* 30 Mod
5. Explain the difference between a single-step and a
multiple-step income statement, and prepare each type
of income statement.
6. Use a multiple-step income statement to analyze a 7* 30 Mod
company's operations
7. Identify the components of the statement of retained earnings
and prepare the statement
8. Identify the components of the statement of cash flows and 4 25 Mod
prepare the statement
9. Read and use the financial statements and other elements in the 5 30 Mod
annual report of a publicly held company
*Exercise, problem, or case covers two or more learning objectives
Level = Difficulty levels: Easy; Moderate (Mod); Difficult (Diff)
FINANCIAL ACCOUNTING SOLUTIONS MANUAL
2-4
Q U E S T I O N S
1. The primary concern to an investor is the future cash to be received from
the investment. However, this does not mean that the cash flows of the
company that has been invested in are not relevant. A relationship exists
between the cash flows to the investor and those to the company. For
example, a company that does not consistently generate sufficient cash
flows from its operations will not be able to pay cash dividends to the
investors over a sustained time.
2. The understandability characteristic does not imply that someone must
have an extensive accounting background to be able to use financial
statements. However, accounting information should be understandable to
those who are willing to learn to use it properly. In other words, the
information should make sense to someone who spends the time required
to have a basic understanding of accounting.
3. Relevance is the capacity of accounting information to make a difference in
a financial decision. For example, an income statement is relevant when
the use of it has at least the potential to make a difference in an investment
decision.
4. Comparability is the quality of accounting information that allows
comparisons to be made between or among companies. Without it,
financial statements would be very limited in their value. Financial
decisions require choices to be made about the investment of limited
resources. Investors need assurance that the financial statements of
companies that they are considering as investments are comparable.
5. Comparability is the quality of information that allows for comparisons to be
made between two or more companies, whereas consistency is the quality
that allows for comparisons to be made within a single entity from one
accounting period to the next.
6. The concept of materiality is closely related to the size of a company. For
example, assume that a company must decide whether a $500 expenditure
that will benefit future periods should be expensed immediately or
capitalized (i.e., recorded as an asset). The decision cannot be made
without considering the amount in relation to the size of the company. An
amount that is immaterial for a large multinational corporation may be
material for a smaller business.
CHAPTER 2 FINANCIAL STATEMENTS AND THE ANNUAL REPORT 2-5
7. The operating cycle for a retailer begins when a product is purchased from
either a manufacturer or a wholesaler. The next step in the cycle is the
sale of the product. The cycle is completed when cash is collected from
the customer. Because a service company does not have a tangible
product to sell, the first step is eliminated, and its operating cycle begins
when a service is provided to a customer.
8. A current asset is an asset that a company expects to realize in cash, sell,
or consume during its normal operating cycle. Therefore, accounts
receivable, inventory, and supplies all meet this definition and are classified
as current assets. By their nature, the benefits from each of these assets
will be realized during the normal operating cycle of the business.
9. The intent of a company is important in classifying an asset on the balance
sheet. For example, a piece of machinery could be classified as either
inventory (a current asset) or property, plant, and equipment (a long-term
asset) depending on whether the intent is to resell it or hold it for use in the
operations of the business. As another example, assume that a company
purchases 100 shares of General Motors stock. Whether the stock is
classified as current or long-term depends on whether the company plans
to sell the stock within the next year or the operating cycle, whichever is
longer.
10. The note payable will be classified on the balance sheet as long-term until
one year from its maturity date. At that time, it should be reclassified from
long-term to current because it will be paid within the next year. Any
liability that will mature within one year of the date of the balance sheet
should be classified as current, regardless of the original term of the loan
(five years in this case).
11. Both capital stock and retained earnings represent claims of the
stockholders on the assets of the business. They differ, however, in the
source of those claims. Capital stock represents the claims of the
stockholders that arise from their contributions of cash and other assets to
the business. Retained earnings represents the claims of the stockholders
arising from the undistributed earnings of the business since its inception.
12. Working capital is an absolute measure of liquidity. That is, it is the total
dollar amount of current assets minus current liabilities. One of the
problems with working capital as a measure of liquidity is that it does not
allow someone to compare the relative liquidity of two companies of
different sizes. Even within a single company, it may be difficult to
compare the relative liquidity of the company over time if the company has
grown. The current ratio (current assets divided by current liabilities)
overcomes these deficiencies by focusing attention on the relative size of
the current assets and current liabilities.
13. Capital structure refers to the right side of a balance sheet. All items on the
right side of the balance sheet represent claims against the assets of the
FINANCIAL ACCOUNTING SOLUTIONS MANUAL
2-6
business: liabilities are the claims of outsiders, and stockholders' equity is
the claim of the owners on the assets of the business. The capital
structures of all companies differ in that some companies rely more on
outsiders to provide assets, whereas others rely more on the owners to
provide the necessary assets to run the business.
14. The single-step income statement shows a subtotal for all expenses and
deducts this amount from total revenues. The weakness of the single-step
form for the income statement is that relationships between key items on
the statement are not highlighted. For example, the relationship between
sales revenue and the cost of the products sold is very important for a
product-oriented company. The difference between the two amounts is
called gross profit and would appear on a multiple-step statement but not
the single-step form.
15. An increase in the gross profit ratio indicates that the company has been
able to decrease the cost of the product it sells relative to the selling price.
For a retailer, this may be the result of dealing with a different supplier of
merchandise. On the other hand, a decrease in the profit margin ratio may
be an indication of an inability to control various operating expenses, such
as selling and administrative expenses.
16. A statement of retained earnings links the income statement and the
balance sheet in the following way. A statement of retained earnings
shows the beginning balance in the account, the addition to the account for
the net income of the period, and any deduction from the account for
dividends. The beginning balance in retained earnings is taken from the
balance sheet at the end of the prior period. The income statement
indicates the net income for the period. The ending balance in retained
earnings appears on the balance sheet at the end of the period.
17. An audit of a set of financial statements does not ensure that the
statements contain no errors. Because of the sheer number of
transactions entered into during a period of time, it would be impossible for
an auditor to check every single transaction to determine that it was
correctly recorded. Instead, through various types of tests, the auditor
renders an opinion as to whether the statements are free of material
misstatement.
18. The first note is the summary of significant accounting policies. As the
name implies, the purpose of this note is to summarize all of the company's
important accounting policies, such as those relating to the method of
depreciating assets and the method for valuing inventories.
CHAPTER 2 FINANCIAL STATEMENTS AND THE ANNUAL REPORT 2-7
E X E R C I S E S
LO 2 EXERCISE 2-1 CHARACTERISTICS OF USEFUL ACCOUNTING
INFORMATION
1. reliability 5. verifiability
2. relevance 6. understandability
3. representational faithfulness 7. neutrality
4. consistency 8. comparability
LO 3 EXERCISE 2-2 CLASSIFICATION OF ASSETS AND
LIABILITIES
1. CA 6. CL
2. CL 7. CA
3. CA 8. LTL
4. NCA 9. NCA
5. CL
LO 5 EXERCISE 2-3 SELLING EXPENSES AND GENERAL AND
ADMINISTRATIVE EXPENSES
1. Advertising expense—S
2. Depreciation expense—store furniture and fixtures—S
3. Office rent expense—G&A
4. Office salaries expense—G&A
5. Store rent expense—S
6. Store salaries expense—S
7. Insurance expense—G&A*
8. Supplies expense—G&A*
9. Utilities expense—G&A*
*Each of these could be classified as a selling expense if the cost is related in
some way to the sales function; e.g., insurance on cars driven by sales people
could be classified as a selling expense.
FINANCIAL ACCOUNTING SOLUTIONS MANUAL
2-8
LO 5 EXERCISE 2-4 MISSING INCOME STATEMENT AMOUNTS
Sara’s
Coffee Amy’s Jane’s
Shop Deli Bagels
Net sales $35,000 (3) $63,000 $78,000
Cost of goods sold (1) 28,000 45,000 (7) 39,000
Gross profit 7,000 18,000 (6) 39,000
Selling expenses 3,000 (4) 6,000 9,000
General and admini-
strative expenses 1,500 2,800 (5) 4,600
Total operating
expenses (2) 4,500 8,800 13,600
Net income $ 2,500 $ 9,200 $25,400
Solved as follows (in the order listed):
(1) 35,000 – 7,000 = 28,000
(2) 3,000 + 1,500 = 4,500
(3) 45,000 + 18,000 = 63,000
(4) 8,800 – 2,800 = 6,000
(5) 13,600 – 9,000 = 4,600
(6) 25,400 + 13,600 = 39,000
(7) 78,000 – 39,000 = 39,000
LO 6 EXERCISE 2-5 INCOME STATEMENT RATIOS
1. Gross profit ratio
(134,800 – 53,920)/134,800 = 60%
2. Profit margin
45,000/134,800 = 33.4%
Other information needed: ratios for prior years
ratios for other companies in same industry
CHAPTER 2 FINANCIAL STATEMENTS AND THE ANNUAL REPORT 2-9
LO 7 EXERCISE 2-6 STATEMENT OF RETAINED EARNINGS
LANDON CORPORATION
STATEMENT OF RETAINED EARNINGS
FOR THE YEAR ENDED DECEMBER 31, 2004
Retained earnings, January 1, 2004 $ 130,520*
Add: Net income 145,480
$ 276,000
Less: Dividends declared and paid 40,000
Retained earnings, December 31, 2004 $ 236,000
*Retained earnings, January 2, 2002 $ 0
Add: Net income:
2002: $ 85,200
2003: 125,320 210,520
Deduct: Dividends:
2002: $ 40,000
2003: 40,000 80,000
Retained earnings, December 31, 2003 $ 130,520
LO 8 EXERCISE 2-7 COMPONENTS OF THE STATEMENT OF
CASH FLOWS
1. Paid for supplies—0
2. Collected cash from customers—0
3. Purchased land (held for resale)—0
4. Purchased land (for construction of new building)—I
5. Paid dividend—F
6. Issued stock—F
7. Purchased computers—I
8. Sold old equipment—I
LO 9 EXERCISE 2-8 BASIC ELEMENTS OF FINANCIAL
STATEMENTS
1. Management’s report—This report is prepared by management as a way to
ensure that users realize that management is responsible for the information
in the financial statements. The internal control system is usually described
briefly, and the independent auditors are identified. The management’s
report is not subject to any outside review or support. Users must rely on the
integrity of management that the information contained in the report is
reliable.
2. Products/markets of company—Management provides information in the
annual report about the company's products and markets. The detail
FINANCIAL ACCOUNTING SOLUTIONS MANUAL
2-10
provided by management differs widely among companies, but most
companies describe their various products and often show pictures of them.
The distribution system for the products, i.e., whom the company sells to, is
also described. Because the company's products and markets are a matter
of public knowledge, they are subject to verification.
3. Financial statements—These are the responsibility of management and are
normally prepared by the controller. They include the income statement,
balance sheet, statement of changes in stockholders' equity, and statement
of cash flows. The information provided in the financial statements is subject
to verification as part of the external audit.
4. Notes to financial statements—These are also the responsibility of
management, and they include detailed explanations about the various items
appearing in the financial statements. The first note in most annual reports
is a summary of the significant accounting policies, such as the company's
inventory valuation methods and depreciation methods. The information
included in the notes is subject to review by the independent auditors and is
therefore highly verifiable.
5. Independent accountants' report—As the name implies, this report is
prepared by the independent auditors. It includes information about the
scope of the audit (the statements included in the audit), the auditing
standards followed in conducting the audit, and an opinion as to the fairness
of presentation of the financial statements. Because the public relies on the
auditors to render an impartial opinion, the auditing profession is subject to a
set of high ethical standards in performing audits.
MULTI-CONCEPT EXERCISES
LO 3,5,7 EXERCISE 2-9 FINANCIAL STATEMENT
CLASSIFICATION
BS = Balance sheet; IS = Income statement; RE = Retained earnings statement
1. Accounts payable—BS 12. Land held for future
2. Accounts receivable—BS expansion—BS
3. Advertising expense—IS 13. Loss on the sale of
4. Bad debts expense—IS equipment—IS
5. Bonds payable—BS 14. Office supplies—BS
6. Buildings—BS 15. Organizational costs—IS
7. Cash—BS 16. Patent amortization expense—IS
8. Common stock—BS 17. Retained earnings—BS, RE
9. Deferred income taxes—BS 18. Sales—IS
10. Depreciation expense—IS 19. Unearned revenue—BS
11. Dividends—RE 20. Utilities expense—IS
CHAPTER 2 FINANCIAL STATEMENTS AND THE ANNUAL REPORT 2-11
LO 5,6 EXERCISE 2-10 SINGLE- AND MULTIPLE-STEP INCOME
STATEMENT
1. Sales—B
2. Cost of goods sold—B
3. Selling expenses—M*
4. Total revenues—S
5. Utilities expense—B
6. Administrative expense—M*
7. Net loss—B
8. Supplies on hand—N
9. Accumulated depreciation—N
10. Gross profit—M
*This assumes that selling and administrative expenses are each headings for a
group of expenses. If this is the case, they would appear only on a multiple-
step income statement.
LO 5,6 EXERCISE 2-11 MULTIPLE-STEP INCOME STATEMENT
Gross profit ratio:
Gross profit/sales = $750,000*/$1,200,000 = 62.5%
*$1,200,000 – $450,000 = $750,000*
Profit margin:
Net income/Sales = $614,200*/$1,200,000 = 51.2%
*$750,000 – $60,800 – $75,000 = $614,200
Gaynor Corporation has been very profitable on the basis of its very high gross
profit ratio and profit margin. Before making an investment, however, you would
want to consider how these ratios compare with those of prior years and with
those of other companies in the same line of business.
FINANCIAL ACCOUNTING SOLUTIONS MANUAL
2-12
P R O B L E M S
LO 2 PROBLEM 2-1 MATERIALITY
1. Among the questions that might be answered by the analysis that was
performed are these: Is the usage of any of the items cyclical? Is there a
relationship between the usage of any two or more of the items? Is the
amount being spent on these items material? Would it be feasible to set up
an account at an office supply store for some of these items if they are used
in large quantities? From this analysis, the company might decide to change
the timing of its ordering to correspond to its need.
2. This question deals with the concept of materiality. It is likely this information
would be more relevant for a real estate company than for a hardware store.
Normally, a realtor would use more office supplies, relative to its use of other
types of supplies, and thus the amount spent on office supplies would be
more material to it than to a hardware store.
LO 2 PROBLEM 2-2 COSTS AND EXPENSES
1. Display fixtures—Only a portion of the cost would appear in the period of
acquisition; the fixtures should be depreciated over their useful lives.
2. Advertising—All.
3. Merchandise for sale—The cost for that portion of the inventory sold should
be recognized as an expense in the current period, and the remainder
included in inventory on the balance sheet.
4. Costs of incorporation—Because of the difficulty in determining the period
over which benefits will be received from the costs necessary to incorporate,
accounting standards require that these costs be expensed as incurred.
5. Cost of a franchise—This is a cost that should benefit several future
periods, and only a portion should be expensed in the current period; the
cost of the franchise should be treated as an intangible asset and amortized
over the periods during which benefits are expected.
6. Office supplies—The portion of the supplies used should be recognized as
an expense in the current period; the unused portion should be reported as
a current asset.
7. Wages in a restaurant—All.
CHAPTER 2 FINANCIAL STATEMENTS AND THE ANNUAL REPORT 2-13
8. Computer software—Assuming that the software was purchased, an
intangible asset should be recognized and a portion of the cost recognized
as expense in each of the periods benefited.
9. Computer hardware—Only the portion of the cost associated with the
benefits provided during the current period would be recognized as
depreciation expense; the cost should be written off over the useful life of
the hardware.
LO 3 PROBLEM 2-3 CLASSIFIED BALANCE SHEET
1. Classified balance sheet:
RUTH CORPORATION
BALANCE SHEET
DECEMBER 31, 2004
Assets
Current assets:
Cash $ 13,230
Accounts receivable 23,450
Inventory 45,730
Prepaid rent 1,500
Office supplies 2,340
Total current assets $ 86,250
Long-term investments 85,000
Property, plant, and equipment:
Land $ 250,000
Automobiles $ 112,500
Less: Accumulated
depreciation 22,500 90,000
Buildings 200,000
Less: Accumulated
depreciation 40,000 160,000
Total property, plant, and
equipment 500,000
Intangible assets:
Patents 40,000
Total assets $ 711,250
FINANCIAL ACCOUNTING SOLUTIONS MANUAL
2-14
Liabilities
Current liabilities:
Accounts payable $ 18,255
Income taxes payable 6,200
Interest payable 1,500
Notes payable, due June 30, 2005 10,000
Salaries and wages payable 4,200
Total current liabilities $ 40,155
Long-term debt:
Bonds payable, due December 31,
2008 160,000
Total liabilities $ 200,155
Stockholders' Equity
Contributed capital:
Capital stock, $10 par value,
15,000 shares issued and
outstanding $ 150,000
Paid-in capital in excess of par
value 50,000
Total contributed capital 200,000
Retained earnings 311,095
Total stockholders' equity 511,095
Total liabilities and stockholders'
equity $ 711,250
2. Current ratio = Current assets/Current liabilities
$86,250/$40,155 = 2.15 to 1
3. From the current ratio alone, Ruth appears to be relatively liquid. To fully
assess its liquidity, however, it would be useful to look more specifically at
the composition of the current assets and liabilities. In addition, how long on
the average does it take Ruth to sell inventory? How long does it take to
collect an account receivable? Also, you would want to compare Ruth's
current ratio at the end of this period with those of prior periods, and with the
current ratio for companies in the same industry.
LO 4 PROBLEM 2-4 FINANCIAL STATEMENT RATIOS
1. a. Working capital at 12/31/04:
Current assets: $13,230 + $10,200 + $450 + $24,600 + $6,250 +
$3,600 = $58,330
Current liabilities: $8,400 + $1,450 + $1,200 = $11,050
Working capital = $58,330 – $11,050 = $47,280
CHAPTER 2 FINANCIAL STATEMENTS AND THE ANNUAL REPORT 2-15
Working capital at 12/31/03:
Current assets: $19,570 + $9,450 + $700 + $26,200 + $5,020 +
$4,800 = $65,740
Current liabilities: $5,200 + $1,200 + $12,000 + $1,230 + $1,600
= $21,230
Working capital = $65,740 – $21,230 = $44,510
b. Current ratio at 12/31/04:
$58,330/$11,050 = 5.28 to 1
Current ratio at 12/31/03:
$65,740/$21,230 = 3.10 to 1
2. Both the absolute liquidity position of the company and the relative liquidity
position of the company have improved during 2004. First, the absolute
position, as indicated by the amount of working capital, has improved from
$44,510 to $47,280. The liquidity of the company has also improved on a
relative basis, as indicated by the increase in the current ratio from 3.10 to
5.28. The primary reason for the improvement in the company's liquidity is
the repayment during the year of the $12,000 note payable, along with the
$1,200 of interest payable on the note. This is counterbalanced somewhat,
though, by the decrease in accounts receivable from $19,570 to $13,230.
LO 4 PROBLEM 2-5 WORKING CAPITAL AND CURRENT RATIO
1. Current ratio = Current assets/Current liabilities
($23,000 + $13,000 + $45,000 + $800)/($54,900 + $1,200)
= $81,800/$56,100 = 1.46 to 1
Working capital = Current assets – Current liabilities
= $81,800 – $56,100 = $25,700
2. One concern is the relatively large percentage of the current assets tied up in
inventory. This asset accounts for $45,000/$81,800, or 55% of the total
current assets. What is the normal period of time it takes to sell inventory?
Is any part of the inventory slow-moving or obsolete?
3. On the basis of current ratio alone, Stevenson appears to be relatively liquid,
although it would be important to compare the ratio with those of prior years
and with those of other companies in the same industry.
FINANCIAL ACCOUNTING SOLUTIONS MANUAL
2-16
LO 5 PROBLEM 2-6 SINGLE-STEP INCOME STATEMENT
1. Single-step income statement:
SHAW CORPORATION
INCOME STATEMENT
FOR THE YEAR ENDED DECEMBER 31, 2004
Revenues:
Sales $48,300
Interest 1,340
Rent 6,700
Total revenues $ 56,340
Expenses:
Cost of goods sold $29,200
Advertising 1,500
Commissions 2,415
Depreciation—office building 2,900
Interest 1,400
Insurance—salesperson’s auto 2,250
Salaries and wages—office 12,560
Supplies—office 890
Income taxes 1,540
Total expenses 54,655
Net income $ 1,685
2. A single-step income statement does not lend itself as readily to analysis
as does a multiple-step statement. For example, with a single-step
statement, gross profit must first be computed before the gross profit
ratio can be determined. In addition, the lack of any grouping of the
various expenses makes any type of analysis more difficult.
CHAPTER 2 FINANCIAL STATEMENTS AND THE ANNUAL REPORT 2-17
LO 5 PROBLEM 2-7 MULTIPLE-STEP INCOME STATEMENT
1. Multiple-step income statement:
SHAW CORPORATION
INCOME STATEMENT
FOR THE YEAR ENDED DECEMBER 31, 2004
Sales $48,300
Cost of goods sold 29,200
Gross profit $ 19,100
Operating expenses:
Selling expenses:
Advertising $ 1,500
Commissions 2,415
Insurance—salesperson’s auto 2,250
Total selling expense $ 6,165
General and administrative
expenses:
Depreciation—office building $ 2,900
Salaries and wages—office 12,560
Supplies—office 890
Total general and administrative
expense 16,350
Total operating expense 22,515
Income from operations $ (3,415)
Other revenues and expenses:
Interest expense $ 1,400
Interest revenue 1,340
Rent revenue 6,700
Excess of other revenues over
other expenses 6,640
Income before taxes $ 3,225
Income tax expense 1,540
Net income $ 1,685
2. Gross profit ratio = Gross profit/Sales revenue
= $19,100/$48,300 = 39.5%
3. The gross profit ratio tells the reader of the income statement that for every
$1 of sales, Shaw recovers $.395, or 39.5 cents, after deducting product cost
(60.5 cents of every dollar). The ratio of gross profit to cost of sales, or
markup on cost, is 39.5/60.5, or 65.3%.
FINANCIAL ACCOUNTING SOLUTIONS MANUAL
2-18
LO 6 PROBLEM 2-8 ALBERTSONS’ GROSS PROFIT RATIO
1. A retailer, such as Albertsons, generally faces a slowdown in business in the
post-holiday month of January. This slowdown would allow it to focus more
on its fiscal year-end procedures, and include any returns or adjustments
relating to holiday sales.
2. (In thousands)
(Sales – Cost of goods sold)/Sales = Gross profit/Sales
2002: ($35,626 – $25,242)/$35,626 = 29.1%
2001: ($36,605 – $26,179)/$36,605 = 28.5%
2000: ($35,501 – $25,409)/$35,501 = 28.4%
3. The gross profit ratio increased slightly from 2000 to 2001, and then by
another small percentage in 2002. Possible explanations for the increases
could include higher selling prices, lower costs of merchandise purchased, or
a change in the mix of products sold towards higher gross profit items.
LO 8 PROBLEM 2-9 STATEMENT OF CASH FLOWS
1. COLORADO CORPORATION
STATEMENT OF CASH FLOWS
FOR THE YEAR ENDED DECEMBER 31, 2004
Cash flows from operating activities:
Cash collected from customers $ 93,970
Cash paid for inventory (65,600)
Cash paid in salaries and wages (20,400)
Cash paid in taxes ( 3,100)
Net cash provided by operating activities $ 4,870
Cash flows from investing activities:
Payment on office building (210,000)
Cash flows from financing activities:
Proceeds from issuance of stock $ 250,000
Proceeds from long-term note 60,000
Dividends declared and paid (5,600)
Net cash provided by financing activities 304,400
Net increase in cash $ 99,270
Cash at beginning of year 0
Cash at end of year $ 99,270
Note: Colorado should report one significant noncash activity as
supplementary information to its statement of cash flows: the three-year,
$90,000 note signed to finance the purchase of the office building.
CHAPTER 2 FINANCIAL STATEMENTS AND THE ANNUAL REPORT 2-19
2. First, the statement of cash flows reports on operations on a cash basis, as
opposed to the income statement which is prepared on an accrual basis.
Second, investing and financing activities are also reported on a statement of
cash flows. For example, information about dividends paid during the year
are shown on a statement of cash flows but not on an income statement. It
is interesting to note that Colorado paid more in dividends, $5,600, than the
amount of cash it generated from operations, $4,870.
LO 9 PROBLEM 2-10 BASIC ELEMENTS OF FINANCIAL REPORTS
Letter from the President to Stockholders of Grammar Inc.:
On the surface, 2004 does not appear to have been a successful year for
Grammar Inc. One specific event, however, caused the net loss we experienced
for the year. The sale of a subsidiary resulted in a loss of $400,000. The sale of
this unprofitable unit of the business should allow us to concentrate our attention
in the future on our successful businesses and clear the way for a return to
overall profitability in 2005.
I should point out to you that aside from the loss experienced on the sale of
the subsidiary, 2004 was a very good year. Our gross profit ratio increased to
50% from 40% in the prior year. Similarly, we were able to control our operating
expenses, as operating income as a percentage of sales increased from 20% to
38%. These are clear signals that Grammar is moving in the right direction and
should have a solid year of operations in 2005.
MULTI-CONCEPT PROBLEMS
LO 2,4 PROBLEM 2-11 COMPARING COCA-COLA AND
PEPSICO
1. Current assets – Current liabilities = Working capital
(In millions)
Coca-Cola: ($2,126 + $1,294 + $219 + $1,616 + $2,097) – ($3,692 + $994
+ $180 + $2,475) = $7,352 – $7,341 = $11
PepsiCo: ($2,531 + $1,638 + $1,342 + $695 + $207) – ($4,998 + $492 +
$562) = $6,413 – $6,052 = $361
Current Assets
Current liabilities
= Current ratio
Coca-Cola: $7,352/$7,341 = 1.00:1
PepsiCo: $6,413/$6,052 = 1.06:1
FINANCIAL ACCOUNTING SOLUTIONS MANUAL
2-20
2. Based on the analysis in Part 1., PepsiCo appears slightly more liquid than
Coca-Cola, with a higher working capital and a higher current ratio.
3. The composition of a company’s current assets adds another level to the
analysis of liquidity. Coca-Cola’s cash, the most liquid of assets, comprises
29% of current assets. PepsiCo’s cash is 26% of current assets. On the
other hand, PepsiCo’s accounts and notes receivable, also highly liquid, are
39% of current assets, contrasting with Coca-Cola’s accounts receivable of
29%. Although receivables are considered very liquid, questions may arise
about collectibility.
LO 2,5 PROBLEM 2-12 COMPARABILITY AND CONSISTENCY IN
INCOME STATEMENTS
1. The income statement for 2003 is in single-step format, and the 2004
statement uses the multiple-step format.
2. GLEESON COMPANY
INCOME STATEMENT
FOR THE YEAR ENDED DECEMBER 31, 2003
Sales $1,500,000
Cost of sales 450,000
Gross profit $1,050,000
Selling expenses $593,000*
Administrative expenses 94,000**
Total selling and administrative expenses $687,000
Net income $363,000
*$398,000 + $175,000 + $20,000
**$54,000 + $40,000
LO 3,5,7 PROBLEM 2-13 CLASSIFIED BALANCE SHEET AND
COMBINED MULTIPLE-STEP STATEMENT OF INCOME
AND RETAINED EARNINGS FOR KELLOGG’S
1. Kellogg’s Company
Income Statement
For the Year Ended December 31, 2002
(millions of dollars)
Net sales $8,304.1
Cost of goods sold $4,569.0
Selling, general and administrative expense 2,227.0
Operating profit $1,508.1
Interest expense 391.2
Other income, net 27.4
Income before taxes 1,144.3
Income taxes 423.4
Net income $ 720.9
CHAPTER 2 FINANCIAL STATEMENTS AND THE ANNUAL REPORT 2-21
2. Kellogg’s Company
Statement of Retained Earnings
For the Year Ended December 31, 2002
(millions of dollars)
Retained earnings, beginning of year $1,564.7
Net income for the year 720.9
Dividends paid (412.6)
Retained earnings, end of year $1,873.0
3. Kellogg’s Company
Balance Sheet
December 31, 2002
(
m
i
l
l
i
o
n
s
o
f
d
o
l
l
a
r
s
)
Current assets:
Cash and cash equivalents $ 100.6
Accounts receivable, net 741.0
Inventories 603.2
Other current assets 318.6
Total current assets $ 1,763.4
Property, net $ 2,840.2
Other assets 5,615.7
Total assets $10,219.3
FINANCIAL ACCOUNTING SOLUTIONS MANUAL
2-22
Current liabilities:
Current maturities of long-term debt $ 776.4
Notes payable 420.9
Accounts payable 619.0
Other current liabilities 1,198.6
Total current liabilities $ 3,014.9
Long-term debt $ 4,519.4
Other liabilities $ 1,789.9
Shareholders’ equity:
Common stock $ 103.8
Capital in excess of par value 49.9
Retained earnings 1,873.0
Treasury stock, at cost (278.2)
Accumulated other comprehensive income (853.4)
Total shareholders’ equity $ 895.1
Total liabilities and shareholders’ equity $ 10,219.3
LO 4,6 PROBLEM 2-14 USING KELLOGG’S CLASSIFIED BALANCE
SHEET AND MULTIPLE-STEP INCOME STATEMENT
1. (All amounts in millions)
2002 Working capital: Current assets – current liabilities
$1,763.4 – $3,014.9 = ($1,251.5)
2002 Current ratio: Current assets/current liabilities
$1,763.4/$3,014.9 = .58 to 1
2. Kellogg’s does not appear to be very liquid, with a negative working capital
and a current ratio of less than 1. Other factors to consider when evaluating
liquidity would be the composition of current assets and the due dates of
current liabilities.
3. (All amounts in millions)
2002 Gross profit ratio: Gross profit/Net sales
$3,735.1/$8,304.1 = 45%
2002 Profit margin ratio: Net income/Net sales
$720.9/$8,304.1= 8.7%
CHAPTER 2 FINANCIAL STATEMENTS AND THE ANNUAL REPORT 2-23
4. As a stockholder, Kellogg’s gross profit ratio and profit margin ratio appear
acceptable. It would be necessary, however, to compare the 2002 ratios to
those same ratios for Kellogg’s in past years and to also compare the ratios
to other companies within the same industry.
LO 1,4,8 PROBLEM 2-15 CASH FLOW
Cash available to pay a dividend on December 31, 2004:
Cash balance, September 30, 2004 $ 5,000
+ Accounts receivable collections 39,406*
+ Note receivable due on November 1 10,000
+ Interest due on November 1: $10,000 X 5% 500
– Cash paid for purchases (15,762)**
– Mortgage note payments: 3 months X $1,200 (3,600)
– Operating expenses: 3 months X $3,000 (9,000)
Cash balance, December 31, 2004 $ 26,544
*September sales collected in October $ 12,500
October sales collected in November:
$12,500 X 1.05 13,125
November sales collected in December:
$13,125 X 1.05 13,781
Total accounts receivable collections $ 39,406
**September purchases paid for in October $ 5,000
October purchases paid for in November:
$13,125 X 40% 5,250
November purchases paid for in December:
$13,781 X 40% 5,512
Total payments on account $ 15,762
Note: Because inventory levels are maintained at $75,000, purchases are equal
to 40% of sales each month.
Conclusion: 50,000 shares of common stock X $.50 per share will require cash
of $25,000 to pay the quarterly dividend. With $26,544 of cash available,
Franklin will barely be able to meet the dividend payment. Unless one or more of
the following actions are successful in increasing the cash balance, management
should not recommend the normal quarterly dividend of $.50 per share:
• Reduce inventory levels.
• Speed up the collection of receivables.
• Lengthen the average amount of time taken to pay for purchases of
inventory.
• Reduce operating expenses.
A L T E R N A T E P R O B L E M S
FINANCIAL ACCOUNTING SOLUTIONS MANUAL
2-24
LO 2 PROBLEM 2-1A MATERIALITY
1. The pattern of long distance calls might point to alternative long-distance
plans with one of the many carriers now in this business. For example,
some companies might give a discount for calls made in off-peak hours. The
analysis might point to misuse by certain employees (overuse, personal use,
etc.), a situation that could be corrected by talking to the employees who are
misusing the long distance service.
2. This question deals with the concept of materiality. It would be difficult to
decide which of the two types of companies, a realtor or a hardware store,
would make more long distance calls. A realtor might make a large number
of long distance calls if it deals with out-of-state clients. The hardware store
might regularly order inventory from vendors outside of its area code.
LO 2 PROBLEM 2-2A COSTS AND EXPENSES
1. Point-of-sale systems in a retail store—The cost associated with these
systems is a tangible asset that should be reported in the long-term assets
section of the balance sheet and depreciated over the life of the systems;
only a portion would be recognized as expense during the current period.
2. Ad in the yellow pages—All of the cost for the ad would normally be
expensed in the period the cost is incurred unless there was evidence that
the ad would provide benefits for a number of future periods.
3. An inventory control computer software system—Assuming that the
software was purchased, an intangible asset should be recognized and a
portion of the cost recognized as expense in each of the periods benefited.
4. Shipping merchandise for resale to chain outlets—All of the costs
associated with shipping merchandise for resale would normally be
recognized as expense when the costs are incurred. Even though one could
argue that under the matching principle these costs should be recognized as
expense only when the inventory is sold, the practical difficulty in associating
shipping costs with specific items sold results in most companies expensing
these costs as incurred.
LO 3 PROBLEM 2-3A CLASSIFIED BALANCE SHEET
1. Classified balance sheet:
SINGER CORPORATION
BALANCE SHEET
DECEMBER 31, 2004
CHAPTER 2 FINANCIAL STATEMENTS AND THE ANNUAL REPORT 2-25
Assets
Current assets:
Cash $ 60,790
Marketable securities 15,000
Accounts receivable 26,700
Merchandise inventory 112,900
Prepaid rent 3,600
Office supplies 400
Total current assets $ 219,390
Property, plant, and equipment:
Land $ 250,000
Buildings $ 150,000
Less: accumulated
depreciation 40,000 110,000
Equipment 84,500
Less: accumulated
depreciation 12,500 72,000
Total property, plant, and equipment 432,000
Intangible assets
Patents 45,000
Total assets $ 696,390
Liabilities
Current liabilities:
Accounts payable $ 34,280
Income taxes payable 7,500
Interest payable 2,200
Notes payable, due April 15, 2005 6,500
Salaries payable 7,400
Total current liabilities $ 57,880
Long-term debt:
Bonds payable, due December 31,
2010 250,000
Total liabilities $ 307,880
Stockholders' Equity
Contributed capital:
Capital stock, $1 par value, 200,000
shares issued and outstanding $ 200,000
Paid-in capital in excess of par
value 75,000
Total contributed capital $ 275,000
Retained earnings 113,510
Total stockholders' equity 388,510
Total liabilities and stockholders' equity $696,390
FINANCIAL ACCOUNTING SOLUTIONS MANUAL
2-26
2. Current ratio = Current assets/Current liabilities
$219,390/$57,880 = 3.79 to 1
3. From the current ratio alone, Singer appears to be relatively liquid. In fact,
Singer may be too liquid, in that its cash balance is greater than its total
current liabilities. Singer may be missing significant investment
opportunities by maintaining such a large cash balance. To fully assess its
liquidity, it would be useful to look more specifically at the activity in
inventory and accounts receivable. For example, how long on the average
does it take Singer to sell inventory? How long does it take to collect an
account receivable? Also, you would want to compare Singer's current ratio
at the end of this period with prior periods, and with the current ratio for
companies in the same industry.
LO 4 PROBLEM 2-4A FINANCIAL STATEMENT RATIOS
1. a. Working capital at 12/31/04:
Current assets: $16,500 + $12,750 + $200 + $900 + $400 = $30,750
Current liabilities: $10,500 + $1,800 + $10,000 = $22,300
Working capital = $30,750 – $22,300 = $8,450
Working capital at 12/31/03:
Current assets: $26,000 + $11,800 + $1,100 + $250 = $39,150
Current liabilities: $6,500 + $800 + $5,800 = $13,100
Working capital = $39,150 – $13,100 = $26,050
b. Current ratio at 12/31/04:
$30,750/$22,300 = 1.38 to 1
Current ratio at 12/31/03:
$39,150/$13,100 = 2.99 to 1
CHAPTER 2 FINANCIAL STATEMENTS AND THE ANNUAL REPORT 2-27
2. Both the absolute liquidity position of the company and the relative liquidity
position of the company have declined during 2004. First, the absolute
position, as indicated by the amount of working capital, has decreased from
$26,050 to $8,450. The liquidity of the company has also decreased on a
relative basis, as is indicated by the decrease in the current ratio from 2.99
to 1.38. The primary reasons for the decline in the company's liquidity are
the significant increases in accounts payable and taxes payable, and the
decrease in accounts receivable.
LO 4 PROBLEM 2-5A WORKING CAPITAL AND CURRENT RATIO
1. Current ratio = Current assets/Current liabilities
($23,000 + $43,000 + $75,000 + $2,800)/($84,900 + $3,200)
= $143,800/$88,100 = 1.63 to 1
Working capital = Current assets – Current liabilities
= $143,800 – $88,100 = $55,700
2. Even though Kapinski has a current ratio that is over 1 to 1, it may
experience trouble paying its bills, specifically its accounts payable. This
depends on two factors: (1) how long it normally takes to collect accounts
receivable and (2) the normal length of time to sell inventory. In addition, the
company must be concerned whether any portion of the accounts receivable
may prove to be uncollectible and whether any portion of the inventory is not
saleable.
3. Three things Kapinski might be able to do to help it pay its bills on time:
a. Decrease the average collection period for accounts receivable.
b. Negotiate with suppliers to increase the time Kapinski is given to pay for
its accounts payable.
c. Reduce its inventory levels.
LO 5 PROBLEM 2-6A SINGLE-STEP INCOME STATEMENT
1. Single-step income statement:
CORBIN ENTERPRISES
INCOME STATEMENT
FOR THE YEAR ENDED DECEMBER 31, 2004
Revenues:
Sales revenue $ 350,000
Dividend revenue 2,700
Total revenues $ 352,700
FINANCIAL ACCOUNTING SOLUTIONS MANUAL
2-28
Expenses:
Cost of goods sold $ 150,000
Wages—office 45,600
Rent—office 26,400
Rent—salesperson's car 18,000
Advertising 9,000
Utilities 6,750
Depreciation—computer 4,500
Interest 1,900
Supplies expense—office 1,300
Income tax 30,700
Total expenses 294,150
Net income $ 58,550
2. A single-step income statement does not lend itself as readily to analysis as
does a multiple-step statement. For example, with a single-step statement,
gross profit must first be computed before the gross profit ratio can be
determined. In addition, the lack of any type of grouping of the various
expenses makes any type of analysis more difficult.
LO 5 PROBLEM 2-7A MULTIPLE-STEP INCOME STATEMENT
1. Multiple-step income statement:
CORBIN ENTERPRISES
INCOME STATEMENT
FOR THE YEAR ENDED DECEMBER 31, 2004
Sales $ 350,000
Cost of goods sold 150,000
Gross profit $ 200,000
Operating expenses:
Selling expenses:
Advertising $ 9,000
Rent—salesperson’s car 18,000
Total selling expense $ 27,000
General and administrative
expenses:
Depreciation—computer $ 4,500
Rent—office 26,400
Supplies—office 1,300
Wages—office 45,600
CHAPTER 2 FINANCIAL STATEMENTS AND THE ANNUAL REPORT 2-29
Utilities 6,750
Total general and administrative
expense 84,550
Total operating expense 111,550
Income from operations $ 88,450
Other revenues and expenses:
Interest expense $ 1,900
Dividend revenue 2,700
Excess of other revenues over other
expenses 800
Income before taxes $ 89,250
Income tax expense 30,700
Net income $ 58,550
2. Gross profit ratio = Gross profit/Sales revenue
= $200,000/$350,000 = 57.1%
FINANCIAL ACCOUNTING SOLUTIONS MANUAL
2-30
3. The gross profit ratio tells the reader of the income statement that for every
$1 of sales Corbin spends 1 – .571, or 42.9 cents, for its products. The ratio
of gross profit to cost of sales, or markup on cost, is 57.1/42.9, or 133%.
LO 6 PROBLEM 2-8A SAKS’ GROSS PROFIT RATIO
1. A retailer, such as Saks, generates most of its revenue during the holiday
season. By waiting until the end of January, Saks can include returns and
adjustments pertaining to the holiday shopping season. It can also take
advantage of the slower January season to focus on its fiscal year-end
procedures.
2. (In thousands)
(Sales – Cost of goods sold)/Sales = Gross profit/Sales
2002: ($5,911,122 – $3,739,247)/$5,911,122 = 36.7%
2001: ($6,070,568 – $3,960,129)/$6,070,568 = 34.8%
2000: ($6,581,236 – $4,211,707)/$6,581,236 = 36.0%
3. Saks’ gross profit ratio decreased in 2001, but increased in 2002. Changes
in the gross profit ratio can be a result of changes in selling price, costs, or
the mix of products sold.
LO 8 PROBLEM 2-9A STATEMENT OF CASH FLOWS
1. WISCONSIN CORPORATION
STATEMENT OF CASH FLOWS
FOR THE YEAR ENDED DECEMBER 31, 2004
Cash flows from operating activities:
Cash collected from customers $ 310,000
Cash paid for inventory (185,000)
Cash paid in salaries and wages (30,100)
Cash paid in taxes (40,000)
Net cash provided by operating activities $ 54,900*
Cash flows from investing activities:
Purchase of manufacturing facility (150,000)
Cash flows from financing activities:
Proceeds from issuance of stock $ 400,000
Proceeds from long-term note 50,000
Dividends declared and paid (4,000)
Net cash provided by financing activities 446,000
Net increase in cash $ 350,900
Cash at beginning of year 0
Cash at end of year $ 350,900
CHAPTER 2 FINANCIAL STATEMENTS AND THE ANNUAL REPORT 2-31
Note: Wisconsin should report one significant noncash activity as
supplementary information to its statement of cash flows: the five-year,
$150,000 note signed to finance the purchase of the manufacturing facility.
2. First, the statement of cash flows reports on operations on a cash basis, as
opposed to the income statement which is prepared on an accrual basis.
Second, investing and financing activities are also reported on a statement of
cash flows. For example, information about dividends paid during the year
are shown on a statement of cash flows but not on an income statement.
LO 9 PROBLEM 2-10A BASIC ELEMENTS OF FINANCIAL REPORTS
Letter from the President to Stockholders of Thesaurus Inc.:
Thesaurus, Inc. has just completed another very successful year. The
decrease in net income from 2003 to 2004 was due to a single, nonrecurring gain
in 2003, a $400,000 gain on the sale of a subsidiary in that year. A comparison
of the operating income of the two years shows a distinct improvement, from
$100,000 in 2003 to $380,000 in 2004.
All signs point to a successful year just completed. Our gross profit ratio
increased to 50% from 40% in the prior year. Similarly, we were able to control
our operating expenses: operating income as a percentage of sales increased
from 20% to 38%. These are clear signals that Thesaurus is moving in the right
direction and should have a solid year of operations in 2005.
ALTERNATE MULTI-CONCEPT PROBLEMS
LO 2,4 PROBLEM 2-11A COMPARING GATEWAY AND DELL
1. Current assets – Current liabilities = Working capital
(In thousands for Gateway and millions for Dell)
Gateway: ($197,817 + $465,603 + $88,761 + $602,073 + $601,118) –
($278,609 + $364,741 + $56,684 + $240,315) = $1,955,372 – $940,349 =
$1,015,023
Dell: ($2,586 + $4,232 + $306 + $1,394 + $406) – ($5,989 + $2,944) =
$8,924 – $8,933 = $(9)
Gateway: $1,955,372/$940,349 = 2.08:1
Dell: $8,924/$8,933 = 1.00:1
FINANCIAL ACCOUNTING SOLUTIONS MANUAL
2-32
2. Based on both the amount of working capital and the current ratio,
Gateway appears to be more liquid than Dell. Dell’s working capital is
negative, meaning that it has more current liabilities than it does current
assets. The difference is minimal, however, resulting in a current ratio
that is 1.00 to 1 when rounded.
3. Gateway’s cash and cash equivalents make up 24% of its total current
assets and marketable securities comprise another 31% of the total.
Thus, these very liquid assets together make up 55% of Gateway’s
current assets. Those same categories, cash and short-term
investments, are 47% and 5% respectively of Dell’s current assets. For
Dell, these two most liquid assets make up 52% of current assets.
Therefore, even though Dell does not appear as liquid as Gateway, it
does have a slightly higher percentage of its current assets in cash and
marketable securities.
LO 2,5 PROBLEM 2-12A COMPARABILITY AND CONSISTENCY IN
INCOME STATEMENTS
1. The income statements for both years are in single-step form.
2. Income statement items as a percentage of sales:
2004 2003
Sales 100.0% 100.0%
Cost of sales 36.0 30.0
Sales salaries 25.1 26.5
Delivery expense 10.6 11.7
Office supplies 3.2 3.6
Depreciation—truck 2.4 2.7
Computer line expense 1.4 1.3
Total expenses 78.7 75.8
Net income 21.3% 24.2%
Restating each item on the income statement as a percentage of sales
allows the reader to better understand how successful a business was in
controlling costs. For example, Chisholm Company increased its sales by
$200,000 for the year, but this did not translate to an increase in the bottom
line, i.e., net income. The restatement of each of the expenses as a
percentage of sales reveals why net income did not increase. Total
expenses, as a percentage of sales, increased from 75.8% to 78.7%. Aside
from a slight increase in one of the minor expenses, computer lines, only one
expense increased as a percentage of sales. The one increase, however,
was the primary reason for the increase in expenses as a percentage of
sales: the cost of Chisholm’s products increased from 30% to 36% of sales.
CHAPTER 2 FINANCIAL STATEMENTS AND THE ANNUAL REPORT 2-33
LO 3,5,7 PROBLEM 2-13A CLASSIFIED BALANCE SHEET,
MULTIPLE-STEP INCOME STATEMENT, AND
STATEMENT OF RETAINED EARNINGS FOR
WALGREENS
1. Walgreen Co.
Income Statement
For the Year Ended August 31, 2002
(millions of dollars)
Net sales $28,681.1
Cost of sales $21,076.1
Selling, occupancy and administration 5,980.8
Operating profit $1,624.2
Interest income 6.9
Other income 6.2
Income before taxes $1,637.3
Income tax provision 618.1
Net income $1,019.2
2. Walgreen Co.
Statement of Retained Earnings
For the Year Ended August 31, 2002
(millions of dollars)
Retained earnings, beginning of year $4,530.9
Net income for the year 1,019.2
Dividends declared (148.4)
Retained earnings, end of year $5,401.7
FINANCIAL ACCOUNTING SOLUTIONS MANUAL
2-34
3. Walgreen Co.
Balance Sheet
August 31, 2002
(millions of dollars)
Current assets:
Cash and cash equivalents $449.9
Accounts receivable, net 954.8
Inventories 3,645.2
Other current assets 116.6
Total current assets $5,166.5
Property and equipment, at cost $4,591.4
Other non-current assets 120.9
Total assets $9,878.8
Current liabilities:
Trade accounts payable $1,836.4
Accrued expenses and other liabilities 1,017.9
Income taxes 100.9
Total current liabilities $2,955.2
Deferred income taxes $176.5
Other non-current liabilities 516.9
Total non-current liabilities $693.4
Shareholders’ equity:
Common stock $80.1
Paid-in capital 748.4
Retained earnings 5,401.7
Total shareholders’ equity 6,230.2
Total liabilities and shareholders’ equity $9,878.8
CHAPTER 2 FINANCIAL STATEMENTS AND THE ANNUAL REPORT 2-35
LO 4,6 PROBLEM 2-14A USING WALGREENS’ CLASSIFIED
BALANCE SHEET AND MULTIPLE-STEP INCOME
STATEMENT
1. (All amounts in millions)
2002 Working capital: Current assets – current liabilities
$5,166.5 – $2,955.2 = $2,211.3
2002 Current ratio: Current assets/current liabilities
$5,166.5/$2,955.2 = 1.7 to 1
2. Walgreens appears to be fairly liquid, with a positive working capital and a
current ratio of 1.7 to 1. Other factors to consider when evaluating liquidity
would be composition of current assets and the due dates of current
liabilities.
3. (All amounts in millions)
2002 Gross profit ratio: Gross profit/Net sales
$7,605.0/$28,681.1 = 26.5%
2002 Profit margin: Net income/Net sales
$1,019.2/28,681.1 = 3.6%
4. As a stockholder, Walgreens’ gross profit ratio and profit margin appear
acceptable. It would be necessary, however, to compare the 2002 ratios to
those same ratios for Walgreens in past years and to also compare the ratios
to other companies within the same industry.
LO 1,4,8 PROBLEM 2-15A CASH FLOW
Cash available to pay a dividend on December 31, 2004:
Cash balance, December 1, 2004 $ 15,000
+ Cash collections from November 2004 sales 40,000*
– Operating expenses (10,000)
– Payroll: 2 X $4,500 (9,000)
Cash balance, December 31, 2004 $ 36,000
*Accounts receivable balance on December 1.
Conclusion: Roosevelt has $50,000 par value of stock, with the par value of
each share set at $2. Thus, there are 25,000 shares of stock outstanding. At $1
per share in dividends, $25,000 in cash will be needed to meet the annual
dividend payment. On the surface, it appears that Roosevelt should have no
trouble in paying its annual dividend—the above analysis indicates a December
31, 2004, cash balance of $36,000. However, the $30,000 note payable, along
with six months’ interest of $450 (30,000 X 3% X 6/12), will be due two weeks into
FINANCIAL ACCOUNTING SOLUTIONS MANUAL
2-36
the new year (January 15, 2005). If we assume that accounts receivable are
collected relatively evenly over the month, the balance available to repay the
$30,000 note and interest on January 15, 2005, would be only $29,000:
December sales $40,000 X 95% $38,000
– Unearned revenue already collected (2,000)
December sales collected in January $36,000
Divided by 2 (assuming receivables are collected
ratably over the month) ÷ 2
Cash available on January 15 from December sales $18,000
+ Cash available, December 31, 2004 36,000
– Dividend payment (25,000)
Cash available to repay note and interest $29,000
Conclusion: Roosevelt should not declare its normal annual dividend of $1 per
share.
C A S E S
READING AND INTERPRETING FINANCIAL STATEMENTS
LO 3 DECISION CASE 2-1 BOEING’S OPERATING CYCLE
1. Boeing’s inventory would consist of raw materials to produce aircraft,
partially completely aircraft and finished aircraft not yet delivered. The cost
of these inventories would not only include physical components, but would
also include labor costs and other production costs.
2. Because of the long-term nature of aircraft production, aircraft may not be
completed within one year.
3. The current classification for assets is defined as “assets that are reasonably
expected to be realized in cash or sold or consumed during the normal
operating cycle of a business or within one year if the operating cycle is
shorter than one year.” Boeing’s operating cycle is probably longer than one
year in duration. Thus, its inventories are classified as current since they will
be sold during the operating cycle even though it is longer than one year.
LO 4 DECISION CASE 2-2 COMPARING TWO COMPANIES IN
THE SAME INDUSTRY: WINNEBAGO INDUSTRIES AND
MONACO COACH CORPORATION
(All amounts in thousands)
1. Winnebago Industries:
8/31/02 Working capital: $233,596 – $88,601 = $144,995
8/25/01 Working capital: $254,256 – $80,008 = $174,248
Change in working capital: $144,995 – $174,248 =($29,253)
CHAPTER 2 FINANCIAL STATEMENTS AND THE ANNUAL REPORT 2-37
Monaco Coach Corporation:
12/28/02 Working capital: $356,130 – $241,889 = $114,241
12/29/01 Working capital: $239,350 – $175,656 = $63,694
Change in working capital: $114,241 – $63,694 = $50,547
2. Winnebago Industries:
8/31/02 Current ratio: $233,596/$88,601 = 2.6 : 1
8/25/01 Current ratio: $254,256/$80,008 = 3.2 : 1
Percentage change in ratio: (2.6 – 3.2)/3.2 = 19% decrease
Monaco Coach Corporation:
12/28/02 Current ratio: $356,130/$241,889 = 1.5 : 1
12/29/01 Current ratio: $239,350/$175,656 = 1.4 : 1
Percentage change in ratio: (1.5 – 1.4)/1.4 = 7% increase
3. Cash and cash equivalents is a significant percentage of the total current
assets for Winnebago Industries while Monaco Coach Corporation does not
report any cash on its balance sheet. For both companies, inventories make
up nearly 50 percent of total current assets.
4. Winnebago Industries appears to be more liquid than Monaco Coach
Corporation, as measured by the companies’ current ratios. Additionally,
Winnebago Industries’ significant cash and cash equivalents make it more
liquid than Monaco Coach Corporation.
LO 3,4 DECISION CASE 2-3 INTERPRETING MONACO COACH’S
INVENTORY
1. 12/28/02 Inventory: $175,609. The amount of inventory has increased from
a balance of $127,075 at December 29, 2001.
2. The three components of Monaco Coach’s inventory are raw materials,
work-in-process and finished units.
3. The increase in inventory is not necessarily a cause for concern. It may be
due to the need to carry more inventory to handle an increase in sales, which
in fact Monaco Coach experienced in 2002. Also, the increase may be the
result of a decision to keep more inventory on hand to provide more styles
and products to its customers. An increases in inventory should however be
monitored closely.
FINANCIAL ACCOUNTING SOLUTIONS MANUAL
2-38
LO 8 DECISION CASE 2-4 ANALYSIS OF CASH FLOW FOR A
SMALL BUSINESS
All financial decisions involve a trade-off between risk and return. The offer to
work for an investment firm for $40,000 per year may be much less risky than
running one's own business. Charles needs to consider, however, how likely it is
that the employment with the investment firm will continue indefinitely. For
example, could a downswing in the economy cause the firm to cut Charles's
position?
Charles has experienced for himself the risks and rewards of running a
business. To date, the business has not produced significant profits: only
$11,500 over a two-year period. However, the significant increase in
commissions revenue from one year to the next is very encouraging. This is an
example of the potential rewards of running a business.
This case also illustrates the difference between income and cash flow.
Because depreciation is not a cash flow, there is a significant difference between
the cash flow for each of the two years and net income. Assuming that the
revenues and all of the expenses other than depreciation result in cash flows of
the business, the cash inflow for the first year is $(11,000) + $15,000 (add-back
of depreciation) or $4,000. The cash inflow for the second year is even better,
after adjusting for depreciation: $22,500 + $15,000, or $37,500.
LO 9 DECISION CASE 2-5 FACTORS INVOLVED IN AN
INVESTMENT DECISION
Sections of the annual report that should be read in comparing investment
alternatives:
1. Financial statements, including income statement, balance sheet,
statement of stockholders' equity, and statement of cash flows—The
statements give an overall picture of the financial position and results of
operations of the companies.
2. Notes to the financial statements—The notes are an integral part of the
financial statements. They give the reader an indication of the accounting
policies used; the various legal obligations, such as those for leases and
pension plans; the composition of the long-term assets; and many other
details.
3. Managements’ discussion and analysis—This report by management will
reveal how management views the year just completed in comparison to
prior years and how it feels about the company's prospects in the future.
4. Other information contained in the annual report—This might include
descriptions of the company's products and/or services as well as products
in development, existing and emerging markets, types of customers,
projections, social responsibility, and other non-financial information.
As indicated in the case, many fast-food franchisors are owned by large
conglomerates. This can make comparisons between these investment
CHAPTER 2 FINANCIAL STATEMENTS AND THE ANNUAL REPORT 2-39
alternatives especially difficult, because one large conglomerate may own a
totally different set of companies than another. The annual report may or
may not contain detailed information on the different businesses owned by
the conglomerate. The form 10K filed annually with the SEC should be
reviewed for more detailed information than is contained in the annual report
to shareholders. The investor may also want to consult various trade
publications for insights into the industry.
ACCOUNTING AND ETHICS: WHAT WOULD YOU DO?
LO 2 DECISION CASE 2-6 THE EXPENDITURE APPROVAL
PROCESS
The sales rep should be skeptical about Roberto's request for two separate
bills for $900 each. If the rep is aware that the request was made to circumvent
a corporate policy, it would be unethical of the rep to comply with the request.
This certainly puts the rep in a predicament: should he or she risk losing the sale
by refusing to write up two separate bills?
Roberto is not acting in an ethical manner by requesting two bills, given that
it is a deliberate attempt on his part to circumvent corporate policy. He may not
agree with the policy, but it is not ethical to devise a scheme to work around the
policy. Instead, he should write a memo to the corporate chief financial officer to
explain his dissatisfaction with the policy and why it is not appropriate in this
particular situation.
Whether or not the corporate policy is appropriate is difficult to answer
without additional information. At the very least, it seems unreasonable that it
should take three weeks for the approval process.
LO 4,6 DECISION CASE 2-7 BARBARA APPLIES FOR A LOAN
1. Should Barbara present financial statements to her banker that are
incomplete (that make her financial position appear to be better than it
actually is)?
2. If the balance sheet is not provided, the banker will not have all the relevant
(information useful to the decision process that will allow the user to predict
future debt) and reliable information (information that accurately presents the
debt of the company) to make a decision. The information provided by
Barbara will not be free from bias. It will be biased toward presenting her
financial position as better than it is.
3. You should provide the balance sheet to the bank. If the banker does not
receive the balance sheet, and makes a decision only based on the income
statement, this user of the information will not evaluate the risk of the
company correctly. It is unlikely that the banker would consider making the
loan on the basis of the quarterly income statements alone. The most
recent balance sheet tells the banker about the overall financial strength of
the company, and it is an integral part of any loan analysis. As the chief
financial officer for the organization, you have a responsibility to provide the
FINANCIAL ACCOUNTING SOLUTIONS MANUAL
2-40
banker with the necessary information needed to make an informed
decision on the loan. Barbara would rather not show the banker the
balance sheet because it would reveal the substantial loan already on the
books. You are obligated, however, to provide the balance sheet to the
bank if it would be relevant to the bank’s decision. Without it, it is unlikely
the bank will make the loan.
FROM CONCEPT TO PRACTICE 2.1
The two items that are needed on Winnebago Industries’ income statement to
determine its gross profit are “cost of manufactured products” and “revenues
from manufactured products.” The gross profit ratios for the two years can be
determined by deducting “cost of manufactured products” from “revenues from
manufactured products” and dividing the result by “revenues from manufactured
products: (all amounts are in thousands of dollars):
2002: $(825,269 - $708,865)/$825,269 = $116,404/$825,269 = 14.1%
2001: $(671,686 – $588,561)/$671,686 = $83,125/$671,686 = 12.4%
The gross profit ratio went up in 2002 by (14.1% - 12.4%)/12.4% = 13.7%.
Monaco Coach’s gross profit ratios for the two years (all amounts are in
thousands of dollars):
2002: $163,129/$1,222,689 = 13.3%
2001: $113,990/$937,073 = 12.2%
The gross profit went up in 2002 by (13.3% - 12.2%)/12.2% = 9.0%
FROM CONCEPT TO PRACTICE 2.2
Winnebago Industries’ profit margins for the last two years can be determined by
dividing net income by total net revenues (all amounts are in thousands of
dollars):
2002: $54,671/$828,403 = 6.6%
2001: $42,704/$675,927 = 6.3%
The profit margin ratio increased slightly from 2001 to 2002.
Monaco Coach’s profit margins for the last two years can be determined by
dividing net income by net sales (all amounts are in thousands of dollars):
2002: $44,515/$1,222,689 = 3.6%
2001: $24,919/$937,073 = 2.7%
The profit margin ratio increased from 2001 to 2002.
CHAPTER 2 FINANCIAL STATEMENTS AND THE ANNUAL REPORT 2-41
FINANCIAL ACCOUNTING SOLUTIONS MANUAL
2-42

More Related Content

What's hot

Account's assignment
Account's assignmentAccount's assignment
Account's assignment001ashi
 
Pengantar Akuntansi 2 - Ch14 Financial Statement Analysis
Pengantar Akuntansi 2 - Ch14 Financial Statement Analysis Pengantar Akuntansi 2 - Ch14 Financial Statement Analysis
Pengantar Akuntansi 2 - Ch14 Financial Statement Analysis yuliapratiwi2810
 
Financial statements an introduction
Financial statements   an introductionFinancial statements   an introduction
Financial statements an introductionSachin Bhurase
 
Financial statements analysis an introduction
Financial statements analysis an introductionFinancial statements analysis an introduction
Financial statements analysis an introductionSachin Bhurase
 
Keiso 15 chapter 5 review
Keiso 15 chapter 5 reviewKeiso 15 chapter 5 review
Keiso 15 chapter 5 reviewSungah Kimelika
 
Financial analysis and management
Financial analysis and managementFinancial analysis and management
Financial analysis and managementChandresh Madhyan
 
Financial accounting solution manual
Financial accounting solution manualFinancial accounting solution manual
Financial accounting solution manualdiaryinc
 
CHAPTER 3 UNDERSTANDING FINANCIAL STATEMENTS I.docx
CHAPTER 3 UNDERSTANDING FINANCIAL STATEMENTS I.docxCHAPTER 3 UNDERSTANDING FINANCIAL STATEMENTS I.docx
CHAPTER 3 UNDERSTANDING FINANCIAL STATEMENTS I.docxHome
 
Assignment on financial accounting
Assignment on financial accountingAssignment on financial accounting
Assignment on financial accountingamitstranger
 
Keiso15 chapter 4 review
Keiso15 chapter 4 reviewKeiso15 chapter 4 review
Keiso15 chapter 4 reviewSungah Kimelika
 
Financial accounting icab chapter 9 provisions, contingencies and events afte...
Financial accounting icab chapter 9 provisions, contingencies and events afte...Financial accounting icab chapter 9 provisions, contingencies and events afte...
Financial accounting icab chapter 9 provisions, contingencies and events afte...Sazzad Hossain, ITP, MBA, CSCA™
 
Keiso15 chapter 3 review
Keiso15 chapter 3 reviewKeiso15 chapter 3 review
Keiso15 chapter 3 reviewSungah Kimelika
 

What's hot (17)

Account's assignment
Account's assignmentAccount's assignment
Account's assignment
 
Chapter 2
Chapter 2Chapter 2
Chapter 2
 
Pengantar Akuntansi 2 - Ch14 Financial Statement Analysis
Pengantar Akuntansi 2 - Ch14 Financial Statement Analysis Pengantar Akuntansi 2 - Ch14 Financial Statement Analysis
Pengantar Akuntansi 2 - Ch14 Financial Statement Analysis
 
Financial statements an introduction
Financial statements   an introductionFinancial statements   an introduction
Financial statements an introduction
 
Financial statements analysis an introduction
Financial statements analysis an introductionFinancial statements analysis an introduction
Financial statements analysis an introduction
 
Keiso 15 chapter 5 review
Keiso 15 chapter 5 reviewKeiso 15 chapter 5 review
Keiso 15 chapter 5 review
 
Ch01 beechy ism
Ch01 beechy ismCh01 beechy ism
Ch01 beechy ism
 
Financial analysis and management
Financial analysis and managementFinancial analysis and management
Financial analysis and management
 
Financial accounting solution manual
Financial accounting solution manualFinancial accounting solution manual
Financial accounting solution manual
 
Ch10 beechy ism
Ch10 beechy ismCh10 beechy ism
Ch10 beechy ism
 
Ch01
Ch01Ch01
Ch01
 
CHAPTER 3 UNDERSTANDING FINANCIAL STATEMENTS I.docx
CHAPTER 3 UNDERSTANDING FINANCIAL STATEMENTS I.docxCHAPTER 3 UNDERSTANDING FINANCIAL STATEMENTS I.docx
CHAPTER 3 UNDERSTANDING FINANCIAL STATEMENTS I.docx
 
Assignment on financial accounting
Assignment on financial accountingAssignment on financial accounting
Assignment on financial accounting
 
Keiso15 chapter 4 review
Keiso15 chapter 4 reviewKeiso15 chapter 4 review
Keiso15 chapter 4 review
 
Ch02
Ch02Ch02
Ch02
 
Financial accounting icab chapter 9 provisions, contingencies and events afte...
Financial accounting icab chapter 9 provisions, contingencies and events afte...Financial accounting icab chapter 9 provisions, contingencies and events afte...
Financial accounting icab chapter 9 provisions, contingencies and events afte...
 
Keiso15 chapter 3 review
Keiso15 chapter 3 reviewKeiso15 chapter 3 review
Keiso15 chapter 3 review
 

Similar to Sm chapter 02

Accounting Principle 6th Edition Weygandt Test Bank
Accounting Principle 6th Edition Weygandt Test BankAccounting Principle 6th Edition Weygandt Test Bank
Accounting Principle 6th Edition Weygandt Test BankGaybestsarae
 
Cash flow statement
Cash flow statementCash flow statement
Cash flow statementPavan Wani
 
Eng Economics-Report-Safeen Yaseen.pdf
Eng Economics-Report-Safeen Yaseen.pdfEng Economics-Report-Safeen Yaseen.pdf
Eng Economics-Report-Safeen Yaseen.pdfSafeen Yaseen Ja'far
 
Cash flow statements theory and questions
Cash flow statements theory and questionsCash flow statements theory and questions
Cash flow statements theory and questionsMinistry of Edn
 
Financial Reporting for Entrepreneurs
Financial Reporting for EntrepreneursFinancial Reporting for Entrepreneurs
Financial Reporting for EntrepreneursDickson Consulting
 
Keiso15 chapter 2 review
Keiso15 chapter 2 reviewKeiso15 chapter 2 review
Keiso15 chapter 2 reviewSungah Kimelika
 
1 Creating A Successful Financial Plan
1 Creating A Successful Financial Plan1 Creating A Successful Financial Plan
1 Creating A Successful Financial PlanCharlie Congdon
 
Accounting Cash Flow Statement
Accounting  Cash Flow StatementAccounting  Cash Flow Statement
Accounting Cash Flow StatementMary Calkins
 
Ncert Solutions for Class 11 Accountancy
Ncert Solutions for Class 11 AccountancyNcert Solutions for Class 11 Accountancy
Ncert Solutions for Class 11 AccountancyManoj Kumar
 
FFA- Statement of Schedule of Changes in Working Capital
FFA- Statement of Schedule of Changes in Working CapitalFFA- Statement of Schedule of Changes in Working Capital
FFA- Statement of Schedule of Changes in Working Capitaluma reur
 
Financial Account group assignment on Financial statement of Golden Agriculture
Financial Account group assignment on Financial statement of Golden AgricultureFinancial Account group assignment on Financial statement of Golden Agriculture
Financial Account group assignment on Financial statement of Golden Agricultureamykua
 
Entrepreneurship Chap 10
Entrepreneurship Chap 10Entrepreneurship Chap 10
Entrepreneurship Chap 10Umair Arain
 
Financial plan (Entrepreneurship Development)
 Financial plan (Entrepreneurship Development) Financial plan (Entrepreneurship Development)
Financial plan (Entrepreneurship Development)Mahfuzur Rahman
 
Financial management / hospitality management
Financial management / hospitality management Financial management / hospitality management
Financial management / hospitality management Inder Singh
 
1125443386035 solutions to_exercises
1125443386035 solutions to_exercises1125443386035 solutions to_exercises
1125443386035 solutions to_exercisesAh Ching
 
Accounting for Managers Assignment1The purpose of th.docx
Accounting for Managers Assignment1The purpose of th.docxAccounting for Managers Assignment1The purpose of th.docx
Accounting for Managers Assignment1The purpose of th.docxdaniahendric
 

Similar to Sm chapter 02 (20)

Accounting Principle 6th Edition Weygandt Test Bank
Accounting Principle 6th Edition Weygandt Test BankAccounting Principle 6th Edition Weygandt Test Bank
Accounting Principle 6th Edition Weygandt Test Bank
 
Cash flow statement
Cash flow statementCash flow statement
Cash flow statement
 
Financial accounting icab chapter 3 cash flow statements
Financial accounting icab chapter 3 cash flow statementsFinancial accounting icab chapter 3 cash flow statements
Financial accounting icab chapter 3 cash flow statements
 
Eng Economics-Report-Safeen Yaseen.pdf
Eng Economics-Report-Safeen Yaseen.pdfEng Economics-Report-Safeen Yaseen.pdf
Eng Economics-Report-Safeen Yaseen.pdf
 
Assignment accounts
Assignment  accountsAssignment  accounts
Assignment accounts
 
Cash flow statements theory and questions
Cash flow statements theory and questionsCash flow statements theory and questions
Cash flow statements theory and questions
 
Cash flow manual
Cash flow manualCash flow manual
Cash flow manual
 
Financial Reporting for Entrepreneurs
Financial Reporting for EntrepreneursFinancial Reporting for Entrepreneurs
Financial Reporting for Entrepreneurs
 
Keiso15 chapter 2 review
Keiso15 chapter 2 reviewKeiso15 chapter 2 review
Keiso15 chapter 2 review
 
1 Creating A Successful Financial Plan
1 Creating A Successful Financial Plan1 Creating A Successful Financial Plan
1 Creating A Successful Financial Plan
 
Accounting Cash Flow Statement
Accounting  Cash Flow StatementAccounting  Cash Flow Statement
Accounting Cash Flow Statement
 
C2
C2C2
C2
 
Ncert Solutions for Class 11 Accountancy
Ncert Solutions for Class 11 AccountancyNcert Solutions for Class 11 Accountancy
Ncert Solutions for Class 11 Accountancy
 
FFA- Statement of Schedule of Changes in Working Capital
FFA- Statement of Schedule of Changes in Working CapitalFFA- Statement of Schedule of Changes in Working Capital
FFA- Statement of Schedule of Changes in Working Capital
 
Financial Account group assignment on Financial statement of Golden Agriculture
Financial Account group assignment on Financial statement of Golden AgricultureFinancial Account group assignment on Financial statement of Golden Agriculture
Financial Account group assignment on Financial statement of Golden Agriculture
 
Entrepreneurship Chap 10
Entrepreneurship Chap 10Entrepreneurship Chap 10
Entrepreneurship Chap 10
 
Financial plan (Entrepreneurship Development)
 Financial plan (Entrepreneurship Development) Financial plan (Entrepreneurship Development)
Financial plan (Entrepreneurship Development)
 
Financial management / hospitality management
Financial management / hospitality management Financial management / hospitality management
Financial management / hospitality management
 
1125443386035 solutions to_exercises
1125443386035 solutions to_exercises1125443386035 solutions to_exercises
1125443386035 solutions to_exercises
 
Accounting for Managers Assignment1The purpose of th.docx
Accounting for Managers Assignment1The purpose of th.docxAccounting for Managers Assignment1The purpose of th.docx
Accounting for Managers Assignment1The purpose of th.docx
 

Recently uploaded

Cash Payment 9602870969 Escort Service in Udaipur Call Girls
Cash Payment 9602870969 Escort Service in Udaipur Call GirlsCash Payment 9602870969 Escort Service in Udaipur Call Girls
Cash Payment 9602870969 Escort Service in Udaipur Call GirlsApsara Of India
 
2024 Numerator Consumer Study of Cannabis Usage
2024 Numerator Consumer Study of Cannabis Usage2024 Numerator Consumer Study of Cannabis Usage
2024 Numerator Consumer Study of Cannabis UsageNeil Kimberley
 
Insurers' journeys to build a mastery in the IoT usage
Insurers' journeys to build a mastery in the IoT usageInsurers' journeys to build a mastery in the IoT usage
Insurers' journeys to build a mastery in the IoT usageMatteo Carbone
 
Monte Carlo simulation : Simulation using MCSM
Monte Carlo simulation : Simulation using MCSMMonte Carlo simulation : Simulation using MCSM
Monte Carlo simulation : Simulation using MCSMRavindra Nath Shukla
 
Regression analysis: Simple Linear Regression Multiple Linear Regression
Regression analysis:  Simple Linear Regression Multiple Linear RegressionRegression analysis:  Simple Linear Regression Multiple Linear Regression
Regression analysis: Simple Linear Regression Multiple Linear RegressionRavindra Nath Shukla
 
Call Girls In Panjim North Goa 9971646499 Genuine Service
Call Girls In Panjim North Goa 9971646499 Genuine ServiceCall Girls In Panjim North Goa 9971646499 Genuine Service
Call Girls In Panjim North Goa 9971646499 Genuine Serviceritikaroy0888
 
Call Girls in Mehrauli Delhi 💯Call Us 🔝8264348440🔝
Call Girls in Mehrauli Delhi 💯Call Us 🔝8264348440🔝Call Girls in Mehrauli Delhi 💯Call Us 🔝8264348440🔝
Call Girls in Mehrauli Delhi 💯Call Us 🔝8264348440🔝soniya singh
 
Call Girls in Gomti Nagar - 7388211116 - With room Service
Call Girls in Gomti Nagar - 7388211116  - With room ServiceCall Girls in Gomti Nagar - 7388211116  - With room Service
Call Girls in Gomti Nagar - 7388211116 - With room Servicediscovermytutordmt
 
7.pdf This presentation captures many uses and the significance of the number...
7.pdf This presentation captures many uses and the significance of the number...7.pdf This presentation captures many uses and the significance of the number...
7.pdf This presentation captures many uses and the significance of the number...Paul Menig
 
Call Girls In Connaught Place Delhi ❤️88604**77959_Russian 100% Genuine Escor...
Call Girls In Connaught Place Delhi ❤️88604**77959_Russian 100% Genuine Escor...Call Girls In Connaught Place Delhi ❤️88604**77959_Russian 100% Genuine Escor...
Call Girls In Connaught Place Delhi ❤️88604**77959_Russian 100% Genuine Escor...lizamodels9
 
Pharma Works Profile of Karan Communications
Pharma Works Profile of Karan CommunicationsPharma Works Profile of Karan Communications
Pharma Works Profile of Karan Communicationskarancommunications
 
BEST Call Girls In Old Faridabad ✨ 9773824855 ✨ Escorts Service In Delhi Ncr,
BEST Call Girls In Old Faridabad ✨ 9773824855 ✨ Escorts Service In Delhi Ncr,BEST Call Girls In Old Faridabad ✨ 9773824855 ✨ Escorts Service In Delhi Ncr,
BEST Call Girls In Old Faridabad ✨ 9773824855 ✨ Escorts Service In Delhi Ncr,noida100girls
 
rishikeshgirls.in- Rishikesh call girl.pdf
rishikeshgirls.in- Rishikesh call girl.pdfrishikeshgirls.in- Rishikesh call girl.pdf
rishikeshgirls.in- Rishikesh call girl.pdfmuskan1121w
 
Grateful 7 speech thanking everyone that has helped.pdf
Grateful 7 speech thanking everyone that has helped.pdfGrateful 7 speech thanking everyone that has helped.pdf
Grateful 7 speech thanking everyone that has helped.pdfPaul Menig
 
Lucknow 💋 Escorts in Lucknow - 450+ Call Girl Cash Payment 8923113531 Neha Th...
Lucknow 💋 Escorts in Lucknow - 450+ Call Girl Cash Payment 8923113531 Neha Th...Lucknow 💋 Escorts in Lucknow - 450+ Call Girl Cash Payment 8923113531 Neha Th...
Lucknow 💋 Escorts in Lucknow - 450+ Call Girl Cash Payment 8923113531 Neha Th...anilsa9823
 
Call Girls In Radisson Blu Hotel New Delhi Paschim Vihar ❤️8860477959 Escorts...
Call Girls In Radisson Blu Hotel New Delhi Paschim Vihar ❤️8860477959 Escorts...Call Girls In Radisson Blu Hotel New Delhi Paschim Vihar ❤️8860477959 Escorts...
Call Girls In Radisson Blu Hotel New Delhi Paschim Vihar ❤️8860477959 Escorts...lizamodels9
 
Call Girls In Sikandarpur Gurgaon ❤️8860477959_Russian 100% Genuine Escorts I...
Call Girls In Sikandarpur Gurgaon ❤️8860477959_Russian 100% Genuine Escorts I...Call Girls In Sikandarpur Gurgaon ❤️8860477959_Russian 100% Genuine Escorts I...
Call Girls In Sikandarpur Gurgaon ❤️8860477959_Russian 100% Genuine Escorts I...lizamodels9
 
The CMO Survey - Highlights and Insights Report - Spring 2024
The CMO Survey - Highlights and Insights Report - Spring 2024The CMO Survey - Highlights and Insights Report - Spring 2024
The CMO Survey - Highlights and Insights Report - Spring 2024christinemoorman
 

Recently uploaded (20)

Cash Payment 9602870969 Escort Service in Udaipur Call Girls
Cash Payment 9602870969 Escort Service in Udaipur Call GirlsCash Payment 9602870969 Escort Service in Udaipur Call Girls
Cash Payment 9602870969 Escort Service in Udaipur Call Girls
 
2024 Numerator Consumer Study of Cannabis Usage
2024 Numerator Consumer Study of Cannabis Usage2024 Numerator Consumer Study of Cannabis Usage
2024 Numerator Consumer Study of Cannabis Usage
 
Insurers' journeys to build a mastery in the IoT usage
Insurers' journeys to build a mastery in the IoT usageInsurers' journeys to build a mastery in the IoT usage
Insurers' journeys to build a mastery in the IoT usage
 
Monte Carlo simulation : Simulation using MCSM
Monte Carlo simulation : Simulation using MCSMMonte Carlo simulation : Simulation using MCSM
Monte Carlo simulation : Simulation using MCSM
 
Regression analysis: Simple Linear Regression Multiple Linear Regression
Regression analysis:  Simple Linear Regression Multiple Linear RegressionRegression analysis:  Simple Linear Regression Multiple Linear Regression
Regression analysis: Simple Linear Regression Multiple Linear Regression
 
Call Girls In Panjim North Goa 9971646499 Genuine Service
Call Girls In Panjim North Goa 9971646499 Genuine ServiceCall Girls In Panjim North Goa 9971646499 Genuine Service
Call Girls In Panjim North Goa 9971646499 Genuine Service
 
Call Girls in Mehrauli Delhi 💯Call Us 🔝8264348440🔝
Call Girls in Mehrauli Delhi 💯Call Us 🔝8264348440🔝Call Girls in Mehrauli Delhi 💯Call Us 🔝8264348440🔝
Call Girls in Mehrauli Delhi 💯Call Us 🔝8264348440🔝
 
Call Girls in Gomti Nagar - 7388211116 - With room Service
Call Girls in Gomti Nagar - 7388211116  - With room ServiceCall Girls in Gomti Nagar - 7388211116  - With room Service
Call Girls in Gomti Nagar - 7388211116 - With room Service
 
7.pdf This presentation captures many uses and the significance of the number...
7.pdf This presentation captures many uses and the significance of the number...7.pdf This presentation captures many uses and the significance of the number...
7.pdf This presentation captures many uses and the significance of the number...
 
Call Girls In Connaught Place Delhi ❤️88604**77959_Russian 100% Genuine Escor...
Call Girls In Connaught Place Delhi ❤️88604**77959_Russian 100% Genuine Escor...Call Girls In Connaught Place Delhi ❤️88604**77959_Russian 100% Genuine Escor...
Call Girls In Connaught Place Delhi ❤️88604**77959_Russian 100% Genuine Escor...
 
Best Practices for Implementing an External Recruiting Partnership
Best Practices for Implementing an External Recruiting PartnershipBest Practices for Implementing an External Recruiting Partnership
Best Practices for Implementing an External Recruiting Partnership
 
Pharma Works Profile of Karan Communications
Pharma Works Profile of Karan CommunicationsPharma Works Profile of Karan Communications
Pharma Works Profile of Karan Communications
 
BEST Call Girls In Old Faridabad ✨ 9773824855 ✨ Escorts Service In Delhi Ncr,
BEST Call Girls In Old Faridabad ✨ 9773824855 ✨ Escorts Service In Delhi Ncr,BEST Call Girls In Old Faridabad ✨ 9773824855 ✨ Escorts Service In Delhi Ncr,
BEST Call Girls In Old Faridabad ✨ 9773824855 ✨ Escorts Service In Delhi Ncr,
 
rishikeshgirls.in- Rishikesh call girl.pdf
rishikeshgirls.in- Rishikesh call girl.pdfrishikeshgirls.in- Rishikesh call girl.pdf
rishikeshgirls.in- Rishikesh call girl.pdf
 
Grateful 7 speech thanking everyone that has helped.pdf
Grateful 7 speech thanking everyone that has helped.pdfGrateful 7 speech thanking everyone that has helped.pdf
Grateful 7 speech thanking everyone that has helped.pdf
 
Lucknow 💋 Escorts in Lucknow - 450+ Call Girl Cash Payment 8923113531 Neha Th...
Lucknow 💋 Escorts in Lucknow - 450+ Call Girl Cash Payment 8923113531 Neha Th...Lucknow 💋 Escorts in Lucknow - 450+ Call Girl Cash Payment 8923113531 Neha Th...
Lucknow 💋 Escorts in Lucknow - 450+ Call Girl Cash Payment 8923113531 Neha Th...
 
Call Girls In Radisson Blu Hotel New Delhi Paschim Vihar ❤️8860477959 Escorts...
Call Girls In Radisson Blu Hotel New Delhi Paschim Vihar ❤️8860477959 Escorts...Call Girls In Radisson Blu Hotel New Delhi Paschim Vihar ❤️8860477959 Escorts...
Call Girls In Radisson Blu Hotel New Delhi Paschim Vihar ❤️8860477959 Escorts...
 
Call Girls In Sikandarpur Gurgaon ❤️8860477959_Russian 100% Genuine Escorts I...
Call Girls In Sikandarpur Gurgaon ❤️8860477959_Russian 100% Genuine Escorts I...Call Girls In Sikandarpur Gurgaon ❤️8860477959_Russian 100% Genuine Escorts I...
Call Girls In Sikandarpur Gurgaon ❤️8860477959_Russian 100% Genuine Escorts I...
 
The CMO Survey - Highlights and Insights Report - Spring 2024
The CMO Survey - Highlights and Insights Report - Spring 2024The CMO Survey - Highlights and Insights Report - Spring 2024
The CMO Survey - Highlights and Insights Report - Spring 2024
 
KestrelPro Flyer Japan IT Week 2024 (English)
KestrelPro Flyer Japan IT Week 2024 (English)KestrelPro Flyer Japan IT Week 2024 (English)
KestrelPro Flyer Japan IT Week 2024 (English)
 

Sm chapter 02

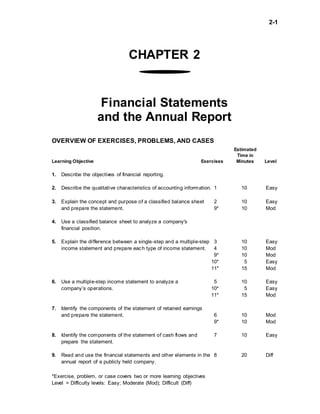
  • 1. 2-1 CHAPTER 2 Financial Statements and the Annual Report OVERVIEW OF EXERCISES, PROBLEMS, AND CASES Estimated Time in Learning Objective Exercises Minutes Level 1. Describe the objectives of financial reporting. 2. Describe the qualitative characteristics of accounting information. 1 10 Easy 3. Explain the concept and purpose of a classified balance sheet 2 10 Easy and prepare the statement. 9* 10 Mod 4. Use a classified balance sheet to analyze a company's financial position. 5. Explain the difference between a single-step and a multiple-step 3 10 Easy income statement and prepare each type of income statement. 4 10 Mod 9* 10 Mod 10* 5 Easy 11* 15 Mod 6. Use a multiple-step income statement to analyze a 5 10 Easy company’s operations. 10* 5 Easy 11* 15 Mod 7. Identify the components of the statement of retained earnings and prepare the statement. 6 10 Mod 9* 10 Mod 8. Identify the components of the statement of cash flows and 7 10 Easy prepare the statement. 9. Read and use the financial statements and other elements in the 8 20 Diff annual report of a publicly held company. *Exercise, problem, or case covers two or more learning objectives Level = Difficulty levels: Easy; Moderate (Mod); Difficult (Diff)
  • 2. FINANCIAL ACCOUNTING SOLUTIONS MANUAL 2-2 Problems Estimated and Time in Learning Objective Alternates Minutes Level 1. Describe the objectives of financial reporting. 15* 45 Diff 2. Describe the qualitative characteristics of accounting information. 1 15 Diff 2 15 Mod 11* 35 Mod 12* 20 Mod 3. Explain the concept and purpose of a classified balance sheet 3 50 Mod and prepare the statement. 13* 60 Mod 4. Use a classified balance sheet to analyze a company's 4 20 Easy financial position. 5 15 Mod 11* 35 Mod 14* 35 Mod 15* 45 Diff 5. Explain the difference between a single-step and a multiple-step 6 30 Mod income statement and prepare each type of income statement. 7 45 Mod 12* 20 Mod 13* 60 Mod 6. Use a multiple-step income statement to analyze a 8 35 Mod company's operations. 14* 35 Mod 7. Identify the components of the statement of retained earnings and 11 30 Mod prepare the statement. 13* 60 Mod 8. Identify the components of the statement of cash flows and 9 30 Mod prepare the statement. 15* 45 Diff 9. Read and use the financial statements and other elements 10 30 Diff in the annual report of a publicly held company. *Exercise, problem, or case covers two or more learning objectives Level= Difficulty levels: Easy’ Moderate (Mod); Difficult (Diff)
  • 3. CHAPTER 2 FINANCIAL STATEMENTS AND THE ANNUAL REPORT 2-3 Estimated Time in Learning Objective Cases Minutes Level 1. Describe the objectives of financial reporting. 2. Describe the qualitative characteristics of accounting information. 6 30 Mod 3. Explain the concept and purpose of a classified balance sheet, 1 25 Easy and prepare the statement. 3* 20 Mod 4. Use a classified balance sheet to analyze a company's 2 30 Mod financial position. 3* 20 Mod 7* 30 Mod 5. Explain the difference between a single-step and a multiple-step income statement, and prepare each type of income statement. 6. Use a multiple-step income statement to analyze a 7* 30 Mod company's operations 7. Identify the components of the statement of retained earnings and prepare the statement 8. Identify the components of the statement of cash flows and 4 25 Mod prepare the statement 9. Read and use the financial statements and other elements in the 5 30 Mod annual report of a publicly held company *Exercise, problem, or case covers two or more learning objectives Level = Difficulty levels: Easy; Moderate (Mod); Difficult (Diff)
  • 4. FINANCIAL ACCOUNTING SOLUTIONS MANUAL 2-4 Q U E S T I O N S 1. The primary concern to an investor is the future cash to be received from the investment. However, this does not mean that the cash flows of the company that has been invested in are not relevant. A relationship exists between the cash flows to the investor and those to the company. For example, a company that does not consistently generate sufficient cash flows from its operations will not be able to pay cash dividends to the investors over a sustained time. 2. The understandability characteristic does not imply that someone must have an extensive accounting background to be able to use financial statements. However, accounting information should be understandable to those who are willing to learn to use it properly. In other words, the information should make sense to someone who spends the time required to have a basic understanding of accounting. 3. Relevance is the capacity of accounting information to make a difference in a financial decision. For example, an income statement is relevant when the use of it has at least the potential to make a difference in an investment decision. 4. Comparability is the quality of accounting information that allows comparisons to be made between or among companies. Without it, financial statements would be very limited in their value. Financial decisions require choices to be made about the investment of limited resources. Investors need assurance that the financial statements of companies that they are considering as investments are comparable. 5. Comparability is the quality of information that allows for comparisons to be made between two or more companies, whereas consistency is the quality that allows for comparisons to be made within a single entity from one accounting period to the next. 6. The concept of materiality is closely related to the size of a company. For example, assume that a company must decide whether a $500 expenditure that will benefit future periods should be expensed immediately or capitalized (i.e., recorded as an asset). The decision cannot be made without considering the amount in relation to the size of the company. An amount that is immaterial for a large multinational corporation may be material for a smaller business.
  • 5. CHAPTER 2 FINANCIAL STATEMENTS AND THE ANNUAL REPORT 2-5 7. The operating cycle for a retailer begins when a product is purchased from either a manufacturer or a wholesaler. The next step in the cycle is the sale of the product. The cycle is completed when cash is collected from the customer. Because a service company does not have a tangible product to sell, the first step is eliminated, and its operating cycle begins when a service is provided to a customer. 8. A current asset is an asset that a company expects to realize in cash, sell, or consume during its normal operating cycle. Therefore, accounts receivable, inventory, and supplies all meet this definition and are classified as current assets. By their nature, the benefits from each of these assets will be realized during the normal operating cycle of the business. 9. The intent of a company is important in classifying an asset on the balance sheet. For example, a piece of machinery could be classified as either inventory (a current asset) or property, plant, and equipment (a long-term asset) depending on whether the intent is to resell it or hold it for use in the operations of the business. As another example, assume that a company purchases 100 shares of General Motors stock. Whether the stock is classified as current or long-term depends on whether the company plans to sell the stock within the next year or the operating cycle, whichever is longer. 10. The note payable will be classified on the balance sheet as long-term until one year from its maturity date. At that time, it should be reclassified from long-term to current because it will be paid within the next year. Any liability that will mature within one year of the date of the balance sheet should be classified as current, regardless of the original term of the loan (five years in this case). 11. Both capital stock and retained earnings represent claims of the stockholders on the assets of the business. They differ, however, in the source of those claims. Capital stock represents the claims of the stockholders that arise from their contributions of cash and other assets to the business. Retained earnings represents the claims of the stockholders arising from the undistributed earnings of the business since its inception. 12. Working capital is an absolute measure of liquidity. That is, it is the total dollar amount of current assets minus current liabilities. One of the problems with working capital as a measure of liquidity is that it does not allow someone to compare the relative liquidity of two companies of different sizes. Even within a single company, it may be difficult to compare the relative liquidity of the company over time if the company has grown. The current ratio (current assets divided by current liabilities) overcomes these deficiencies by focusing attention on the relative size of the current assets and current liabilities. 13. Capital structure refers to the right side of a balance sheet. All items on the right side of the balance sheet represent claims against the assets of the
  • 6. FINANCIAL ACCOUNTING SOLUTIONS MANUAL 2-6 business: liabilities are the claims of outsiders, and stockholders' equity is the claim of the owners on the assets of the business. The capital structures of all companies differ in that some companies rely more on outsiders to provide assets, whereas others rely more on the owners to provide the necessary assets to run the business. 14. The single-step income statement shows a subtotal for all expenses and deducts this amount from total revenues. The weakness of the single-step form for the income statement is that relationships between key items on the statement are not highlighted. For example, the relationship between sales revenue and the cost of the products sold is very important for a product-oriented company. The difference between the two amounts is called gross profit and would appear on a multiple-step statement but not the single-step form. 15. An increase in the gross profit ratio indicates that the company has been able to decrease the cost of the product it sells relative to the selling price. For a retailer, this may be the result of dealing with a different supplier of merchandise. On the other hand, a decrease in the profit margin ratio may be an indication of an inability to control various operating expenses, such as selling and administrative expenses. 16. A statement of retained earnings links the income statement and the balance sheet in the following way. A statement of retained earnings shows the beginning balance in the account, the addition to the account for the net income of the period, and any deduction from the account for dividends. The beginning balance in retained earnings is taken from the balance sheet at the end of the prior period. The income statement indicates the net income for the period. The ending balance in retained earnings appears on the balance sheet at the end of the period. 17. An audit of a set of financial statements does not ensure that the statements contain no errors. Because of the sheer number of transactions entered into during a period of time, it would be impossible for an auditor to check every single transaction to determine that it was correctly recorded. Instead, through various types of tests, the auditor renders an opinion as to whether the statements are free of material misstatement. 18. The first note is the summary of significant accounting policies. As the name implies, the purpose of this note is to summarize all of the company's important accounting policies, such as those relating to the method of depreciating assets and the method for valuing inventories.
  • 7. CHAPTER 2 FINANCIAL STATEMENTS AND THE ANNUAL REPORT 2-7 E X E R C I S E S LO 2 EXERCISE 2-1 CHARACTERISTICS OF USEFUL ACCOUNTING INFORMATION 1. reliability 5. verifiability 2. relevance 6. understandability 3. representational faithfulness 7. neutrality 4. consistency 8. comparability LO 3 EXERCISE 2-2 CLASSIFICATION OF ASSETS AND LIABILITIES 1. CA 6. CL 2. CL 7. CA 3. CA 8. LTL 4. NCA 9. NCA 5. CL LO 5 EXERCISE 2-3 SELLING EXPENSES AND GENERAL AND ADMINISTRATIVE EXPENSES 1. Advertising expense—S 2. Depreciation expense—store furniture and fixtures—S 3. Office rent expense—G&A 4. Office salaries expense—G&A 5. Store rent expense—S 6. Store salaries expense—S 7. Insurance expense—G&A* 8. Supplies expense—G&A* 9. Utilities expense—G&A* *Each of these could be classified as a selling expense if the cost is related in some way to the sales function; e.g., insurance on cars driven by sales people could be classified as a selling expense.
  • 8. FINANCIAL ACCOUNTING SOLUTIONS MANUAL 2-8 LO 5 EXERCISE 2-4 MISSING INCOME STATEMENT AMOUNTS Sara’s Coffee Amy’s Jane’s Shop Deli Bagels Net sales $35,000 (3) $63,000 $78,000 Cost of goods sold (1) 28,000 45,000 (7) 39,000 Gross profit 7,000 18,000 (6) 39,000 Selling expenses 3,000 (4) 6,000 9,000 General and admini- strative expenses 1,500 2,800 (5) 4,600 Total operating expenses (2) 4,500 8,800 13,600 Net income $ 2,500 $ 9,200 $25,400 Solved as follows (in the order listed): (1) 35,000 – 7,000 = 28,000 (2) 3,000 + 1,500 = 4,500 (3) 45,000 + 18,000 = 63,000 (4) 8,800 – 2,800 = 6,000 (5) 13,600 – 9,000 = 4,600 (6) 25,400 + 13,600 = 39,000 (7) 78,000 – 39,000 = 39,000 LO 6 EXERCISE 2-5 INCOME STATEMENT RATIOS 1. Gross profit ratio (134,800 – 53,920)/134,800 = 60% 2. Profit margin 45,000/134,800 = 33.4% Other information needed: ratios for prior years ratios for other companies in same industry
  • 9. CHAPTER 2 FINANCIAL STATEMENTS AND THE ANNUAL REPORT 2-9 LO 7 EXERCISE 2-6 STATEMENT OF RETAINED EARNINGS LANDON CORPORATION STATEMENT OF RETAINED EARNINGS FOR THE YEAR ENDED DECEMBER 31, 2004 Retained earnings, January 1, 2004 $ 130,520* Add: Net income 145,480 $ 276,000 Less: Dividends declared and paid 40,000 Retained earnings, December 31, 2004 $ 236,000 *Retained earnings, January 2, 2002 $ 0 Add: Net income: 2002: $ 85,200 2003: 125,320 210,520 Deduct: Dividends: 2002: $ 40,000 2003: 40,000 80,000 Retained earnings, December 31, 2003 $ 130,520 LO 8 EXERCISE 2-7 COMPONENTS OF THE STATEMENT OF CASH FLOWS 1. Paid for supplies—0 2. Collected cash from customers—0 3. Purchased land (held for resale)—0 4. Purchased land (for construction of new building)—I 5. Paid dividend—F 6. Issued stock—F 7. Purchased computers—I 8. Sold old equipment—I LO 9 EXERCISE 2-8 BASIC ELEMENTS OF FINANCIAL STATEMENTS 1. Management’s report—This report is prepared by management as a way to ensure that users realize that management is responsible for the information in the financial statements. The internal control system is usually described briefly, and the independent auditors are identified. The management’s report is not subject to any outside review or support. Users must rely on the integrity of management that the information contained in the report is reliable. 2. Products/markets of company—Management provides information in the annual report about the company's products and markets. The detail
  • 10. FINANCIAL ACCOUNTING SOLUTIONS MANUAL 2-10 provided by management differs widely among companies, but most companies describe their various products and often show pictures of them. The distribution system for the products, i.e., whom the company sells to, is also described. Because the company's products and markets are a matter of public knowledge, they are subject to verification. 3. Financial statements—These are the responsibility of management and are normally prepared by the controller. They include the income statement, balance sheet, statement of changes in stockholders' equity, and statement of cash flows. The information provided in the financial statements is subject to verification as part of the external audit. 4. Notes to financial statements—These are also the responsibility of management, and they include detailed explanations about the various items appearing in the financial statements. The first note in most annual reports is a summary of the significant accounting policies, such as the company's inventory valuation methods and depreciation methods. The information included in the notes is subject to review by the independent auditors and is therefore highly verifiable. 5. Independent accountants' report—As the name implies, this report is prepared by the independent auditors. It includes information about the scope of the audit (the statements included in the audit), the auditing standards followed in conducting the audit, and an opinion as to the fairness of presentation of the financial statements. Because the public relies on the auditors to render an impartial opinion, the auditing profession is subject to a set of high ethical standards in performing audits. MULTI-CONCEPT EXERCISES LO 3,5,7 EXERCISE 2-9 FINANCIAL STATEMENT CLASSIFICATION BS = Balance sheet; IS = Income statement; RE = Retained earnings statement 1. Accounts payable—BS 12. Land held for future 2. Accounts receivable—BS expansion—BS 3. Advertising expense—IS 13. Loss on the sale of 4. Bad debts expense—IS equipment—IS 5. Bonds payable—BS 14. Office supplies—BS 6. Buildings—BS 15. Organizational costs—IS 7. Cash—BS 16. Patent amortization expense—IS 8. Common stock—BS 17. Retained earnings—BS, RE 9. Deferred income taxes—BS 18. Sales—IS 10. Depreciation expense—IS 19. Unearned revenue—BS 11. Dividends—RE 20. Utilities expense—IS
  • 11. CHAPTER 2 FINANCIAL STATEMENTS AND THE ANNUAL REPORT 2-11 LO 5,6 EXERCISE 2-10 SINGLE- AND MULTIPLE-STEP INCOME STATEMENT 1. Sales—B 2. Cost of goods sold—B 3. Selling expenses—M* 4. Total revenues—S 5. Utilities expense—B 6. Administrative expense—M* 7. Net loss—B 8. Supplies on hand—N 9. Accumulated depreciation—N 10. Gross profit—M *This assumes that selling and administrative expenses are each headings for a group of expenses. If this is the case, they would appear only on a multiple- step income statement. LO 5,6 EXERCISE 2-11 MULTIPLE-STEP INCOME STATEMENT Gross profit ratio: Gross profit/sales = $750,000*/$1,200,000 = 62.5% *$1,200,000 – $450,000 = $750,000* Profit margin: Net income/Sales = $614,200*/$1,200,000 = 51.2% *$750,000 – $60,800 – $75,000 = $614,200 Gaynor Corporation has been very profitable on the basis of its very high gross profit ratio and profit margin. Before making an investment, however, you would want to consider how these ratios compare with those of prior years and with those of other companies in the same line of business.
  • 12. FINANCIAL ACCOUNTING SOLUTIONS MANUAL 2-12 P R O B L E M S LO 2 PROBLEM 2-1 MATERIALITY 1. Among the questions that might be answered by the analysis that was performed are these: Is the usage of any of the items cyclical? Is there a relationship between the usage of any two or more of the items? Is the amount being spent on these items material? Would it be feasible to set up an account at an office supply store for some of these items if they are used in large quantities? From this analysis, the company might decide to change the timing of its ordering to correspond to its need. 2. This question deals with the concept of materiality. It is likely this information would be more relevant for a real estate company than for a hardware store. Normally, a realtor would use more office supplies, relative to its use of other types of supplies, and thus the amount spent on office supplies would be more material to it than to a hardware store. LO 2 PROBLEM 2-2 COSTS AND EXPENSES 1. Display fixtures—Only a portion of the cost would appear in the period of acquisition; the fixtures should be depreciated over their useful lives. 2. Advertising—All. 3. Merchandise for sale—The cost for that portion of the inventory sold should be recognized as an expense in the current period, and the remainder included in inventory on the balance sheet. 4. Costs of incorporation—Because of the difficulty in determining the period over which benefits will be received from the costs necessary to incorporate, accounting standards require that these costs be expensed as incurred. 5. Cost of a franchise—This is a cost that should benefit several future periods, and only a portion should be expensed in the current period; the cost of the franchise should be treated as an intangible asset and amortized over the periods during which benefits are expected. 6. Office supplies—The portion of the supplies used should be recognized as an expense in the current period; the unused portion should be reported as a current asset. 7. Wages in a restaurant—All.
  • 13. CHAPTER 2 FINANCIAL STATEMENTS AND THE ANNUAL REPORT 2-13 8. Computer software—Assuming that the software was purchased, an intangible asset should be recognized and a portion of the cost recognized as expense in each of the periods benefited. 9. Computer hardware—Only the portion of the cost associated with the benefits provided during the current period would be recognized as depreciation expense; the cost should be written off over the useful life of the hardware. LO 3 PROBLEM 2-3 CLASSIFIED BALANCE SHEET 1. Classified balance sheet: RUTH CORPORATION BALANCE SHEET DECEMBER 31, 2004 Assets Current assets: Cash $ 13,230 Accounts receivable 23,450 Inventory 45,730 Prepaid rent 1,500 Office supplies 2,340 Total current assets $ 86,250 Long-term investments 85,000 Property, plant, and equipment: Land $ 250,000 Automobiles $ 112,500 Less: Accumulated depreciation 22,500 90,000 Buildings 200,000 Less: Accumulated depreciation 40,000 160,000 Total property, plant, and equipment 500,000 Intangible assets: Patents 40,000 Total assets $ 711,250
  • 14. FINANCIAL ACCOUNTING SOLUTIONS MANUAL 2-14 Liabilities Current liabilities: Accounts payable $ 18,255 Income taxes payable 6,200 Interest payable 1,500 Notes payable, due June 30, 2005 10,000 Salaries and wages payable 4,200 Total current liabilities $ 40,155 Long-term debt: Bonds payable, due December 31, 2008 160,000 Total liabilities $ 200,155 Stockholders' Equity Contributed capital: Capital stock, $10 par value, 15,000 shares issued and outstanding $ 150,000 Paid-in capital in excess of par value 50,000 Total contributed capital 200,000 Retained earnings 311,095 Total stockholders' equity 511,095 Total liabilities and stockholders' equity $ 711,250 2. Current ratio = Current assets/Current liabilities $86,250/$40,155 = 2.15 to 1 3. From the current ratio alone, Ruth appears to be relatively liquid. To fully assess its liquidity, however, it would be useful to look more specifically at the composition of the current assets and liabilities. In addition, how long on the average does it take Ruth to sell inventory? How long does it take to collect an account receivable? Also, you would want to compare Ruth's current ratio at the end of this period with those of prior periods, and with the current ratio for companies in the same industry. LO 4 PROBLEM 2-4 FINANCIAL STATEMENT RATIOS 1. a. Working capital at 12/31/04: Current assets: $13,230 + $10,200 + $450 + $24,600 + $6,250 + $3,600 = $58,330 Current liabilities: $8,400 + $1,450 + $1,200 = $11,050 Working capital = $58,330 – $11,050 = $47,280
  • 15. CHAPTER 2 FINANCIAL STATEMENTS AND THE ANNUAL REPORT 2-15 Working capital at 12/31/03: Current assets: $19,570 + $9,450 + $700 + $26,200 + $5,020 + $4,800 = $65,740 Current liabilities: $5,200 + $1,200 + $12,000 + $1,230 + $1,600 = $21,230 Working capital = $65,740 – $21,230 = $44,510 b. Current ratio at 12/31/04: $58,330/$11,050 = 5.28 to 1 Current ratio at 12/31/03: $65,740/$21,230 = 3.10 to 1 2. Both the absolute liquidity position of the company and the relative liquidity position of the company have improved during 2004. First, the absolute position, as indicated by the amount of working capital, has improved from $44,510 to $47,280. The liquidity of the company has also improved on a relative basis, as indicated by the increase in the current ratio from 3.10 to 5.28. The primary reason for the improvement in the company's liquidity is the repayment during the year of the $12,000 note payable, along with the $1,200 of interest payable on the note. This is counterbalanced somewhat, though, by the decrease in accounts receivable from $19,570 to $13,230. LO 4 PROBLEM 2-5 WORKING CAPITAL AND CURRENT RATIO 1. Current ratio = Current assets/Current liabilities ($23,000 + $13,000 + $45,000 + $800)/($54,900 + $1,200) = $81,800/$56,100 = 1.46 to 1 Working capital = Current assets – Current liabilities = $81,800 – $56,100 = $25,700 2. One concern is the relatively large percentage of the current assets tied up in inventory. This asset accounts for $45,000/$81,800, or 55% of the total current assets. What is the normal period of time it takes to sell inventory? Is any part of the inventory slow-moving or obsolete? 3. On the basis of current ratio alone, Stevenson appears to be relatively liquid, although it would be important to compare the ratio with those of prior years and with those of other companies in the same industry.
  • 16. FINANCIAL ACCOUNTING SOLUTIONS MANUAL 2-16 LO 5 PROBLEM 2-6 SINGLE-STEP INCOME STATEMENT 1. Single-step income statement: SHAW CORPORATION INCOME STATEMENT FOR THE YEAR ENDED DECEMBER 31, 2004 Revenues: Sales $48,300 Interest 1,340 Rent 6,700 Total revenues $ 56,340 Expenses: Cost of goods sold $29,200 Advertising 1,500 Commissions 2,415 Depreciation—office building 2,900 Interest 1,400 Insurance—salesperson’s auto 2,250 Salaries and wages—office 12,560 Supplies—office 890 Income taxes 1,540 Total expenses 54,655 Net income $ 1,685 2. A single-step income statement does not lend itself as readily to analysis as does a multiple-step statement. For example, with a single-step statement, gross profit must first be computed before the gross profit ratio can be determined. In addition, the lack of any grouping of the various expenses makes any type of analysis more difficult.
  • 17. CHAPTER 2 FINANCIAL STATEMENTS AND THE ANNUAL REPORT 2-17 LO 5 PROBLEM 2-7 MULTIPLE-STEP INCOME STATEMENT 1. Multiple-step income statement: SHAW CORPORATION INCOME STATEMENT FOR THE YEAR ENDED DECEMBER 31, 2004 Sales $48,300 Cost of goods sold 29,200 Gross profit $ 19,100 Operating expenses: Selling expenses: Advertising $ 1,500 Commissions 2,415 Insurance—salesperson’s auto 2,250 Total selling expense $ 6,165 General and administrative expenses: Depreciation—office building $ 2,900 Salaries and wages—office 12,560 Supplies—office 890 Total general and administrative expense 16,350 Total operating expense 22,515 Income from operations $ (3,415) Other revenues and expenses: Interest expense $ 1,400 Interest revenue 1,340 Rent revenue 6,700 Excess of other revenues over other expenses 6,640 Income before taxes $ 3,225 Income tax expense 1,540 Net income $ 1,685 2. Gross profit ratio = Gross profit/Sales revenue = $19,100/$48,300 = 39.5% 3. The gross profit ratio tells the reader of the income statement that for every $1 of sales, Shaw recovers $.395, or 39.5 cents, after deducting product cost (60.5 cents of every dollar). The ratio of gross profit to cost of sales, or markup on cost, is 39.5/60.5, or 65.3%.
  • 18. FINANCIAL ACCOUNTING SOLUTIONS MANUAL 2-18 LO 6 PROBLEM 2-8 ALBERTSONS’ GROSS PROFIT RATIO 1. A retailer, such as Albertsons, generally faces a slowdown in business in the post-holiday month of January. This slowdown would allow it to focus more on its fiscal year-end procedures, and include any returns or adjustments relating to holiday sales. 2. (In thousands) (Sales – Cost of goods sold)/Sales = Gross profit/Sales 2002: ($35,626 – $25,242)/$35,626 = 29.1% 2001: ($36,605 – $26,179)/$36,605 = 28.5% 2000: ($35,501 – $25,409)/$35,501 = 28.4% 3. The gross profit ratio increased slightly from 2000 to 2001, and then by another small percentage in 2002. Possible explanations for the increases could include higher selling prices, lower costs of merchandise purchased, or a change in the mix of products sold towards higher gross profit items. LO 8 PROBLEM 2-9 STATEMENT OF CASH FLOWS 1. COLORADO CORPORATION STATEMENT OF CASH FLOWS FOR THE YEAR ENDED DECEMBER 31, 2004 Cash flows from operating activities: Cash collected from customers $ 93,970 Cash paid for inventory (65,600) Cash paid in salaries and wages (20,400) Cash paid in taxes ( 3,100) Net cash provided by operating activities $ 4,870 Cash flows from investing activities: Payment on office building (210,000) Cash flows from financing activities: Proceeds from issuance of stock $ 250,000 Proceeds from long-term note 60,000 Dividends declared and paid (5,600) Net cash provided by financing activities 304,400 Net increase in cash $ 99,270 Cash at beginning of year 0 Cash at end of year $ 99,270 Note: Colorado should report one significant noncash activity as supplementary information to its statement of cash flows: the three-year, $90,000 note signed to finance the purchase of the office building.
  • 19. CHAPTER 2 FINANCIAL STATEMENTS AND THE ANNUAL REPORT 2-19 2. First, the statement of cash flows reports on operations on a cash basis, as opposed to the income statement which is prepared on an accrual basis. Second, investing and financing activities are also reported on a statement of cash flows. For example, information about dividends paid during the year are shown on a statement of cash flows but not on an income statement. It is interesting to note that Colorado paid more in dividends, $5,600, than the amount of cash it generated from operations, $4,870. LO 9 PROBLEM 2-10 BASIC ELEMENTS OF FINANCIAL REPORTS Letter from the President to Stockholders of Grammar Inc.: On the surface, 2004 does not appear to have been a successful year for Grammar Inc. One specific event, however, caused the net loss we experienced for the year. The sale of a subsidiary resulted in a loss of $400,000. The sale of this unprofitable unit of the business should allow us to concentrate our attention in the future on our successful businesses and clear the way for a return to overall profitability in 2005. I should point out to you that aside from the loss experienced on the sale of the subsidiary, 2004 was a very good year. Our gross profit ratio increased to 50% from 40% in the prior year. Similarly, we were able to control our operating expenses, as operating income as a percentage of sales increased from 20% to 38%. These are clear signals that Grammar is moving in the right direction and should have a solid year of operations in 2005. MULTI-CONCEPT PROBLEMS LO 2,4 PROBLEM 2-11 COMPARING COCA-COLA AND PEPSICO 1. Current assets – Current liabilities = Working capital (In millions) Coca-Cola: ($2,126 + $1,294 + $219 + $1,616 + $2,097) – ($3,692 + $994 + $180 + $2,475) = $7,352 – $7,341 = $11 PepsiCo: ($2,531 + $1,638 + $1,342 + $695 + $207) – ($4,998 + $492 + $562) = $6,413 – $6,052 = $361 Current Assets Current liabilities = Current ratio Coca-Cola: $7,352/$7,341 = 1.00:1 PepsiCo: $6,413/$6,052 = 1.06:1
  • 20. FINANCIAL ACCOUNTING SOLUTIONS MANUAL 2-20 2. Based on the analysis in Part 1., PepsiCo appears slightly more liquid than Coca-Cola, with a higher working capital and a higher current ratio. 3. The composition of a company’s current assets adds another level to the analysis of liquidity. Coca-Cola’s cash, the most liquid of assets, comprises 29% of current assets. PepsiCo’s cash is 26% of current assets. On the other hand, PepsiCo’s accounts and notes receivable, also highly liquid, are 39% of current assets, contrasting with Coca-Cola’s accounts receivable of 29%. Although receivables are considered very liquid, questions may arise about collectibility. LO 2,5 PROBLEM 2-12 COMPARABILITY AND CONSISTENCY IN INCOME STATEMENTS 1. The income statement for 2003 is in single-step format, and the 2004 statement uses the multiple-step format. 2. GLEESON COMPANY INCOME STATEMENT FOR THE YEAR ENDED DECEMBER 31, 2003 Sales $1,500,000 Cost of sales 450,000 Gross profit $1,050,000 Selling expenses $593,000* Administrative expenses 94,000** Total selling and administrative expenses $687,000 Net income $363,000 *$398,000 + $175,000 + $20,000 **$54,000 + $40,000 LO 3,5,7 PROBLEM 2-13 CLASSIFIED BALANCE SHEET AND COMBINED MULTIPLE-STEP STATEMENT OF INCOME AND RETAINED EARNINGS FOR KELLOGG’S 1. Kellogg’s Company Income Statement For the Year Ended December 31, 2002 (millions of dollars) Net sales $8,304.1 Cost of goods sold $4,569.0 Selling, general and administrative expense 2,227.0 Operating profit $1,508.1 Interest expense 391.2 Other income, net 27.4 Income before taxes 1,144.3 Income taxes 423.4 Net income $ 720.9
  • 21. CHAPTER 2 FINANCIAL STATEMENTS AND THE ANNUAL REPORT 2-21 2. Kellogg’s Company Statement of Retained Earnings For the Year Ended December 31, 2002 (millions of dollars) Retained earnings, beginning of year $1,564.7 Net income for the year 720.9 Dividends paid (412.6) Retained earnings, end of year $1,873.0 3. Kellogg’s Company Balance Sheet December 31, 2002 ( m i l l i o n s o f d o l l a r s ) Current assets: Cash and cash equivalents $ 100.6 Accounts receivable, net 741.0 Inventories 603.2 Other current assets 318.6 Total current assets $ 1,763.4 Property, net $ 2,840.2 Other assets 5,615.7 Total assets $10,219.3
  • 22. FINANCIAL ACCOUNTING SOLUTIONS MANUAL 2-22 Current liabilities: Current maturities of long-term debt $ 776.4 Notes payable 420.9 Accounts payable 619.0 Other current liabilities 1,198.6 Total current liabilities $ 3,014.9 Long-term debt $ 4,519.4 Other liabilities $ 1,789.9 Shareholders’ equity: Common stock $ 103.8 Capital in excess of par value 49.9 Retained earnings 1,873.0 Treasury stock, at cost (278.2) Accumulated other comprehensive income (853.4) Total shareholders’ equity $ 895.1 Total liabilities and shareholders’ equity $ 10,219.3 LO 4,6 PROBLEM 2-14 USING KELLOGG’S CLASSIFIED BALANCE SHEET AND MULTIPLE-STEP INCOME STATEMENT 1. (All amounts in millions) 2002 Working capital: Current assets – current liabilities $1,763.4 – $3,014.9 = ($1,251.5) 2002 Current ratio: Current assets/current liabilities $1,763.4/$3,014.9 = .58 to 1 2. Kellogg’s does not appear to be very liquid, with a negative working capital and a current ratio of less than 1. Other factors to consider when evaluating liquidity would be the composition of current assets and the due dates of current liabilities. 3. (All amounts in millions) 2002 Gross profit ratio: Gross profit/Net sales $3,735.1/$8,304.1 = 45% 2002 Profit margin ratio: Net income/Net sales $720.9/$8,304.1= 8.7%
  • 23. CHAPTER 2 FINANCIAL STATEMENTS AND THE ANNUAL REPORT 2-23 4. As a stockholder, Kellogg’s gross profit ratio and profit margin ratio appear acceptable. It would be necessary, however, to compare the 2002 ratios to those same ratios for Kellogg’s in past years and to also compare the ratios to other companies within the same industry. LO 1,4,8 PROBLEM 2-15 CASH FLOW Cash available to pay a dividend on December 31, 2004: Cash balance, September 30, 2004 $ 5,000 + Accounts receivable collections 39,406* + Note receivable due on November 1 10,000 + Interest due on November 1: $10,000 X 5% 500 – Cash paid for purchases (15,762)** – Mortgage note payments: 3 months X $1,200 (3,600) – Operating expenses: 3 months X $3,000 (9,000) Cash balance, December 31, 2004 $ 26,544 *September sales collected in October $ 12,500 October sales collected in November: $12,500 X 1.05 13,125 November sales collected in December: $13,125 X 1.05 13,781 Total accounts receivable collections $ 39,406 **September purchases paid for in October $ 5,000 October purchases paid for in November: $13,125 X 40% 5,250 November purchases paid for in December: $13,781 X 40% 5,512 Total payments on account $ 15,762 Note: Because inventory levels are maintained at $75,000, purchases are equal to 40% of sales each month. Conclusion: 50,000 shares of common stock X $.50 per share will require cash of $25,000 to pay the quarterly dividend. With $26,544 of cash available, Franklin will barely be able to meet the dividend payment. Unless one or more of the following actions are successful in increasing the cash balance, management should not recommend the normal quarterly dividend of $.50 per share: • Reduce inventory levels. • Speed up the collection of receivables. • Lengthen the average amount of time taken to pay for purchases of inventory. • Reduce operating expenses. A L T E R N A T E P R O B L E M S
  • 24. FINANCIAL ACCOUNTING SOLUTIONS MANUAL 2-24 LO 2 PROBLEM 2-1A MATERIALITY 1. The pattern of long distance calls might point to alternative long-distance plans with one of the many carriers now in this business. For example, some companies might give a discount for calls made in off-peak hours. The analysis might point to misuse by certain employees (overuse, personal use, etc.), a situation that could be corrected by talking to the employees who are misusing the long distance service. 2. This question deals with the concept of materiality. It would be difficult to decide which of the two types of companies, a realtor or a hardware store, would make more long distance calls. A realtor might make a large number of long distance calls if it deals with out-of-state clients. The hardware store might regularly order inventory from vendors outside of its area code. LO 2 PROBLEM 2-2A COSTS AND EXPENSES 1. Point-of-sale systems in a retail store—The cost associated with these systems is a tangible asset that should be reported in the long-term assets section of the balance sheet and depreciated over the life of the systems; only a portion would be recognized as expense during the current period. 2. Ad in the yellow pages—All of the cost for the ad would normally be expensed in the period the cost is incurred unless there was evidence that the ad would provide benefits for a number of future periods. 3. An inventory control computer software system—Assuming that the software was purchased, an intangible asset should be recognized and a portion of the cost recognized as expense in each of the periods benefited. 4. Shipping merchandise for resale to chain outlets—All of the costs associated with shipping merchandise for resale would normally be recognized as expense when the costs are incurred. Even though one could argue that under the matching principle these costs should be recognized as expense only when the inventory is sold, the practical difficulty in associating shipping costs with specific items sold results in most companies expensing these costs as incurred. LO 3 PROBLEM 2-3A CLASSIFIED BALANCE SHEET 1. Classified balance sheet: SINGER CORPORATION BALANCE SHEET DECEMBER 31, 2004
  • 25. CHAPTER 2 FINANCIAL STATEMENTS AND THE ANNUAL REPORT 2-25 Assets Current assets: Cash $ 60,790 Marketable securities 15,000 Accounts receivable 26,700 Merchandise inventory 112,900 Prepaid rent 3,600 Office supplies 400 Total current assets $ 219,390 Property, plant, and equipment: Land $ 250,000 Buildings $ 150,000 Less: accumulated depreciation 40,000 110,000 Equipment 84,500 Less: accumulated depreciation 12,500 72,000 Total property, plant, and equipment 432,000 Intangible assets Patents 45,000 Total assets $ 696,390 Liabilities Current liabilities: Accounts payable $ 34,280 Income taxes payable 7,500 Interest payable 2,200 Notes payable, due April 15, 2005 6,500 Salaries payable 7,400 Total current liabilities $ 57,880 Long-term debt: Bonds payable, due December 31, 2010 250,000 Total liabilities $ 307,880 Stockholders' Equity Contributed capital: Capital stock, $1 par value, 200,000 shares issued and outstanding $ 200,000 Paid-in capital in excess of par value 75,000 Total contributed capital $ 275,000 Retained earnings 113,510 Total stockholders' equity 388,510 Total liabilities and stockholders' equity $696,390
  • 26. FINANCIAL ACCOUNTING SOLUTIONS MANUAL 2-26 2. Current ratio = Current assets/Current liabilities $219,390/$57,880 = 3.79 to 1 3. From the current ratio alone, Singer appears to be relatively liquid. In fact, Singer may be too liquid, in that its cash balance is greater than its total current liabilities. Singer may be missing significant investment opportunities by maintaining such a large cash balance. To fully assess its liquidity, it would be useful to look more specifically at the activity in inventory and accounts receivable. For example, how long on the average does it take Singer to sell inventory? How long does it take to collect an account receivable? Also, you would want to compare Singer's current ratio at the end of this period with prior periods, and with the current ratio for companies in the same industry. LO 4 PROBLEM 2-4A FINANCIAL STATEMENT RATIOS 1. a. Working capital at 12/31/04: Current assets: $16,500 + $12,750 + $200 + $900 + $400 = $30,750 Current liabilities: $10,500 + $1,800 + $10,000 = $22,300 Working capital = $30,750 – $22,300 = $8,450 Working capital at 12/31/03: Current assets: $26,000 + $11,800 + $1,100 + $250 = $39,150 Current liabilities: $6,500 + $800 + $5,800 = $13,100 Working capital = $39,150 – $13,100 = $26,050 b. Current ratio at 12/31/04: $30,750/$22,300 = 1.38 to 1 Current ratio at 12/31/03: $39,150/$13,100 = 2.99 to 1
  • 27. CHAPTER 2 FINANCIAL STATEMENTS AND THE ANNUAL REPORT 2-27 2. Both the absolute liquidity position of the company and the relative liquidity position of the company have declined during 2004. First, the absolute position, as indicated by the amount of working capital, has decreased from $26,050 to $8,450. The liquidity of the company has also decreased on a relative basis, as is indicated by the decrease in the current ratio from 2.99 to 1.38. The primary reasons for the decline in the company's liquidity are the significant increases in accounts payable and taxes payable, and the decrease in accounts receivable. LO 4 PROBLEM 2-5A WORKING CAPITAL AND CURRENT RATIO 1. Current ratio = Current assets/Current liabilities ($23,000 + $43,000 + $75,000 + $2,800)/($84,900 + $3,200) = $143,800/$88,100 = 1.63 to 1 Working capital = Current assets – Current liabilities = $143,800 – $88,100 = $55,700 2. Even though Kapinski has a current ratio that is over 1 to 1, it may experience trouble paying its bills, specifically its accounts payable. This depends on two factors: (1) how long it normally takes to collect accounts receivable and (2) the normal length of time to sell inventory. In addition, the company must be concerned whether any portion of the accounts receivable may prove to be uncollectible and whether any portion of the inventory is not saleable. 3. Three things Kapinski might be able to do to help it pay its bills on time: a. Decrease the average collection period for accounts receivable. b. Negotiate with suppliers to increase the time Kapinski is given to pay for its accounts payable. c. Reduce its inventory levels. LO 5 PROBLEM 2-6A SINGLE-STEP INCOME STATEMENT 1. Single-step income statement: CORBIN ENTERPRISES INCOME STATEMENT FOR THE YEAR ENDED DECEMBER 31, 2004 Revenues: Sales revenue $ 350,000 Dividend revenue 2,700 Total revenues $ 352,700
  • 28. FINANCIAL ACCOUNTING SOLUTIONS MANUAL 2-28 Expenses: Cost of goods sold $ 150,000 Wages—office 45,600 Rent—office 26,400 Rent—salesperson's car 18,000 Advertising 9,000 Utilities 6,750 Depreciation—computer 4,500 Interest 1,900 Supplies expense—office 1,300 Income tax 30,700 Total expenses 294,150 Net income $ 58,550 2. A single-step income statement does not lend itself as readily to analysis as does a multiple-step statement. For example, with a single-step statement, gross profit must first be computed before the gross profit ratio can be determined. In addition, the lack of any type of grouping of the various expenses makes any type of analysis more difficult. LO 5 PROBLEM 2-7A MULTIPLE-STEP INCOME STATEMENT 1. Multiple-step income statement: CORBIN ENTERPRISES INCOME STATEMENT FOR THE YEAR ENDED DECEMBER 31, 2004 Sales $ 350,000 Cost of goods sold 150,000 Gross profit $ 200,000 Operating expenses: Selling expenses: Advertising $ 9,000 Rent—salesperson’s car 18,000 Total selling expense $ 27,000 General and administrative expenses: Depreciation—computer $ 4,500 Rent—office 26,400 Supplies—office 1,300 Wages—office 45,600
  • 29. CHAPTER 2 FINANCIAL STATEMENTS AND THE ANNUAL REPORT 2-29 Utilities 6,750 Total general and administrative expense 84,550 Total operating expense 111,550 Income from operations $ 88,450 Other revenues and expenses: Interest expense $ 1,900 Dividend revenue 2,700 Excess of other revenues over other expenses 800 Income before taxes $ 89,250 Income tax expense 30,700 Net income $ 58,550 2. Gross profit ratio = Gross profit/Sales revenue = $200,000/$350,000 = 57.1%
  • 30. FINANCIAL ACCOUNTING SOLUTIONS MANUAL 2-30 3. The gross profit ratio tells the reader of the income statement that for every $1 of sales Corbin spends 1 – .571, or 42.9 cents, for its products. The ratio of gross profit to cost of sales, or markup on cost, is 57.1/42.9, or 133%. LO 6 PROBLEM 2-8A SAKS’ GROSS PROFIT RATIO 1. A retailer, such as Saks, generates most of its revenue during the holiday season. By waiting until the end of January, Saks can include returns and adjustments pertaining to the holiday shopping season. It can also take advantage of the slower January season to focus on its fiscal year-end procedures. 2. (In thousands) (Sales – Cost of goods sold)/Sales = Gross profit/Sales 2002: ($5,911,122 – $3,739,247)/$5,911,122 = 36.7% 2001: ($6,070,568 – $3,960,129)/$6,070,568 = 34.8% 2000: ($6,581,236 – $4,211,707)/$6,581,236 = 36.0% 3. Saks’ gross profit ratio decreased in 2001, but increased in 2002. Changes in the gross profit ratio can be a result of changes in selling price, costs, or the mix of products sold. LO 8 PROBLEM 2-9A STATEMENT OF CASH FLOWS 1. WISCONSIN CORPORATION STATEMENT OF CASH FLOWS FOR THE YEAR ENDED DECEMBER 31, 2004 Cash flows from operating activities: Cash collected from customers $ 310,000 Cash paid for inventory (185,000) Cash paid in salaries and wages (30,100) Cash paid in taxes (40,000) Net cash provided by operating activities $ 54,900* Cash flows from investing activities: Purchase of manufacturing facility (150,000) Cash flows from financing activities: Proceeds from issuance of stock $ 400,000 Proceeds from long-term note 50,000 Dividends declared and paid (4,000) Net cash provided by financing activities 446,000 Net increase in cash $ 350,900 Cash at beginning of year 0 Cash at end of year $ 350,900
  • 31. CHAPTER 2 FINANCIAL STATEMENTS AND THE ANNUAL REPORT 2-31 Note: Wisconsin should report one significant noncash activity as supplementary information to its statement of cash flows: the five-year, $150,000 note signed to finance the purchase of the manufacturing facility. 2. First, the statement of cash flows reports on operations on a cash basis, as opposed to the income statement which is prepared on an accrual basis. Second, investing and financing activities are also reported on a statement of cash flows. For example, information about dividends paid during the year are shown on a statement of cash flows but not on an income statement. LO 9 PROBLEM 2-10A BASIC ELEMENTS OF FINANCIAL REPORTS Letter from the President to Stockholders of Thesaurus Inc.: Thesaurus, Inc. has just completed another very successful year. The decrease in net income from 2003 to 2004 was due to a single, nonrecurring gain in 2003, a $400,000 gain on the sale of a subsidiary in that year. A comparison of the operating income of the two years shows a distinct improvement, from $100,000 in 2003 to $380,000 in 2004. All signs point to a successful year just completed. Our gross profit ratio increased to 50% from 40% in the prior year. Similarly, we were able to control our operating expenses: operating income as a percentage of sales increased from 20% to 38%. These are clear signals that Thesaurus is moving in the right direction and should have a solid year of operations in 2005. ALTERNATE MULTI-CONCEPT PROBLEMS LO 2,4 PROBLEM 2-11A COMPARING GATEWAY AND DELL 1. Current assets – Current liabilities = Working capital (In thousands for Gateway and millions for Dell) Gateway: ($197,817 + $465,603 + $88,761 + $602,073 + $601,118) – ($278,609 + $364,741 + $56,684 + $240,315) = $1,955,372 – $940,349 = $1,015,023 Dell: ($2,586 + $4,232 + $306 + $1,394 + $406) – ($5,989 + $2,944) = $8,924 – $8,933 = $(9) Gateway: $1,955,372/$940,349 = 2.08:1 Dell: $8,924/$8,933 = 1.00:1
  • 32. FINANCIAL ACCOUNTING SOLUTIONS MANUAL 2-32 2. Based on both the amount of working capital and the current ratio, Gateway appears to be more liquid than Dell. Dell’s working capital is negative, meaning that it has more current liabilities than it does current assets. The difference is minimal, however, resulting in a current ratio that is 1.00 to 1 when rounded. 3. Gateway’s cash and cash equivalents make up 24% of its total current assets and marketable securities comprise another 31% of the total. Thus, these very liquid assets together make up 55% of Gateway’s current assets. Those same categories, cash and short-term investments, are 47% and 5% respectively of Dell’s current assets. For Dell, these two most liquid assets make up 52% of current assets. Therefore, even though Dell does not appear as liquid as Gateway, it does have a slightly higher percentage of its current assets in cash and marketable securities. LO 2,5 PROBLEM 2-12A COMPARABILITY AND CONSISTENCY IN INCOME STATEMENTS 1. The income statements for both years are in single-step form. 2. Income statement items as a percentage of sales: 2004 2003 Sales 100.0% 100.0% Cost of sales 36.0 30.0 Sales salaries 25.1 26.5 Delivery expense 10.6 11.7 Office supplies 3.2 3.6 Depreciation—truck 2.4 2.7 Computer line expense 1.4 1.3 Total expenses 78.7 75.8 Net income 21.3% 24.2% Restating each item on the income statement as a percentage of sales allows the reader to better understand how successful a business was in controlling costs. For example, Chisholm Company increased its sales by $200,000 for the year, but this did not translate to an increase in the bottom line, i.e., net income. The restatement of each of the expenses as a percentage of sales reveals why net income did not increase. Total expenses, as a percentage of sales, increased from 75.8% to 78.7%. Aside from a slight increase in one of the minor expenses, computer lines, only one expense increased as a percentage of sales. The one increase, however, was the primary reason for the increase in expenses as a percentage of sales: the cost of Chisholm’s products increased from 30% to 36% of sales.
  • 33. CHAPTER 2 FINANCIAL STATEMENTS AND THE ANNUAL REPORT 2-33 LO 3,5,7 PROBLEM 2-13A CLASSIFIED BALANCE SHEET, MULTIPLE-STEP INCOME STATEMENT, AND STATEMENT OF RETAINED EARNINGS FOR WALGREENS 1. Walgreen Co. Income Statement For the Year Ended August 31, 2002 (millions of dollars) Net sales $28,681.1 Cost of sales $21,076.1 Selling, occupancy and administration 5,980.8 Operating profit $1,624.2 Interest income 6.9 Other income 6.2 Income before taxes $1,637.3 Income tax provision 618.1 Net income $1,019.2 2. Walgreen Co. Statement of Retained Earnings For the Year Ended August 31, 2002 (millions of dollars) Retained earnings, beginning of year $4,530.9 Net income for the year 1,019.2 Dividends declared (148.4) Retained earnings, end of year $5,401.7
  • 34. FINANCIAL ACCOUNTING SOLUTIONS MANUAL 2-34 3. Walgreen Co. Balance Sheet August 31, 2002 (millions of dollars) Current assets: Cash and cash equivalents $449.9 Accounts receivable, net 954.8 Inventories 3,645.2 Other current assets 116.6 Total current assets $5,166.5 Property and equipment, at cost $4,591.4 Other non-current assets 120.9 Total assets $9,878.8 Current liabilities: Trade accounts payable $1,836.4 Accrued expenses and other liabilities 1,017.9 Income taxes 100.9 Total current liabilities $2,955.2 Deferred income taxes $176.5 Other non-current liabilities 516.9 Total non-current liabilities $693.4 Shareholders’ equity: Common stock $80.1 Paid-in capital 748.4 Retained earnings 5,401.7 Total shareholders’ equity 6,230.2 Total liabilities and shareholders’ equity $9,878.8
  • 35. CHAPTER 2 FINANCIAL STATEMENTS AND THE ANNUAL REPORT 2-35 LO 4,6 PROBLEM 2-14A USING WALGREENS’ CLASSIFIED BALANCE SHEET AND MULTIPLE-STEP INCOME STATEMENT 1. (All amounts in millions) 2002 Working capital: Current assets – current liabilities $5,166.5 – $2,955.2 = $2,211.3 2002 Current ratio: Current assets/current liabilities $5,166.5/$2,955.2 = 1.7 to 1 2. Walgreens appears to be fairly liquid, with a positive working capital and a current ratio of 1.7 to 1. Other factors to consider when evaluating liquidity would be composition of current assets and the due dates of current liabilities. 3. (All amounts in millions) 2002 Gross profit ratio: Gross profit/Net sales $7,605.0/$28,681.1 = 26.5% 2002 Profit margin: Net income/Net sales $1,019.2/28,681.1 = 3.6% 4. As a stockholder, Walgreens’ gross profit ratio and profit margin appear acceptable. It would be necessary, however, to compare the 2002 ratios to those same ratios for Walgreens in past years and to also compare the ratios to other companies within the same industry. LO 1,4,8 PROBLEM 2-15A CASH FLOW Cash available to pay a dividend on December 31, 2004: Cash balance, December 1, 2004 $ 15,000 + Cash collections from November 2004 sales 40,000* – Operating expenses (10,000) – Payroll: 2 X $4,500 (9,000) Cash balance, December 31, 2004 $ 36,000 *Accounts receivable balance on December 1. Conclusion: Roosevelt has $50,000 par value of stock, with the par value of each share set at $2. Thus, there are 25,000 shares of stock outstanding. At $1 per share in dividends, $25,000 in cash will be needed to meet the annual dividend payment. On the surface, it appears that Roosevelt should have no trouble in paying its annual dividend—the above analysis indicates a December 31, 2004, cash balance of $36,000. However, the $30,000 note payable, along with six months’ interest of $450 (30,000 X 3% X 6/12), will be due two weeks into
  • 36. FINANCIAL ACCOUNTING SOLUTIONS MANUAL 2-36 the new year (January 15, 2005). If we assume that accounts receivable are collected relatively evenly over the month, the balance available to repay the $30,000 note and interest on January 15, 2005, would be only $29,000: December sales $40,000 X 95% $38,000 – Unearned revenue already collected (2,000) December sales collected in January $36,000 Divided by 2 (assuming receivables are collected ratably over the month) ÷ 2 Cash available on January 15 from December sales $18,000 + Cash available, December 31, 2004 36,000 – Dividend payment (25,000) Cash available to repay note and interest $29,000 Conclusion: Roosevelt should not declare its normal annual dividend of $1 per share. C A S E S READING AND INTERPRETING FINANCIAL STATEMENTS LO 3 DECISION CASE 2-1 BOEING’S OPERATING CYCLE 1. Boeing’s inventory would consist of raw materials to produce aircraft, partially completely aircraft and finished aircraft not yet delivered. The cost of these inventories would not only include physical components, but would also include labor costs and other production costs. 2. Because of the long-term nature of aircraft production, aircraft may not be completed within one year. 3. The current classification for assets is defined as “assets that are reasonably expected to be realized in cash or sold or consumed during the normal operating cycle of a business or within one year if the operating cycle is shorter than one year.” Boeing’s operating cycle is probably longer than one year in duration. Thus, its inventories are classified as current since they will be sold during the operating cycle even though it is longer than one year. LO 4 DECISION CASE 2-2 COMPARING TWO COMPANIES IN THE SAME INDUSTRY: WINNEBAGO INDUSTRIES AND MONACO COACH CORPORATION (All amounts in thousands) 1. Winnebago Industries: 8/31/02 Working capital: $233,596 – $88,601 = $144,995 8/25/01 Working capital: $254,256 – $80,008 = $174,248 Change in working capital: $144,995 – $174,248 =($29,253)
  • 37. CHAPTER 2 FINANCIAL STATEMENTS AND THE ANNUAL REPORT 2-37 Monaco Coach Corporation: 12/28/02 Working capital: $356,130 – $241,889 = $114,241 12/29/01 Working capital: $239,350 – $175,656 = $63,694 Change in working capital: $114,241 – $63,694 = $50,547 2. Winnebago Industries: 8/31/02 Current ratio: $233,596/$88,601 = 2.6 : 1 8/25/01 Current ratio: $254,256/$80,008 = 3.2 : 1 Percentage change in ratio: (2.6 – 3.2)/3.2 = 19% decrease Monaco Coach Corporation: 12/28/02 Current ratio: $356,130/$241,889 = 1.5 : 1 12/29/01 Current ratio: $239,350/$175,656 = 1.4 : 1 Percentage change in ratio: (1.5 – 1.4)/1.4 = 7% increase 3. Cash and cash equivalents is a significant percentage of the total current assets for Winnebago Industries while Monaco Coach Corporation does not report any cash on its balance sheet. For both companies, inventories make up nearly 50 percent of total current assets. 4. Winnebago Industries appears to be more liquid than Monaco Coach Corporation, as measured by the companies’ current ratios. Additionally, Winnebago Industries’ significant cash and cash equivalents make it more liquid than Monaco Coach Corporation. LO 3,4 DECISION CASE 2-3 INTERPRETING MONACO COACH’S INVENTORY 1. 12/28/02 Inventory: $175,609. The amount of inventory has increased from a balance of $127,075 at December 29, 2001. 2. The three components of Monaco Coach’s inventory are raw materials, work-in-process and finished units. 3. The increase in inventory is not necessarily a cause for concern. It may be due to the need to carry more inventory to handle an increase in sales, which in fact Monaco Coach experienced in 2002. Also, the increase may be the result of a decision to keep more inventory on hand to provide more styles and products to its customers. An increases in inventory should however be monitored closely.
  • 38. FINANCIAL ACCOUNTING SOLUTIONS MANUAL 2-38 LO 8 DECISION CASE 2-4 ANALYSIS OF CASH FLOW FOR A SMALL BUSINESS All financial decisions involve a trade-off between risk and return. The offer to work for an investment firm for $40,000 per year may be much less risky than running one's own business. Charles needs to consider, however, how likely it is that the employment with the investment firm will continue indefinitely. For example, could a downswing in the economy cause the firm to cut Charles's position? Charles has experienced for himself the risks and rewards of running a business. To date, the business has not produced significant profits: only $11,500 over a two-year period. However, the significant increase in commissions revenue from one year to the next is very encouraging. This is an example of the potential rewards of running a business. This case also illustrates the difference between income and cash flow. Because depreciation is not a cash flow, there is a significant difference between the cash flow for each of the two years and net income. Assuming that the revenues and all of the expenses other than depreciation result in cash flows of the business, the cash inflow for the first year is $(11,000) + $15,000 (add-back of depreciation) or $4,000. The cash inflow for the second year is even better, after adjusting for depreciation: $22,500 + $15,000, or $37,500. LO 9 DECISION CASE 2-5 FACTORS INVOLVED IN AN INVESTMENT DECISION Sections of the annual report that should be read in comparing investment alternatives: 1. Financial statements, including income statement, balance sheet, statement of stockholders' equity, and statement of cash flows—The statements give an overall picture of the financial position and results of operations of the companies. 2. Notes to the financial statements—The notes are an integral part of the financial statements. They give the reader an indication of the accounting policies used; the various legal obligations, such as those for leases and pension plans; the composition of the long-term assets; and many other details. 3. Managements’ discussion and analysis—This report by management will reveal how management views the year just completed in comparison to prior years and how it feels about the company's prospects in the future. 4. Other information contained in the annual report—This might include descriptions of the company's products and/or services as well as products in development, existing and emerging markets, types of customers, projections, social responsibility, and other non-financial information. As indicated in the case, many fast-food franchisors are owned by large conglomerates. This can make comparisons between these investment
  • 39. CHAPTER 2 FINANCIAL STATEMENTS AND THE ANNUAL REPORT 2-39 alternatives especially difficult, because one large conglomerate may own a totally different set of companies than another. The annual report may or may not contain detailed information on the different businesses owned by the conglomerate. The form 10K filed annually with the SEC should be reviewed for more detailed information than is contained in the annual report to shareholders. The investor may also want to consult various trade publications for insights into the industry. ACCOUNTING AND ETHICS: WHAT WOULD YOU DO? LO 2 DECISION CASE 2-6 THE EXPENDITURE APPROVAL PROCESS The sales rep should be skeptical about Roberto's request for two separate bills for $900 each. If the rep is aware that the request was made to circumvent a corporate policy, it would be unethical of the rep to comply with the request. This certainly puts the rep in a predicament: should he or she risk losing the sale by refusing to write up two separate bills? Roberto is not acting in an ethical manner by requesting two bills, given that it is a deliberate attempt on his part to circumvent corporate policy. He may not agree with the policy, but it is not ethical to devise a scheme to work around the policy. Instead, he should write a memo to the corporate chief financial officer to explain his dissatisfaction with the policy and why it is not appropriate in this particular situation. Whether or not the corporate policy is appropriate is difficult to answer without additional information. At the very least, it seems unreasonable that it should take three weeks for the approval process. LO 4,6 DECISION CASE 2-7 BARBARA APPLIES FOR A LOAN 1. Should Barbara present financial statements to her banker that are incomplete (that make her financial position appear to be better than it actually is)? 2. If the balance sheet is not provided, the banker will not have all the relevant (information useful to the decision process that will allow the user to predict future debt) and reliable information (information that accurately presents the debt of the company) to make a decision. The information provided by Barbara will not be free from bias. It will be biased toward presenting her financial position as better than it is. 3. You should provide the balance sheet to the bank. If the banker does not receive the balance sheet, and makes a decision only based on the income statement, this user of the information will not evaluate the risk of the company correctly. It is unlikely that the banker would consider making the loan on the basis of the quarterly income statements alone. The most recent balance sheet tells the banker about the overall financial strength of the company, and it is an integral part of any loan analysis. As the chief financial officer for the organization, you have a responsibility to provide the
  • 40. FINANCIAL ACCOUNTING SOLUTIONS MANUAL 2-40 banker with the necessary information needed to make an informed decision on the loan. Barbara would rather not show the banker the balance sheet because it would reveal the substantial loan already on the books. You are obligated, however, to provide the balance sheet to the bank if it would be relevant to the bank’s decision. Without it, it is unlikely the bank will make the loan. FROM CONCEPT TO PRACTICE 2.1 The two items that are needed on Winnebago Industries’ income statement to determine its gross profit are “cost of manufactured products” and “revenues from manufactured products.” The gross profit ratios for the two years can be determined by deducting “cost of manufactured products” from “revenues from manufactured products” and dividing the result by “revenues from manufactured products: (all amounts are in thousands of dollars): 2002: $(825,269 - $708,865)/$825,269 = $116,404/$825,269 = 14.1% 2001: $(671,686 – $588,561)/$671,686 = $83,125/$671,686 = 12.4% The gross profit ratio went up in 2002 by (14.1% - 12.4%)/12.4% = 13.7%. Monaco Coach’s gross profit ratios for the two years (all amounts are in thousands of dollars): 2002: $163,129/$1,222,689 = 13.3% 2001: $113,990/$937,073 = 12.2% The gross profit went up in 2002 by (13.3% - 12.2%)/12.2% = 9.0% FROM CONCEPT TO PRACTICE 2.2 Winnebago Industries’ profit margins for the last two years can be determined by dividing net income by total net revenues (all amounts are in thousands of dollars): 2002: $54,671/$828,403 = 6.6% 2001: $42,704/$675,927 = 6.3% The profit margin ratio increased slightly from 2001 to 2002. Monaco Coach’s profit margins for the last two years can be determined by dividing net income by net sales (all amounts are in thousands of dollars): 2002: $44,515/$1,222,689 = 3.6% 2001: $24,919/$937,073 = 2.7% The profit margin ratio increased from 2001 to 2002.
  • 41. CHAPTER 2 FINANCIAL STATEMENTS AND THE ANNUAL REPORT 2-41