Download as PDF, PPTX


![Alternative 2: Direct PDF
13
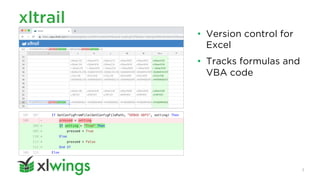
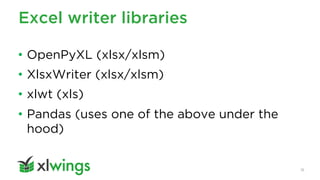
ReportLab is a library to create high quality PDF
reports.
Source: https://www.reportlab.com/docs/reportlab-userguide.pdf
data = [['00', '01', '02', '03', '04’], ['10', '11', '12', '13', '14’],
['20', '21', '22', '23', '24’], ['30', '31', '32', '33', '34’]]
t = Table(data)
t.setStyle(TableStyle([('BACKGROUND', (1, 1), (-2, -2), colors.green),
('TEXTCOLOR', (0, 0), (1, -1), colors.red)]))](https://image.slidesharecdn.com/meetupreporting-200118123641/85/xlwings-reports-Reporting-with-Excel-Python-13-320.jpg)


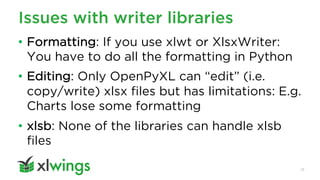


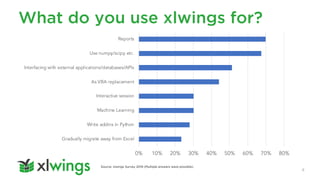
![xlwings: The usual approach
23
wb = xw.Book('template.xlsx')
df = pd.DataFrame(index=['r0', 'r1’],
columns=['c0', 'c1’],
data=[[1, 2], [3, 4]])
wb.sheets["report"]["A1"].value = df](https://image.slidesharecdn.com/meetupreporting-200118123641/85/xlwings-reports-Reporting-with-Excel-Python-23-320.jpg)
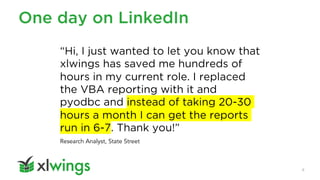
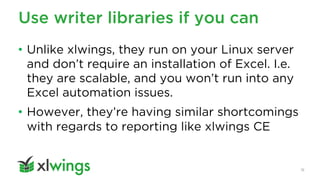
![Issue 1: Template changes cause
code changes
24
wb.sheets["report"]["A1"].value = df
"A3"](https://image.slidesharecdn.com/meetupreporting-200118123641/85/xlwings-reports-Reporting-with-Excel-Python-24-320.jpg)
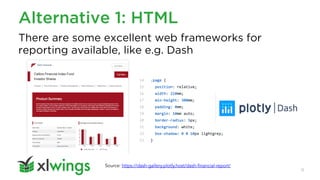
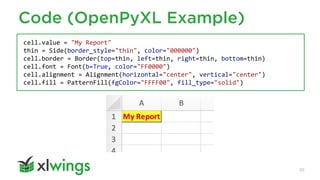
![Idea: Use named ranges
25
wb.sheets["report"]["mytable"].value = df
Pros:
• Moves around with cells
Cons:
• “invisible”
• You may need many for the same variable](https://image.slidesharecdn.com/meetupreporting-200118123641/85/xlwings-reports-Reporting-with-Excel-Python-25-320.jpg)


![Basic syntax
30
from xlwings_reports import create_report
create_report('my_template.xlsx',
'my_report.xlsx',
title='Report',
df=pd.DataFrame(data=[[1, 2], [3, 4]]})](https://image.slidesharecdn.com/meetupreporting-200118123641/85/xlwings-reports-Reporting-with-Excel-Python-30-320.jpg)


The document presents a discussion on reporting solutions using Microsoft Excel and Python, with a focus on the xlwings library. It covers various alternatives to Excel, Excel writer libraries, and the benefits of using xlwings for more efficient reporting. Additionally, the document includes a preview of upcoming meetups related to integrating Python with Excel and deploying xlwings-powered spreadsheets.