2. Lotfi F et al.
Iran Red Crescent Med J. 2014;16(4):e129502
non-friendly and non-professional services, non-reflective
hierarchial organizational structure and lack of function-
based perks. Such a weak management of hospitals may
lead to wasting of the resources (6). Decreasing these bar-
riers in “efficiency” has been proposed as a useful indica-
tor for hospital's performance assessment (7) which is
expressed as the percentage calculated as the ratio of the
total output power to total input power under specified
conditions (8). This indicator for a hospital means that
how this unit is successful in producing maximal output
for a given set of inputs or how they generate the constant
amount of output using minimal resources (7). There are
different techniques assessing this indicator including
hospital performance ratios, Data Envelopment Analysis
(DEA), stochastic frontier analysis (SFA), Pabon lasso and
so on.
Ratio analysis as one of the non parametric technical-
efficiency assessment methods, which includes the sepa-
rate examination of various key measures such as average
cost per inpatient day, bed occupancy rate, average length
of stay, bed turnover ratio and so on (9). But as it is very
difficult to justify hospitals' performances applying many
separate indicators (ratios), three of the most important
are merged as Pabon lasso model. This graphical model
uses three indicators to evaluate the overall performance
of a hospital including: bed occupancy rate (BOR), bed
turn over (BTO) and average length of stay (ALS) (10).
SFA is a parametric linear programming method that
uses an integrated data set considering a special form of
production function for assessing efficiency but because
of some potential challenges, it is suggested to be used
along with other techniques (11). DEA, a non-parametric
linear programming method, was introduced as a supe-
rior method in a report by World Health Organization
in 2003 for measuring efficiency in health systems (12).
And finally, productivity is another mixed index using
Malmquist index as a combination of distance function
and DEA indicating total productivity of a Decision Mak-
ing Unit like hospital (13).
2. Objectives
This study was conducted to present an overview of the
efficiency of all hospitals in Ahvaz (affiliated and nonaffili-
ated with Ahvaz University of Medical Sciences) applying
Pabon Lasso, DEA and Malmquist indicators to compare
similarities and differences between the results obtained
by these methods and suggest the most comprehensive
and practical ones for managers and policy makers.
3. Patients and Methods
This cross sectional study was conducted in all 16 hospi-
tals of Ahvaz (eight affiliated and eight nonaffiliated with
Ahvaz Jundishapur University of Medical Sciences), Ah-
vaz, Iran during 2007 to 2011. All of them were specialized
hospitals. Hospitals No. 1-8 were affiliated with the Jundis-
hapur University of Medical Sciences in Ahvaz and the
rest were nonaffiliated. Two kinds of data were collected
through separate special checklists, one for indicators of
Pabon Lasso and the other for assessing efficiency accord-
ing to DEA and both were designed based on the research
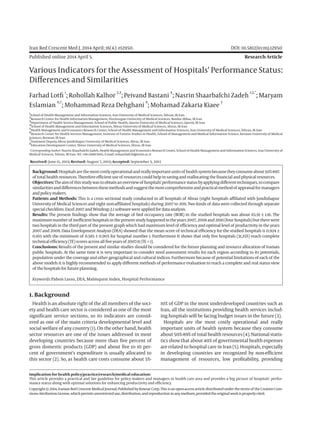
goals. Pabon lasso is a graphical model for demonstrating
hospital performance using three indicators: bed occu-
pancy rate (BOR), bed turnover (BTO) and average length
of stay (ALS). This graph compartmentalizes the hospitals
into four divisions: The first part stands for those hospitals
with low BTO and BOR implying a surplus in hospital beds
against the existing demand, however the second sector
shows the hospitals with high BTO and low BOR which
indicates unnecessary hospitalizations, an oversupply of
beds, or using the hospital beds for simply observing pa-
tients. The third segment indicates those hospitals with
high BTO and BOR that simply means an appropriate level
of efficiency, with relatively few vacant beds at any time
and finally the last category presents the low BTO and high
BOR that may emerge because of admitting patients with
chronic diseases or unnecessarily long ALS (7).
The first checklist included the number of active beds,
number of active bed-days, number of occupied bed-days,
number of discharges and performance data consisting
bed occupancy rate (BOR), bed turn over (BTO), and aver-
age length of stay (ALS). The items of these checklists were
filled for each of the studied years. Data achieved from the
first checklists, was analyzed using Excel 2007 according
to Pabon lasso model for presenting the related graphs.
Then, another checklist was designed for obtaining the
necessary data in order to form an input – oriented DEA
model. Variables were categorized as inputs (number of
physicians, number of nurses, number of other personnel
and number of active beds) and bed occupancy rate num-
ber of patients and number of operations were consid-
ered as outputs. The related data were collected from the
statistic's center of the Jundishapur University of Medical
Sciences and other hospitals for a total of 16 hospitals dur-
ing2007-2011.Windeap2.1softwarewasappliedforfurther
analysis.
4. Results
Three determinant indicators constructing Pabon Lasso
model are presented in Table 1. As this table indicates, the
maximum rate of Bed Occupancy Rate (BOR) belonged to
the year 2011 (66.71 ± 13.81) versus the minimum rate for
the year 2007 (63.86 ± 11.88). Bed turn over (BTO) was in the
highest range in the year 2007 (72.02 ± 58.18) against the
year 2008 with the lowest rate (64.57 ± 39.46). The third
factor was average long of stay (ALS) with the maximum of
17.17 days for the year 2007 versus 10.59 days in 2011 (Table
1). Figure 1 indicates the differences among the studied
hospitals’ status during 2007-2011. As Pabon Lasso graph
implies, there were four hospitals in 2007, 2008 and 2010
in the first zone that represent inefficiency and underuse
of resources in these units, this number decreased to three
hospitals in 2009 and two hospitals in 2011.
3. Lotfi F et al.
3Iran Red Crescent Med J. 2014;16(4):e12950
0
50
100
150
200
0 10 20 30 40 50 60 70 80 90 100
BTO
BOR
2007
16
15
14
13
12
11
10
9
8
7
6
5
4
3
2
1
1
2 3
4
0
50
100
150
200
0 10 20 30 40 50 60 70 80 90 100
BTO
BOR
2008
16
15
14
13
12
11
10 9
8
7
6
5
4
3
2
1
2 3
1 4
0
50
100
150
200
0 10 20 30 40 50 60 70 80 90 100
BTO
BOR
2009
16
15
14
13
12
11
10 9
8
7
6
5
4
3
2
1
2 3
41
0
50
100
150
200
0 10 20 30 40 50 60 70 80 90 100
BTO
BOR
2010
16
15
14
1312
11 10
9
8
7
6
5
4
3
2
1
2
1
3
4
0
50
100
150
200
0 10 20 30 40 50 60 70 80 90 100
BTO
BOR
2011
16
15
14
13
12
11
10
9
8
7
6
5
4
3
2
1
2
1
3
4
A B
C
E
D
Figure 1. Pabon Lasso Graph Indicating the Performance Status of Ahvaz Hospitals in 2007-2011
Table 1. Determinant Ratios for Pabon Lasso Model in the Studied Hospitals During 2007-2011 a
Year BOR BTO ALS
2007 63.86 ± 11.88 72.02 ± 58.18 17.17
2008 66.27 ± 14.87 64.57 ± 39.46 15.12
2009 66.18 ± 13.93 67.36 ± 40.42 13.21
2010 66.51 ± 14.27 66.26 ± 38.67 11.93
2011 66.71 ± 13.81 69.10 ± 39.64 10.59
Mean ± SD 65.91 ± 1.16 67.86 ± 2.85 13.60 ± 2.60
a Data are presented in Mean ± SD.
In contrast, there were only two hospitals in the third
part of the graph which stands for efficiency and opti-
mal level of productivity in the years 2007 and 2009.
This number has been increased to three hospitals in
2008 and 2010, and 4 hospitals in 2011 as fully efficient
units. Another important finding of this graph is that
most of the hospitals were located in the second and the
forth zone during 2007 to 2011 which may be due to un-
4. Lotfi F et al.
Iran Red Crescent Med J. 2014;16(4):e129504
necessary hospitalizations, an oversupply of beds, using
the hospital beds for simply observing patients (second
zone) or admitting chronic patients with unnecessar-
ily long ALS (forth zone)(Figure 1). The average score of
hospitals' technical efficiency is presented in Table 2.
This table indicates that the mean score of technical ef-
ficiency for the studied hospitals is 0.924 ± 0.105 with
the minimum of 0.585 ± 0.905 for hospital number 1. Fur-
thermore It shows that only five hospitals (31.25%) reach
complete technical efficiency scores in all five years dur-
ing 2007-2011 (TE = 1). Another finding extracted from this
table is that 15 hospitals (93.75%) are considered as partly
efficient units if the value of 0.8 is considered as the cut-
off point (Table 2). Other results show that there was a
surplus in the studied hospitals' inputs as follows: in the
years 2011, 2009 and 2008 only 1 hospital showed input
surplus (hospitals No. 6, 1 and 10, respectively), in the
year 2010, two units (hospitals number 1 and 12) and in
the year 2007, four hospitals had input surplus (No. 1, 6,
7, 14). Table 3 implies that a decrease of 6.42% in the num-
ber of active beds (13 beds), 7.04% of nurses (seven nurs-
es), 5.67% of physicians (four physicians) and 4.28% of all
other personnel (13 other personnel) throughout all the
studied hospitals in the above period may lead to achieve
full efficiency (Table 3). The average productivity regard-
ing total factors in the studied hospitals using Malmquist
index was 0.983. In addition it was shown that there was
an incremental trend in productivity during the studied
years with the increase rate of 0.017. The average change
in the technical efficiency was reported to be 1.002 and
the average rate of technological changes was 0.981. Fur-
thermore, pure average of technical efficiency (manage-
rial) was 1.01 and finally the average of scale efficiency was
0.992 (Table 4). Table 5 shows that the rate of changes in
the productivity according to Malmquist index among
the studied hospitals was reported between "0.854 to
1.168". Hospital number 2 was presented as the best and
hospital number 14 was had the worst performance level
considering the rate of productivity change. In addition,
the average of total factors’ contributing to productivity
change among the studied years was less than 1 except
the year 2008 that shows an increment in productivity.
It is also stated that, the increase was the highest order in
2011 with the average of 0.932 (Table 4).
Table 2. Ranking of the Studied Hospitals' Technical Efficiency Applying DEA a
Hospital 2007 2008 2009 2010 2011 Mean ± SD
5 1 1 1 1 1 1 ± 0.00
8 1 1 1 1 1 1 ± 0.00
9 1 1 1 1 1 1 ± 0.00
13 1 1 1 1 1 1 ± 0.00
15 1 1 1 1 1 1 ± 0.00
16 0.939 1 1 1 1 0. ± 0.024
4 1 1 1 0.934 1 0. ± .026
12 1 1 0.979 0.824 1 0. ± 0.068
2 1 1 1 1 0.794 0.959 ± 0.082
6 0.946 1 1 1 0.687 0.927± 0.121
14 0.642 0.848 0.926 1 1 0.883 ± 0.133
7 0.801 0.92 0.922 0.895 0.864 0. ± 0.044
11 1 1 0.604 0.79 0.995 0.878 ± 0.158
10 1 0.875 0.708 0.831 0.961 0 ± 0.102
3 0.951 0.854 0.788 0.756 0.926 0.855 ± 0.075
1 0.462 0.745 0.54 0.627 0.552 0.585 ± 0.095
Mean ± SD 0 ± 0.156 0.953 ± 0.079 0.904 ± 0.155 0 ± 0.116 0 ± 0.135 0.924 ± 0.105
a Data are presented in Mean ± SD.
Table 3. The average of Studied Hospitals’ Input Surplus During 2007-11
Mean Number of Active Beds Nurses Physicians Other Personnels
Primary Amounts 199 96 64 293
Optimal Amounts 186 90 61 280
Surplus 13 7 4 13
Surplus, % 6.42 7.04 5.67 4.28
5. Lotfi F et al.
5Iran Red Crescent Med J. 2014;16(4):e12950
Table 4. Malmquist Index for total Productivity and Total Efficiency During 2008-11 a
Year Technical Efficiency,
Effch
Technological Efficiency,
Techch
Managerial Efficiency,
Pech
Scale Efficiency, Sech Total Productivity
Changes, Tfpch
2008 1.05 0.973 1.06 0.99 1.021
2009 0.936 1.062 0.975 0.96 0.994
2010 1.022 0.966 1.019 1.003 0.987
2011 1.005 0.928 0.989 1.016 0.932
Mean 1.002 0.981 1.01 0.992 0.983
a Abbreviations: Effch, technical efficiency change; Techch, technological change; Pech, pure technical efficiency change; Sech, scale efficiency change;
Tfpch, total factor productivity change.
Table 5. MalmquistIndex for Total Productivity and Total Efficiency in the Hospitals
Hospital Technical Efficiency
Change
Technological
Change
Pure Technical Efficiency
Change
Scale Efficiency
Change
Total Factor Productivity
Change
1 1.046 0.94 1.193 0.876 0.983
2 0.944 0.904 1 0.944 0.854
3 0.993 1.013 1 0.993 1.006
4 1 0.896 1 1 0.896
5 1 0.985 1 1 0.985
6 0.923 0.974 0.942 0.98 0.9
7 1.019 0.992 1.015 1.004 1.011
8 1 0.887 1 1 0.887
9 1 1.087 1 1 1.087
10 0.99 1.002 1 0.99 0.992
11 0.999 1.043 1 0.999 1.042
12 1 0.899 1 1 0.899
13 1 0.953 1 1 0.953
14 1.117 1.046 1.031 1.084 1.168
15 1 1.078 1 1 1.078
16 1.016 1.028 1 1.016 1.045
Mean 1.002 0.981 1.01 0.992 0.983
5. Discussion
Being aware of the hospitals’ performance and efficiency
is one of the major concerns of health policy makers and
health care manager’, although applying a unique scien-
tific technique for hospital performance evaluation, effi-
ciency estimation and determination of the effective fac-
tors has not been achieved yet. All the above methods have
their own restrictions alongside their strengths, for exam-
pledespiteDEA’sadvantagesincalculatingtherelativeand
not absolute efficiency and incorporating multiple input
and output factors and also determining optimum level
of practice and performance targets (14), there are some
noticeable limitations attributed to this method such as
eliminating some significant variables and the effect of
outliers and missing data (8), where all can lead to wrong
estimations of efficiency and performance status (15).
Even though Pabon Lasso gives an instant picture of the
hospital, its related indices may be influenced by differ-
ent factors that cannot be calculated applying this sim-
ple model (16). Considering all the above statements, it
is inevitable to design multi method studies such as the
present one applying different assessment tools to dem-
onstrate a complete and valid picture of the hospitals'
efficiency. The present findings show that the average of
BOR by the studied hospitals was about 65.91% which is
higher than Iran's national average (57.8%) (17).
Moreover, the maximum number of inefficient hospi-
tals in the present study belonged to the years 2007 and
2008 (four hospitals) in contrast with another study on
Ahvaz University of Medical Sciences hospitals demon-
strating that two hospitals were situated in the first zone
6. Lotfi F et al.
Iran Red Crescent Med J. 2014;16(4):e129506
in the year 2009 (18). Furthermore, there were only two
hospitals in the third part of the present graph which
stands for efficiency and optimal level of productivity in
the years 2007 and 2009. This number has been increased
to three hospitals in 2008 and 2010 and four in 2011 as
fully efficient units but Zahiri shows that there were 10
hospitals in the third zone in the year 2009 (18).
These differences can be justified by the fact that the
present study only included 16 hospitals in Ahvaz but Za-
hiri (18) included all the 26 educational and non educa-
tional hospitals in khoozestan state that were affiliated to
Ahvaz University. Present findings also indicate that the
mean score of technical efficiency for the studied hospi-
tals was 0.924 with the minimum of 0.585 for hospital
number 1. Furthermore it shows that only 5 hospitals
(31.25%) reach complete scale efficiency scores in all five
years during 2007-2011 (TE = 1). Fifteen hospitals (93.75%)
are considered as partly efficient units considering 0.8
as a cutoff point. Another study performed on Shahid
Behshti University of Medical Sciences hospitals showed
that the range within the efficient hospitals varied from
0.878 to 0.993 considering 0.8 as an efficiency cut point.
The mean efficiency of these hospitals in 2010 was 0.914
in a way that except five hospitals (21.7%) that were fully
efficient in technical efficiency, the others (87.3%) could
not gain complete technical efficiency scores (TE = 1) (7).
This study like other studies performed in Iran showed
that there was a surplus in the studied hospitals’ inputs (
number of personnel, nurses, physicians and beds) in the
hospitals affiliated with the medical governmental uni-
versities (12). It is obvious that these governmental units
do not pay enough attention to the staffing plans because
the government pays the staff’s salary. A lack of delicate
planning for the number of active beds is also recogniz-
able in these hospitals which is not proportional to the
population under their coverage.
This finding are justified applying Malmquist index that
showed hospital number 2 was presented as the best and
hospital number 14 was achieved the worst performance
level considering the rate of change in the productivity.
So it is recommended to consider the the present results
and results of similar studies for the future planning and
resource allocation of hospitals. At the same time it is
very important to consider need assessment results for
each region according to its potentials, population un-
der coverage and other geographical and cultural indi-
ces. Furthermore because of potential limitations of each
of the above models it is highly recommended to apply
different methods of performance evaluation together to
reach a complete view of the real status of the hospitals
for future planning.
Acknowledgements
The authors would like to express their special thanks
to the Treatment Deputy of Ahvaz Jundishapur University
of Medical Sciences and other hospitals' managers for
delivering hospitals' data and also School of Health Man-
agement and Information Sciences of Iran University of
Medical Sciences for its electronic library and Ph.D. site.
Authors’ Contribution
The first and the corresponding authors had the main
roles in designing the study and statistical analysis, the
five others contributed to data collection and writing the
preliminary draft of the manuscript.
Financial Disclosure
There was no conflict of interest.
Funding/Support
This article has been conducted with the logistical sup-
port of Ahvaz University of Medical sciences but there
was no other financial support.
References
1. Abolhallaje M, Ramezanian M, Abolhasani N, Salarian Zade H,
Hamidi H, Bastani P. Iranian Health Financing System: Challeng-
es and Opportunities. World Appl Sci J. 2013;22(5):662–6.
2. Abolhallaje M, Bastani P, Monazam K, Abolhasani N, Ramezanian
M. Health System Financing from Experts` Point of View. Middle-
East J Sci Res. 2012;12(10):1386–90.
3. Hasani SA, Abolhalaj M, Behmaneshnia M, Bastani P, Ramezanian
M, Najafi B, et al. Specific Revenue of Iranian Medical Science Uni-
versitiesWithin 2001-2010. World Appl Sci J. 2013;22(4):479–84.
4. Abdullah MT, Shaw J. A review of the experience of hospital au-
tonomy in Pakistan. Int J Health Plann Manage. 2007;22(1):45–62.
5. Raeisi AR, Yarmohammadian MH, Bakhsh RM, Gangi H. Perfor-
mance evaluation of Al-Zahra academic medical center based
on Iran balanced scorecard model. J Educ Health Promot. 2012;1:1.
6. Hassani S, Abolhallaje M, Inanlo S, Hosseini H, Pourmohammadi
K, Bastani P, et al. Allocation of health resources according to
the type and size of Iranian governmental hospitals. Iran J Public
Health. 2013;42(Supple1):166–73.
7. Marnani AB, Sadeghifar J, Pourmohammadi K, Mostafaie D, Abol-
halaj M, Bastani P. Performance assessment indicators: How DEA
and Pabon Lasso describe Iranian hospitals' performance. Health
MED. 2012;6(7):791–6.
8. Kengil BC, Cokmen N, Tozan H. Efficiency measures in the health
services with DEA- An overview. J Naval Sci Engin. 2010;6(1):1–14.
9. Duma O. Assessment of some performance indicators of medical
departments in tertiary hospitals. Rev Med Chir Soc Med Nat Iasi.
2004;108(3):679–84.
10. Mohammadkarim B, Jamil S, Pejman H, Seyyed MH, Mostafa
N. Combining multiple indicators to assess hospital perfor-
mance in Iran using the Pabon Lasso Model. Australas Med J.
2011;4(4):175–9.
11. Talukder MN, Rob U, Mahabub-Ul-Anwar M. Lessons learned from
health sector reform: a four-country comparison. Int Q Commu-
nity Health Educ. 2007;28(2):153–64.
12. Hatam N, Pourmohammadi K, Keshtkaran A, Javanbakht
M, Askarian M. Factors affecting efficiency of social security
hospitals in Iran: Data Envelopment Analysis. Health MED.
2012;6(6):1961–8.
13. Roos P, editor. Measurement of productivity in hospital services
using Malmquist Index approaches: a discussion of methods
and illustration to eye surgery. CSLS Conference on Service Sector
Productivity and the Productivity Paradox. 1997; Canada.
14. Kontodimopoulos N, Niakas D. Efficiency measurement of he-
modialysis units in Greece with data envelopment analysis.
Health Policy. 2005;71(2):195–204.
15. Ozgen H, Sahin I. Measurement of efficiency of the dialysis sec-
7. Lotfi F et al.
7Iran Red Crescent Med J. 2014;16(4):e12950
tor in Turkey using data envelopment analysis. Health Policy.
2010;95(2-3):185–93.
16. Thomas S, Normand C, Smith S. Social health insurance: further
options for Ireland.Ireland: TCD and published by the Adelaide
Hospital Society; 2008.
17. Abolhalaj M, Hosainy-Parsa SH, Jafari-Sirizi M, Inalou S. [A situ-
ational analysis of human resources in Iranian hospitals affili-
ated with ministry of health in 2008]. J Shahrekord Univ Med Sci.
2010;12(1):60–8.
18. Zahiri M, Kilid Dar I. [Performance evaluating in hospitals af-
filiated in Ahwaz University of Medical Sciences based on Pabon
Lasso model]. Hospital. 2012;3(42):37–44.