SlideShare a Scribd company logo
1 of 46
Download to read offline
Firm: Kroger
Kroger
2008 2009 2010 2011 2012
Totals
Company-operated: 4,599 4,599 4,706 4,747 4,788
store growth
Total stores opened (150) - 107 41 41
store growth 1,900,000
capital expenditure
Capital Expenditures on New Stores:
2008 2009 2010 2011 2012
CAPEX: $ 396.8
PPE: $23,900.0 $25,673.0 $26,716.0 $28,071.0 $29,370.0
New Company-
operated Stores 4,599 4,706 4,747 4,788
Additional CAPEX Requirements: equirements:
(store refurbishments, and other)ts, and other)
Property, Plant and Equipment and Depreciation
Actual
2007 2008 2009 2010 2011 2012
PP&E: $23,900.0 $25,673.0 $26,716.0 $28,071.0 $29,370.0
Accum. Deprec. $10,739.0 $11,744.0 $12,569.0 $13,088.0 $14,051.0
PP&E - net $ 12,498.00 $13,161.0 $13,929.0 $14,147.0 $14,983.0 $15,319.0
CAPEX Forecasts from above:
Depreciation Expense: $ 1,355.00 $ 1,443.00 $ 1,525.00 $ 1,600.00 $ 1,638.00 $ 1,652.00
PP&E in place at end of 2012: $ 15,319.0
Remaining balance to be depreciated.
PP&E Purchases:
Capex 2012 455.7
Capex 2013 515.2
Capex 2014 572.3
Capex 2015 624.5
Capex 2016 681.4
Capex 2017 743.6
Capex 2018 811.5
Capex 2019 885.6
Capex 2020 966.6
Capex 2021 1055.1
Capex 2022 0.0
Total Depreciation Expense
2008 2009 2010 2011 2012
Depreciation methods:
Gross PPE $ 23,900 $ 25,673 $ 26,716 $ 28,071 $ 29,370
Depreciable PPE $ 5,365 $ 25,496 $ 26,484 $ 27,899 $ 29,060
Average Depreciable PPE $ 15,430 $ 25,990 $ 27,192 $ 28,479
Depreciation Expense $1,525.0 $1,600.0 $1,638.0 $1,652.0
Implied Average Useful Life in Years 10.1 16.2 16.6 17.2
Forecasts: Numbers of Stores
2013 2014 2015 2016 2017 2018 2019 2020 2021 2022
4,828 4,868 4,908 4,948 4,988 5,028 5,068 5,108 5,148 5,188
0.84% 0.83% 0.82% 0.81% 0.81% 0.80% 0.80% 0.79% 0.78% 0.78%
40 40 40 40 40 40 40 40 40 40
0.84% 0.83% 0.82% 0.81% 0.81% 0.80% 0.80% 0.79% 0.78% 0.78%
2,200,000 2,508,000 2,808,960 3,089,856 3,398,842 3,738,726 4,112,598 4,523,858 4,976,244 5,473,868
16% 14% 12% 10% 10% 10% 10% 10% 10% 10%
CAPEX Forecasts:
2013 2014 2015 2016 2017 2018 2019 2020 2021 2022
$455.7 $515.2 $572.3 $624.5 $681.4 $743.6 $811.5 $885.6 $966.6 $1,055.1
4,828 4,868 4,908 4,948 4,988 5,028 5,068 5,108 5,148 5,188
CAPEX Inflation Forecast:
3% 3% 3% 3% 3% 3% 3% 3% 3% 3%
*assume they refurbish each store every __ years and it costs 25% of original build-out
Property, Plant and Equipment and Depreciation Forecasts:
Forecast:
2013 2014 2015 2016 2017 2018 2019 2020 2021 2022 2023
29825.7 30340.9 30913.2 31537.7 32219.1 32962.6 33774.1 34659.8 35626.4 36681.5 37782.0
12320.9 10560.9 8767.7 6938.3 -1731.3 -1939.7 -2195.1 -2502.0 -2864.9 -3289.0 -3387.7
42146.6 40901.8 39680.9 38476.0 30487.8 31023.0 31579.0 32157.8 32761.5 33392.5 0.0
455.7 515.2 572.3 624.5 681.4 743.6 811.5 885.6 966.6 1055.1 0.0
1703.7 1703.7 1703.7 1703.7 8504.3 0.0 0.0 0.0 0.0 0.0 0.0
13615.3 11911.7 10208.0 8504.3 0.0 0.0 0.0 0.0 0.0 0.0 0.0
26.4 26.4 26.4 26.4 26.4 26.4 26.4 26.4 26.4 26.4 26.4
29.9 29.9 29.9 29.9 29.9 29.9 29.9 29.9 29.9 29.9
33.2 33.2 33.2 33.2 33.2 33.2 33.2 33.2 33.2
36.2 36.2 36.2 36.2 36.2 36.2 36.2 36.2
39.5 39.5 39.5 39.5 39.5 39.5 39.5
43.1 43.1 43.1 43.1 43.1 43.1
47.1 47.1 47.1 47.1 47.1
51.4 51.4 51.4 51.4
56.1 56.1 56.1
61.2 61.2
0.0
1730.1 1760.0 1793.2 1829.4 8669.6 208.4 255.5 306.8 362.9 424.1 98.7
98.7
3%
(remove land and work in progress)
15319.0
290.8
17.6 316.5
33.2 19.6 351.6
36.2 36.2 21.4 383.6
39.5 39.5 39.5 23.3 418.6
43.1 43.1 43.1 43.1 25.4 456.8
47.1 47.1 47.1 47.1 47.1 27.7 498.5
51.4 51.4 51.4 51.4 51.4 51.4 30.3 544.0
56.1 56.1 56.1 56.1 56.1 56.1 56.1 33.1 593.8
61.2 61.2 61.2 61.2 61.2 61.2 61.2 61.2 36.1 648.1
0.0 0.0 0.0 0.0 0.0 0.0 0.0 0.0 0.0 0.0
assumption for long run growth rate
Firm: Kroger
Kroger: Income Statement Forecasts
Actual Forecasts
(Thousands) 2012 2013 2014 2015 2016 2017
Total net revenues $ 96,751.00 $100,621.0 $104,645.9 $108,831.7 $112,096.7 $116,580.5
2011 Total net revenues $ 90,374.00 4% 4% 4.0% 3% 4%
implied growth 7.1%
Marchandise costs $ 76,858 79893 83193 86521 89117 92682
79.4% 79.4% 79.5% 79.5% 79.5% 79.5%
Gross Profit $19,893 $20,728 $21,452 $22,311 $22,980 $23,899
implied margins 20.6% 20.6% 20.5% 20.5% 20.5% 20.5%
Operating, General and Administrative $ 14,849 $ 15,395 $ 16,011 $ 16,651 $ 16,815 $ 17,487
15.3% 15.3% 15.3% 15.3% 15.0% 15.0%
Rent $ 628 $ 805 $ 837 $ 871 $ 897 $ 933
0.6% 0.8% 0.8% 0.8% 0.8% 0.8%
Depreciation and amortization expenses $ 1,652 $ 1,765 $ 1,784 $ 1,630 $ 1,653 $ 1,692
12% 12% 12% 12% 12%
Operating income $2,764.0 $2,762.6 $2,820.1 $3,158.5 $3,615.8 $3,786.9
implied margins 2.9% 2.7% 2.7% 2.9% 3.2% 3.2%
Interest expense ($462) ($521) ($525) ($524) ($519) ($548)
interest rate on financial liabilities 7.0% 7.0% 7.5% 7.5% 7.5%
Earnings before income taxes $2,302 $2,242 $2,295 $2,634 $3,097 $3,239
Income taxes $ 794 $ 785 $ 803 $ 922 $ 1,084 $ 1,134
effective tax rate assumption (10-K, p.26 mgt. provided) 35.0% 35.0% 35.0% 35.0% 35.0% 35.0%
Net earnings including noncontrolling interes $1,508 $1,457 $1,492 $1,712 $2,013 $2,105
Net earnings attributable to noncontrolling in $11 $11 $11 $11 $11 $11
Net earnings attributable to Kroger $1,497 $1,446 $1,481 $1,701 $2,002 $2,094
Kroger: Balance Sheet Forecasts
(Thousands)
Actual Forecasts
ASSETS 2012 2013 2014 2015 2016 2017
Current assets:
Cash and temporary cash investments $238.0 0.0 0.0 0.0 165.5 0.0
days sales in cash 1.7 1.7 1.7 1.7 1.7
Deposits in-transit 955.00 974.7 1032.2 1055.0 1033.4 1074.7
percentage of total assets 3.50 3.50 3.50 3.40 3.30
Receivables $1,051.0 1071.7 1135.9 1070.5 1140.7 1159.0
percentage of total assets 3.85 3.85 3.70 3.60 3.60
FIFO inventory $6,244.0 6437.0 6464.5 6654.9 6858.1 6876.0
turnover assumption (in days) 23.0 22.5 22.0 22.0 21.5
LIFO reserve ($1,098.0) -1029.9 -1099.0 -1197.9 -1234.5 -1237.7
turnover assumption (in days) 0.18 0.16 0.17 0.18 0.18 0.18
Prefunded employee benefits $0.0 0.0 0.0 0.0 0.0 0.0
percentage of total assets
Prepaid expenses and other current assets $569.0 539.4 520.4 518.7 550.9 564.1
percentage of total assets 2.2% 2.1% 2.1% 2.2% 2.2%
Total current assets $7,959.0 $7,992.9 $8,054.1 $8,101.2 $8,514.2 $8,436.1
Property, plant and equipment, net $14,875.0 14710.85 14869.07 14819.33 15024.98 15384.98
60.0% 60.0% 60.0% 60.0% 60.0%
Other assets $584.0 588.4 594.8 568.1 500.8 538.5
percentage of total assets 2.4% 2.4% 2.3% 2.0% 2.1%
Goodwill $1,234.0 1225.9 1263.9 1210.2 1001.7 1282.1
percentage of total assets 5.0% 5.1% 4.9% 4.0% 5.0%
TOTAL ASSETS $24,652.0 $24,518.1 $24,781.8 $24,698.9 $25,041.6 $25,641.6
LIABILITIES AND SHAREHOLDERS EQUITY
Current liabilities:
$2,734.0 $1,109.1 $986.9 $275.4 $0.0 $181.8
% of total debt 16.00% 16.00% 16.00% 16.00% 16.00%
Trade accounts payable $4,524.0 4607.7 4560.1 4751.3 4894.3 4825.4
Turnover assumption (in days) 21.00 20.00 20.00 20.00 19.00
Accrued salaries and wages $977.0 1003.4 1030.5 1057.3 1083.7 1109.7
% of total assets 2.70% 2.70% 2.6% 2.5% 2.4%
Deferred income taxes $284.0 291.1 295.5 298.4 299.9 301.4
grow with sales 2.5% 1.5% 1.0% 0.5% 0.5%
Other current liabilities $2,538.0 $2,558.3 $2,578.8 $2,599.4 $2,620.2 $2,641.2
grow with company stores 0.80% 0.80% 0.80% 0.80% 0.80%
Total current liabilities $11,057.0 $9,569.6 $9,451.7 $8,981.8 $8,898.1 $9,059.5
$6,141.0 6325 6515 6710 6912 7119
% of total equity 10961.3 11157.2 11427.1 11704.6 12014.1
$4.0 $4.0 $4.0 $4.0 $4.0 $4.0
Long-term debt including obligations under c $6,145.0 $6,329.2 $6,519.0 $6,714.4 $6,915.7 $7,123.1
Deferred income taxes $800.0 $832.0 $865.3 $899.9 $926.9 $964.0
grow with Sale 4.00% 4.00% 4.00% 3.00% 4.00%
Pension and postretirement benefit obligatio $1,291.0 $1,337.8 $1,392.5 $1,409.7 $1,464.5 $1,499.6
%of accrual salaries 75% 74% 75% 74% 74%
Other long-term liabilities $1,145.0 $1,154.2 $1,163.4 $1,172.7 $1,182.1 $1,191.5
% of store growth 0.80% 0.80% 0.80% 0.80% 0.80%
TOTAL LIABILITIES $20,438.0 $19,222.8 $19,391.8 $19,178.5 $19,387.2 $19,837.7
Preferred shares, $100 par per share, 5 share $0.0 $0.0 $0.0 $0.0 $0.0 $0.0
$959.0 959.0 959.0 959.0 959.0 959.0
Current portion of long-term debt including
obligations under capital leases and
financing obligations
Face-value of long-term debt including
obligations under capital leases and
financing obligations
Adjustment related to fair-value of interest
rate hedges
Common shares, $1 par per share, 1,000
shares authorized; 959 shares issued in 2011
and 2010
Additional paid-in capital $3,451.0 3485.5 3485.5 3485.5 3485.5 3485.5
Accumulated other comprehensive loss ($753.0) ($783.1) ($814.4) ($847.0) ($880.9) ($916.1)
Accumulated earnings $9,787.0 10963.3 11182.5 11439.7 11702.9 11983.7
Common stock in treasury, at cost, 398 shares ($9,237.0) -9329.4 -9422.7 -9516.9 -9612.1 -9708.2
Total Shareowners’ Equity $4,207.0 5295.3 5389.9 5520.3 5654.4 5803.9
Noncontrolling interests $7.0 $7.0 $7.0 $7.0 $7.0 $7.0
Total equity $4,214.0 $5,295.3 $5,389.9 $5,520.3 $5,654.4 $5,803.9
TOTAL LIABILITIES AND SHAREHOLDERS EQUI $24,652.0 $24,518.1 $24,781.8 $24,698.9 $25,041.6 $25,641.6
implied debt/equity ratios 1.405 1.393 1.266 1.223 1.259
check: balance sheet balance? 0.0 0.0 0.0 0.0 0.0
Normal dividend payout forecast: 267.0 267.0 267.0 267.0 267.0
Plug: -10.0 -1001.3 -1184.1 -1479.0 -1553.5
Total implied dividends: 277.0 1268.3 1451.1 1746.0 1820.5
kroger: Implied Statement of Cash Flows Forecasts
Forecasts
Implied Cash Flows: 2012 2013 2014 2015 2016 2017
Operations:
Net earnings including noncontrolling interest 1508.00 1457.28 1491.57 1712.25 2013.12 2105.40
Depreciation and amortization 1652.00 1765.30 1784.29 1630.13 1652.75 1692.35
Goodwill impairment charge 0.00 0.00 0.00 0.00 0.00 0.00
Asset impairment charge 18.00 20.00 18.00 19.00 18.00 18.00
LIFO charge 55.00 111.85 116.47 121.13 124.76 129.75
Stock-based employee compensation 82.00 80.00 80.00 80.00 80.00 80.00
Expense for Company-sponsored pension pla 89.00 93.00 97.00 101.00 105.00 109.00
Deferred income taxes 176.00 -7.10 -4.37 -2.95 -1.49 -1.50
Other 17.00 23.17 29.34 35.51 41.68 47.85
Store deposits in-transit -169.00 -112.17 -177.17 -120.34 -185.34 -128.51
average 56.83 -65.00 56.83 -65.00 56.83
Inventories -78.00 -193.01 -27.53 -190.36 -203.22 -17.90
Receivables -126.00 -20.69 -64.22 65.36 -70.13 -18.31
Prepaid expenses -257.00 29.60 18.98 1.74 -32.24 -13.20
Trade accounts payable 58.00 -83.69 47.64 -191.26 -142.93 68.80
Accrued expenses 76.00 -26.38 -27.09 -26.79 -26.43 -26.01
Income taxes receivable and payable 164.00 -39.10 -37.65 -37.57 -28.49 -38.58
Contribution to Company-sponsored pension -71.00 -90.40 -109.80 -129.20 -148.60 -168.00
average -19.40 -19.40 -19.40 -19.40 -19.40
Other -361.00 -402.17 -443.34 -484.51 -525.68 -566.85
average -41.17 -41.17 -41.17 -41.17 -41.17
Adjustments to reconcile net earnings to net
cash provided by Operating activities:
Changes in operating assets and liabilities
net of effects from acquisitions of
businesses:
Net cash provided by operating activities
2833.00 2662.32 2727.12 2639.96 2605.76 3329.12
Terminal
Growth
Factor
1.02
Terminal
2018 2019 2020 2021 2022 2023
$114,248.9 $117,676.4 $116,499.6 $119,994.6 $118,794.7 $121,170.6
-2% 3% -1% 3% -1% 2%
90828 94141 93200 95996 95036 96936
79.5% 80.0% 80.0% 80.0% 80.0% 79.0%
$23,421 $23,535 $23,300 $23,999 $23,759 $24,234
20.5% 20.0% 20.0% 20.0% 20.0% 20.0%
$ 17,023 $ 17,298 $ 17,358 $ 17,639 $ 17,463 $ 17,812
14.9% 14.7% 14.9% 14.7% 14.7%
$ 914 $ 941 $ 932 960.0 950.4 969.4
0.8% 0.8% 0.8% 0.8% 0.8%
$ 1,703 $ 1,652 $ 1,652 $ 1,652 $ 1,652 $ 1,685
12% 12% 12% 12% 12%
$3,780.7 $3,643.4 $3,357.5 $3,747.8 $3,693.8 $3,767.6
3.3% 3.1% 2.9% 3.1% 3.1% 3.1%
($550) ($567) ($584) ($601) ($619) ($632)
7.5% 7.5% 7.5% 7.5% 7.5%
$3,230 $3,077 $2,774 $3,147 $3,074 $3,136
$ 1,163 $ 1,108 $ 971 $ 1,133 $ 1,107 $ 1,129
36.0% 36.0% 35.0% 36.0% 36.0%
$2,068 $1,969 $1,803 $2,014 $1,968 $2,007
$11 $11 $11 $11 $11 $11
$2,057 $1,958 $1,792 $2,003 $1,957 $1,996
Terminal
Growth
Factor
1.02
Terminal
2018 2019 2020 2021 2022 2023
340.2 263.0 629.1 629.3 827.6 844.1
1.7 1.7 1.7 1.7 1.7
1053.8 1138.5 1031.9 1072.1 1076.0 1097.5
3.40 3.40 3.40 3.20 3.30
1157.3 1228.5 1133.4 1299.3 1174.2 1197.7
3.70 3.70 3.70 3.70 3.80
6896.5 6966.8 7077.0 7059.4 7065.8 7207.1
22.0 21.5 22.0 21.5 21.7
-1241.4 -1254.0 -1273.9 -1270.7 -1271.8 -1297.3
0.18 0.18 0.18 0.18 0.18
0.0 0.0 0.0 0.0 0.0 0.0
567.7 577.2 585.6 598.7 604.3 616.3
2.2% 2.2% 2.2% 2.2% 2.2%
$8,774.1 $8,919.9 $9,183.1 $9,388.1 $9,476.0 $9,665.5
15483.69 15740.99 15970.63 16327.07 16479.93 16809.53
60.0% 60.0% 60.0% 60.0% 60.0%
516.1 524.7 532.4 544.2 549.3 560.3
2.0% 2.0% 2.0% 2.0% 2.0%
1032.2 1049.4 931.6 952.4 961.3 980.6
4.0% 4.0% 3.5% 3.5% 3.5%
$25,806.1 $26,235.0 $26,617.7 $27,211.8 $27,466.5 $28,015.9
$0.0 $0.0 $0.0 $0.0 $0.0 $0.0
16.00% 16.00% 16.00% 16.00% 16.00%
4729.1 4646.0 4601.6 4733.2 4687.0 4780.8
19.00 18.00 18.00 18.00 18.00
1136.3 1163.6 1191.5 1214.2 1236.0 1260.7
2.4% 2.4% 2.4% 1.9% 1.8%
302.6 303.5 304.1 304.4 304.7 310.8
0.4% 0.3% 0.2% 0.1% 0.1%
$2,662.3 $2,683.6 $2,705.1 $2,726.7 $2,748.5 2803.5
0.80% 0.80% 0.80% 0.80% 0.80%
$8,830.3 $8,796.8 $8,802.3 $8,978.5 $8,976.3 $9,155.8
7333 7553 7779 8013 8253 8418.1
12332.6 12635.0 12867.7 13105.4 13077.9
$4.0 $4.0 $4.0 $4.0 $4.0 $4.08
$7,336.7 $7,556.7 $7,783.2 $8,016.6 $8,257.0 $8,422.1
$944.7 $973.0 $963.3 $992.2 $982.3 $1,001.9
-2.00% 3.00% -1.00% 3.00% -1.00%
$1,535.6 $1,594.0 $1,632.2 $1,663.3 $1,693.2 $1,727.1
74% 73% 73% 73% 73%
$1,201.1 $1,210.7 $1,220.4 $1,230.1 $1,240.0 $1,264.8
0.80% 0.80% 0.80% 0.80% 0.80%
$19,848.4 $20,131.1 $20,401.4 $20,880.7 $21,148.7 $21,571.7
$0.0 $0.0 $0.0 $0.0 $0.0 $0.0
959.0 959.0 959.0 959.0 959.0 978.2
3485.5 3485.5 3485.5 3485.5 3485.510 3555.220
($952.8) ($990.9) ($1,030.5) ($1,071.8) ($1,114.6) -1136.9
12271.3 12553.6 12804.6 13060.7 13191.3 13455.2
-9805.3 -9903.3 -10002.3 -10102.4 -10203.4 -10407.462
5957.8 6103.9 6216.3 6331.1 6317.8 6444.2
$7.0 $7.0 $7.0 $7.0 $7.0 $7.0
$5,957.8 $6,103.9 $6,216.3 $6,331.1 $6,317.8 $6,444.2
$25,806.1 $26,235.0 $26,617.7 $27,211.8 $27,466.5 $28,015.9
1.231 1.238 1.252 1.266 1.307 1.307
0.0 0.0 0.0 0.0 0.0 0.0
267.0 267.0 267.0 267.0 267.0 267.0
-1508.9 -1415.8 -1280.9 -1486.7 -1566.1 -1472.2
1775.9 1682.8 1547.9 1753.7 1833.1 1739.2
Terminal
1.02
1.02
2018 2019 2020 2021 2022 2023
2067.51 1969.08 1802.93 2013.77 1967.67 2007.02
1703.21 1652.00 1652.00 1652.00 1652.00 1685.04
0.00 0.00 0.00 0.00 0.00 0.00
18.00 18.00 18.00 18.00 18.00 18.36
127.16 131.80 130.48 134.39 133.05 135.71
80.00 80.00 80.00 80.00 80.00 80.00
113.00 117.00 121.00 125.00 129.00 131.58
-1.21 -0.91 -0.61 -0.30 -0.30 -6.09
54.02 60.19 66.36 72.53 78.70 84.87
-193.51 -136.68 -201.68 -144.85 -209.85 -214.05
-65.00 56.83 -65.00 56.83 -65.00
-20.43 -70.35 -110.20 17.64 -6.46 -141.32
1.71 -71.19 95.05 -165.91 125.14 -23.48
-3.62 -9.43 -8.42 -13.07 -5.60 -12.09
96.36 83.05 44.46 -131.58 46.15 -93.74
-26.63 -27.27 -27.93 -22.64 -21.86 -24.72
18.07 -29.25 9.12 -29.20 9.62 -25.74
-187.40 -206.80 -226.20 -245.60 -265.00 -270.30
-19.40 -19.40 -19.40 -19.40 -19.40
-608.02 -649.19 -690.36 -731.53 -772.70 -788.15
-41.17 -41.17 -41.17 -41.17 -41.17
3173.22 2966.87 2689.01 2685.47 2892.56 2542.90
371377193.xlsx
Professor Matt Wieland
Valuation Models **Go to Tools, Options, Calculations tab, and click on "Iteration" to allow changes to flow through.
3/21/2013
Firm: Starbucks
Analyst: A517
(insert forecast assumptions in blue font cells.)
Valuation Parameter Assumptions:
WACC Computations: Forecasts:
2013 2014 2015 2016
Equity:
Risk-free rate 2.2% 0.73 finance.yahoo.com
Beta 0.65 0.6 value line
Market risk premium 4% 0.38 google
Equity cost of capital 4.93% 0.37 S&P
0.52
Shares Outstanding: 537.00 537.00 537.00 537.00 537.00
Market (Intrinsic) Value ps 23.46 24.62 25.83 27.10 28.44
Market Value total 12598.0 13219.1 13870.8 14554.6 15272.2
Debt: 35% 35% 35% 35% 35%
Total debt capital 8879.0 7438.3 7505.9 6989.9 6915.7
cost of debt 6.1% 6.1% 6.1% 6.1% 6.1%
1-Tax rate 65.0% 65.0% 65.0% 65.0% 65.0%
Cost of equity 4.93% 4.93% 4.93% 4.93% 4.93%
Total capital (d+e) 21477.0 20036.3 20103.9 19587.9 19513.8
Equity Weight 0.59 0.63 0.63 0.64 0.65
Debt Weight: 0.41 0.37 0.37 0.36 0.35
WACC 4.53% 4.57% 4.57% 4.59% 4.59%
WACC Discount Factors
371377193.xlsx
Terminal Value Growth Assumption: 2.0%
371377193.xlsx
Valuation: Residual Income 1 2 3 4
2013 2014 2015 2016
Net Earnings 1446.3 1480.6 1701.2 2002.1
Lagged Book Value Equity 4214.0 5295.3 5389.9 5520.3
Normal Earnings (Re * BVt-1) 207.8 261.1 265.7 272.2
Abnormal Earnings 1238.5 1219.5 1435.5 1730.0
Present Value Factors 0.953 0.908 0.866 0.825
PV Abnormal Earnings 1180.3 1107.6 1242.5 1427.1
Sum PV Abnormal Earnings thru Year +10 12,030.6 Sensitivity to growth
PV of Continuing Abnormal Earnings 35,532.1 98.80
Add: Beginning Book Value of Equity 4,214.0 0%
PV of Equity 51,776.7 1%
2%
Adjust to midyear 1.02 3%
Total PV Abnormal Earnings 53,053.01 4%
Shares Outstanding 537.00
Estimated Value per Share 99
Valuation: Dividends 1 2 3 4
2013 2014 2015 2016
Dividends 277.0 1268.3 1451.1 1746.0
(1+Re) 1.049 1.101 1.155 1.212
V0 264.0 1151.9 1256.0 1440.3
Sum of V0 11398.8
D t+1 1390.9 1404.3 1627.5 1931.8
Earnings 1446 1481 1701 2002
(1+g) 1.020 1.020 1.020 1.020
Earnings*(1+g) 1475.2 1510.2 1735.3 2042.2
371377193.xlsx
BV t 4214.0 5295.3 5389.9 5520.3
BV t * (1+g) 4298.3 5401.2 5497.7 5630.7
(Re-g) 2.93% 2.93% 2.93% 2.93%
Vt
PV of Vt 40,278.69
V 51677.5 Sensitivity to growth
Midterm year 1.02 98
V 52711.06 0%
1% #REF!
Shares outstanding 537.00 2% #REF!
Value Per Share 98 3% #REF!
371377193.xlsx
4% #REF!
Valuation:
Free Cash Flow for Common Equity
Ending Invested capital 14237.48
ROIC beyond horizon 15.80%
cost of equity 4.93%
growth 2.0%
Horizon value 67057.07
Present value of horizon 41442.68
PV of FCF 17580.63
Total PV 59023.31
Midterm Year 1.02
Value of operation 60203.78
Add non operating assets
Cash and temporary cash investments 238.00
Deposits in-transit 955.00
Value of enterprise 61396.78
Deduct debt
2734
6145
Noncontrolling interests 7
Total deduction 8886
Value of Common equity 52510.78
Shares outstanding 537.00
Current portion of long-term debt including obligations under
capital leases and financing obligations
Long-term debt including obligations under capital leases and
financing
371377193.xlsx
Estimated Value per Share 98
371377193.xlsx
2017 2018 2019 2020 2021 2022
finance.yahoo.com
537.00 537.00 537.00 537.00 537.00 537.00
29.84 31.31 32.86 34.48 36.18 37.96 Cost of Capital - Heinz 2,012
16025.1 16815.1 17644.1 18514.0 19426.7 20384.5 Share price at January 28, 2012 $23.46
Shares outstanding, January 2012 537.00
Market value of equity, in thousands 12,598
35% 35% 35% 35% 35% 35%
7304.9 7336.7 7556.7 7783.2 8016.6 8257.0 Portion of long-term debt due within one year 2,734
6.1% 6.1% 6.1% 6.1% 6.1% 6.1% long term debt 6,145
65.0% 65.0% 65.0% 65.0% 65.0% 65.0% Market value of debt 8,879
4.93% 4.93% 4.93% 4.93% 4.93% 4.93%
19902.9 19934.7 20154.7 20381.3 20614.6 20855.0
0.63 0.63 0.63 0.62 0.61 0.60 Total market value 21,477
0.37 0.37 0.37 0.38 0.39 0.40 Weight of equity 0.59
Weight of debt 0.41
4.58% 4.57% 4.57% 4.56% 4.55% 4.55%
Risk-free rate (recent 10-yr Treasury rate) 2.20%
371377193.xlsx
Market risk premium (given) 3.0%
371377193.xlsx
5 6 7 8 9 10 11
2017 2018 2019 2020 2021 2022 2023
2094.4 2056.5 1958.1 1791.9 2002.8 1956.7 1996.0
5654.4 5803.9 5957.8 6103.9 6216.3 6331.1 6317.8
278.8 286.1 293.7 300.9 306.5 312.1 311.5
1815.6 1770.4 1664.4 1491.0 1696.3 1644.5 1684.6
0.786 0.749 0.714 0.680 0.648 0.618 0.029 (Re - g)
1427.3 1326.4 1188.4 1014.6 1100.0 1016.4 57,493.3
Sensitivity to discount rate 0.618
98.80 35,532.1
3%
4%
5%
6%
7%
8%
5 6 7 8 9 10 11
2017 2018 2019 2020 2021 2022 2023
1820.5 1775.9 1682.8 1547.9 1753.7 1833.1 1739.2
1.272 1.335 1.401 1.470 1.542 1.618
1431.2 1330.5 1201.6 1053.3 1137.2 1132.9
2023.2 1981.6 1878.1 1705.7 1918.5 1869.2 1909.6
2094 2057 1958 1792 2003 1957 1996
1.020 1.020 1.020 1.020 1.020 1.020 1.020
2136.3 2097.6 1997.2 1827.8 2042.8 1995.8 2035.9
371377193.xlsx
5654.4 5803.9 5957.8 6103.9 6216.3 6331.1 6317.8
5767.5 5920.0 6077.0 6225.9 6340.6 6457.7 6444.2
2.93% 2.93% 2.93% 2.93% 2.93% 2.93% 2.93%
65174
Sensitivity to discount rate
98
3.0%
4.0% #REF!
5.0% #REF!
6.0% #REF!
371377193.xlsx
7.0% #REF!
8.0% #REF!
371377193.xlsx
2013 2014 2015 2016 2017 2018 2019 2020 2021 2022
$23.46 $23.46 $23.46 $23.46 $23.46 $23.46 $23.46 $23.46 $23.46 $23.46
537.00 537.00 537.00 537.00 537.00 537.00 537.00 537.00 537.00 537.00
12,598 12,598 12,598 12,598 12,598 12,598 12,598 12,598 12,598 12,598
1,109 987 275 0 182 0 0 0 0 0
6,329 6,519 6,714 6,916 7,123 7,337 7,557 7,783 8,017 8,257
7,438 7,506 6,990 6,916 7,305 7,337 7,557 7,783 8,017 8,257
20,036 20,104 19,588 19,514 19,903 19,935 20,155 20,381 20,615 20,855
0.63 0.63 0.64 0.65 0.63 0.63 0.63 0.62 0.61 0.60
0.37 0.37 0.36 0.35 0.37 0.37 0.37 0.38 0.39 0.40
Firm: kroger
kroger: Income Statement Forecasts
Actual Forecasts
(Thousands) 2012 2013 2014 2015 2016
Total net revenues $ 96,751.00 $100,621.0 $104,645.9 $108,831.7 $112,096.7
2011 Total net revenues $ 90,374.00 4% 4% 4.0% 3%
implied growth 7.1%
Marchandise costs $ 76,858.00 79893.1 83193.5 86521.2 89116.9
79.4% 79.4% 79.5% 79.5% 79.5%
Gross Profit $19,893.0 $20,727.9 $21,452.4 $22,310.5 $22,979.8
implied margins 20.6% 20.6% 20.5% 20.5% 20.5%
Operating, General and Administrative $ 14,849.00 15395.0 16010.8 16651.3 16814.5
15.3% 15.3% 15.3% 15.3% 15.0%
Rent $ 628.00 805.0 837.2 870.7 896.8
0.6% 0.8% 0.8% 0.8% 0.8%
Depreciation and amortization expenses $ 1,652.00 $ 1,765.30 $ 1,784.29 $ 1,630.13 $ 1,652.75
12% 12% 12% 12%
Operating income $2,764.0 $2,762.6 $2,820.1 $3,158.5 $3,615.8
implied margins 2.9% 2.7% 2.7% 2.9% 3.2%
Interest expense ($462.0) ($520.7) ($525.4) ($524.2) ($518.7)
interest rate on financial liabilities 7.0% 7.0% 7.5% 7.5%
Earnings before income taxes $2,302.0 $2,242.0 $2,294.7 $2,634.2 $3,097.1
Income taxes 794.00 784.7 803.2 922.0 1084.0
effective tax rate assumption (10-K, p.26 mgt. provided) 35.0% 35.0% 35.0% 35.0% 35.0%
Net earnings including noncontrolling interests $1,508.0 $1,457.3 $1,491.6 $1,712.2 $2,013.1
Net earnings attributable to noncontrolling interests $11.0 $11.0 $11.0 $11.0 $11.0
Net earnings attributable to Kroger $1,497.0 $1,446.3 $1,480.6 $1,701.2 $2,002.1
Kroger: Balance Sheet Forecasts
(Thousands)
Actual Forecasts
ASSETS 2012 2013 2014 2015 2016
Current assets:
Cash and temporary cash investments $238.0 0.0 0.0 0.0 165.5
days sales in cash 1.7 1.7 1.7 1.7
Deposits in-transit 955.00 974.7 1032.2 1055.0 1033.4
percentage of total assets 3.50 3.50 3.50 3.40
Receivables $1,051.0 1071.7 1135.9 1070.5 1140.7
percentage of total assets 3.85 3.85 3.70 3.60
FIFO inventory $6,244.0 6437.0 6464.5 6654.9 6858.1
turnover assumption (in days) 23.0 22.5 22.0 22.0
LIFO reserve ($1,098.0) -1029.9 -1099.0 -1197.9 -1234.5
turnover assumption (in days) 0.18 0.16 0.17 0.18 0.18
Prefunded employee benefits $0.0 0.0 0.0 0.0 0.0
percentage of total assets
Prepaid expenses and other current assets $569.0 539.4 520.4 518.7 550.9
percentage of total assets 2.2% 2.1% 2.1% 2.2%
Total current assets $7,959.0 $7,992.9 $8,054.1 $8,101.2 $8,514.2
Property, plant and equipment, net $14,875.0 14710.85 14869.07 14819.33 15024.98
60.0% 60.0% 60.0% 60.0%
Other assets $584.0 588.4 594.8 568.1 500.8
percentage of total assets 2.4% 2.4% 2.3% 2.0%
Goodwill $1,234.0 1225.9 1263.9 1210.2 1001.7
percentage of total assets 5.0% 5.1% 4.9% 4.0%
TOTAL ASSETS $24,652.0 $24,518.1 $24,781.8 $24,698.9 $25,041.6
LIABILITIES AND SHAREHOLDERS EQUITY
Current liabilities:
$2,734.0 $1,109.1 $986.9 $275.4 $0.0
% of total debt 16.00% 16.00% 16.00% 16.00%
Trade accounts payable $4,524.0 4607.7 4560.1 4751.3 4894.3
Turnover assumption (in days) 21.00 20.00 20.00 20.00
Accrued salaries and wages $977.0 1003.4 1030.5 1057.3 1083.7
% of total assets 2.70% 2.70% 2.6% 2.5%
Deferred income taxes $284.0 291.1 295.5 298.4 299.9
grow with sales 2.5% 1.5% 1.0% 0.5%
Other current liabilities $2,538.0 $2,558.3 $2,578.8 $2,599.4 $2,620.2
grow with company stores 0.80% 0.80% 0.80% 0.80%
Total current liabilities $11,057.0 $9,569.6 $9,451.7 $8,981.8 $8,898.1
$6,141.0 6325 6515 6710 6912
% of total equity 10961.3 11157.2 11427.1 11704.6
Adjustment related to fair-value of interest rate hedges $4.0 $4.0 $4.0 $4.0 $4.0
Long-term debt including obligations under capital leas $6,145.0 $6,329.2 $6,519.0 $6,714.4 $6,915.7
Deferred income taxes $800.0 $832.0 $865.3 $899.9 $926.9
grow with Sale 4.00% 4.00% 4.00% 3.00%
Pension and postretirement benefit obligations $1,291.0 $1,337.8 $1,392.5 $1,409.7 $1,464.5
%of accrual salaries 75% 74% 75% 74%
Other long-term liabilities $1,145.0 $1,154.2 $1,163.4 $1,172.7 $1,182.1
% of store growth 0.80% 0.80% 0.80% 0.80%
TOTAL LIABILITIES $20,438.0 $19,222.8 $19,391.8 $19,178.5 $19,387.2
Preferred shares, $100 par per share, 5 shares authorize $0.0 $0.0 $0.0 $0.0 $0.0
$959.0 959.0 959.0 959.0 959.0
Additional paid-in capital $3,451.0 3485.5 3485.5 3485.5 3485.5
Current portion of long-term debt including obligations
under capital leases and financing obligations
Face-value of long-term debt including obligations
under capital leases and financing obligations
Common shares, $1 par per share, 1,000 shares
authorized; 959 shares issued in 2011 and 2010
Accumulated other comprehensive loss ($753.0) ($783.1) ($814.4) ($847.0) ($880.9)
Accumulated earnings $9,787.0 10963.3 11182.5 11439.7 11702.9
Common stock in treasury, at cost, 398 shares in 2011 an ($9,237.0) -9329.4 -9422.7 -9516.9 -9612.1
Total Shareowners’ Equity $4,207.0 5295.3 5389.9 5520.3 5654.4
Noncontrolling interests $7.0 $7.0 $7.0 $7.0 $7.0
Total equity $4,214.0 $5,295.3 $5,389.9 $5,520.3 $5,654.4
TOTAL LIABILITIES AND SHAREHOLDERS EQUITY $24,652.0 $24,518.1 $24,781.8 $24,698.9 $25,041.6
implied debt/equity ratios 1.405 1.393 1.266 1.223
check: balance sheet balance? 0.0 0.0 0.0 0.0
Invested Capital (operating) 2012 2013 2014 2015 2016
Receivables 1051.0 1071.7 1135.9 1070.5 1140.7
FIFO inventory 6244.0 6437.0 6464.5 6654.9 6858.1
LIFO reserve -1098.0 -1029.9 -1099.0 -1197.9 -1234.5
Prefunded employee benefits 0.0 0.0 0.0 0.0 0.0
Prepaid expenses and other current assets 569.0 539.4 520.4 518.7 550.9
Property, plant and equipment, net 14875.0 14710.8 14869.1 14819.3 15025.0
Other assets 584.0 588.4 594.8 568.1 500.8
Goodwill 1234.0 1225.9 1263.9 1210.2 1001.7
Trade accounts payable -4524.0 -4607.7 -4560.1 -4751.3 -4894.3
Accrued salaries and wages -977.0 -1003.4 -1030.5 -1057.3 -1083.7
Other current liabilities -2538.0 -2558.3 -2578.8 -2599.4 -2620.2
Pension and postretirement benefit obligations -1291.0 -1337.8 -1392.5 -1409.7 -1464.5
Other long-term liabilities -1145.0 -1154.2 -1163.4 -1172.7 -1182.1
Total Invested Capital (operating) 12984 12882 13024 12654 12598
Invested Capital (financing) 2012 2013 2014 2015 2016
Cash and temporary cash investments -238.0 0.0 0.0 0.0 -165.5
Deposits in-transit -955.0 -974.7 -1032.2 -1055.0 -1033.4
2734.0 1109.1 986.9 275.4 0.0
Deferred income taxes 284.0 291.1 295.5 298.4 299.9
6145.0 6329.2 6519.0 6714.4 6915.7
Deferred income taxes 800.0 832.0 865.3 899.9 926.9
Total equity 4214.0 5295.3 5389.9 5520.3 5654.4
Total Invested Capital (financing) 12984.0 12882.0 13024.4 12653.5 12598.1
NOPAT (operating) 2012 2013 2014 2015 2016
Operating income 2764.0 2762.6 2820.1 3158.5 3615.8
Income tax provision -794.00 -784.69 -803.15 -921.98 -1083.99
Reverse non-operating tax effect
Interest expense tax affect -184.80 -208.27 -210.16 -209.70 -207.47
Change in deffered income tax
liabilities 1 7.10 4.37 2.95 1.49
Liabilities 2 $32.0 $33.3 $34.6 $27.0
Current portion of long-term debt including obligations
under capital leases and financing obligations
Long-term debt including obligations under capital
leases and financing
NOPAT (Operating) 1808.8 1844.5 2064.4 2352.8
NOPAT (financing) 2012 2013 2014 2015 2016
Net income $1,497.0 $1,446.3 $1,480.6 $1,701.2 $2,002.1
Reverse nonoperating ithems
Interest expense $277.20 $312.41 $315.25 $314.54 $311.21
Net earnings attributable to noncontrolling interests $11.00 $11.00 $11.00 $11.00 $11.00
Change in deferred income tax
liabilities 1 7.10 4.37 2.95 1.49
Liabilities 2 32.00 33.28 34.61 27.00
NOPAT (Financing) $1,808.8 $1,844.5 $2,064.4 $2,352.8
ROIC 13.93% 14.32% 15.85% 18.59%
FCF 1911 1702 2435 2408
Terminal
Growth
Factor
1.02
Terminal
2017 2018 2019 2020 2021 2022 2023
$116,580.5 $114,248.9 $117,676.4 $116,499.6 $119,994.6 $118,794.7 $121,170.6
4% -2% 3% -1% 3% -1% 2%
92681.5 90827.9 94141.1 93199.7 95995.7 95035.7 96936.5
79.5% 79.5% 80.0% 80.0% 80.0% 80.0% 79.0%
$23,899.0 $23,421.0 $23,535.3 $23,299.9 $23,998.9 $23,758.9 $24,234.1
20.5% 20.5% 20.0% 20.0% 20.0% 20.0% 20.0%
17487.1 17023.1 17298.4 17358.4 17639.2 17462.8 17812.1
15.0% 14.9% 14.7% 14.9% 14.7% 14.7%
932.6 914.0 941.4 932.0 960.0 950.4 969.4
0.8% 0.8% 0.8% 0.8% 0.8% 0.8%
$ 1,692.35 $ 1,703.21 $ 1,652.00 $ 1,652.00 $ 1,652.00 $ 1,652.00 1685.0
12% 12% 12% 12% 12% 12%
$3,786.9 $3,780.7 $3,643.4 $3,357.5 $3,747.8 $3,693.8 $3,767.6
3.2% 3.3% 3.1% 2.9% 3.1% 3.1% 3.1%
($547.9) ($550.3) ($566.7) ($583.7) ($601.2) ($619.3) -631.7
7.5% 7.5% 7.5% 7.5% 7.5% 7.5%
$3,239.1 $3,230.5 $3,076.7 $2,773.7 $3,146.5 $3,074.5 $3,136.0
1133.7 1163.0 1107.6 970.8 1132.7 1106.8 1129.0
35.0% 36.0% 36.0% 35.0% 36.0% 36.0%
$2,105.4 $2,067.5 $1,969.1 $1,802.9 $2,013.8 $1,967.7 $2,007.0
$11.0 $11.0 $11.0 $11.0 $11.0 $11.0 $11.0
$2,094.4 $2,056.5 $1,958.1 $1,791.9 $2,002.8 $1,956.7 $1,996.0
Terminal
Growth
Factor
1.02
Terminal
2017 2018 2019 2020 2021 2022 2023
0.0 340.2 263.0 629.1 629.3 827.6 844.1
1.7 1.7 1.7 1.7 1.7 1.7
1074.7 1053.8 1138.5 1031.9 1072.1 1076.0 1097.5
3.30 3.40 3.40 3.40 3.20 3.30
1159.0 1157.3 1228.5 1133.4 1299.3 1174.2 1197.7
3.60 3.70 3.70 3.70 3.70 3.80
6876.0 6896.5 6966.8 7077.0 7059.4 7065.8 7207.1
21.5 22.0 21.5 22.0 21.5 21.7
-1237.7 -1241.4 -1254.0 -1273.9 -1270.7 -1271.8 -1297.3
0.18 0.18 0.18 0.18 0.18 0.18
0.0 0.0 0.0 0.0 0.0 0.0 0.0
564.1 567.7 577.2 585.6 598.7 604.3 616.3
2.2% 2.2% 2.2% 2.2% 2.2% 2.2%
$8,436.1 $8,774.1 $8,919.9 $9,183.1 $9,388.1 $9,476.0 $9,665.5
15384.98 15483.69 15740.99 15970.63 16327.07 16479.93 16809.53
60.0% 60.0% 60.0% 60.0% 60.0% 60.0%
538.5 516.1 524.7 532.4 544.2 549.3 560.3
2.1% 2.0% 2.0% 2.0% 2.0% 2.0%
1282.1 1032.2 1049.4 931.6 952.4 961.3 980.6
5.0% 4.0% 4.0% 3.5% 3.5% 3.5%
$25,641.6 $25,806.1 $26,235.0 $26,617.7 $27,211.8 $27,466.5 $28,015.9
$181.8 $0.0 $0.0 $0.0 $0.0 $0.0 $0.0
16.00% 16.00% 16.00% 16.00% 16.00% 16.00%
4825.4 4729.1 4646.0 4601.6 4733.2 4687.0 4780.8
19.00 19.00 18.00 18.00 18.00 18.00
1109.7 1136.3 1163.6 1191.5 1214.2 1236.0 1260.7
2.4% 2.4% 2.4% 2.4% 1.9% 1.8%
301.4 302.6 303.5 304.1 304.4 304.7 310.8
0.5% 0.4% 0.3% 0.2% 0.1% 0.1%
$2,641.2 $2,662.3 $2,683.6 $2,705.1 $2,726.7 $2,748.5 2803.5
0.80% 0.80% 0.80% 0.80% 0.80% 0.80%
$9,059.5 $8,830.3 $8,796.8 $8,802.3 $8,978.5 $8,976.3 $9,155.8
7119 7333 7553 7779 8013 8253 8418.1
12014.1 12332.6 12635.0 12867.7 13105.4 13077.9
$4.0 $4.0 $4.0 $4.0 $4.0 $4.0 $4.08
$7,123.1 $7,336.7 $7,556.7 $7,783.2 $8,016.6 $8,257.0 $8,422.1
$964.0 $944.7 $973.0 $963.3 $992.2 $982.3 $1,001.9
4.00% -2.00% 3.00% -1.00% 3.00% -1.00%
$1,499.6 $1,535.6 $1,594.0 $1,632.2 $1,663.3 $1,693.2 $1,727.1
74% 74% 73% 73% 73% 73%
$1,191.5 $1,201.1 $1,210.7 $1,220.4 $1,230.1 $1,240.0 $1,264.8
0.80% 0.80% 0.80% 0.80% 0.80% 0.80%
$19,837.7 $19,848.4 $20,131.1 $20,401.4 $20,880.7 $21,148.7 $21,571.7
$0.0 $0.0 $0.0 $0.0 $0.0 $0.0 $0.0
959.0 959.0 959.0 959.0 959.0 959.0 978.2
3485.5 3485.5 3485.5 3485.5 3485.5 3485.510 3555.220
($916.1) ($952.8) ($990.9) ($1,030.5) ($1,071.8) ($1,114.6) -1136.9
11983.7 12271.3 12553.6 12804.6 13060.7 13191.3 13455.2
-9708.2 -9805.3 -9903.3 -10002.3 -10102.4 -10203.4 -10407.462
5803.9 5957.8 6103.9 6216.3 6331.1 6317.8 6444.2
$7.0 $7.0 $7.0 $7.0 $7.0 $7.0 $7.0
$5,803.9 $5,957.8 $6,103.9 $6,216.3 $6,331.1 $6,317.8 $6,444.2
$25,641.6 $25,806.1 $26,235.0 $26,617.7 $27,211.8 $27,466.5 $28,015.9
1.259 1.231 1.238 1.252 1.266 1.307 1.307
0.0 0.0 0.0 0.0 0.0 0.0 0.0
2017 2018 2019 2020 2021 2022 2023
1159.0 1157.3 1228.5 1133.4 1299.3 1174.2 1197.7
6876.0 6896.5 6966.8 7077.0 7059.4 7065.8 7207.1
-1237.7 -1241.4 -1254.0 -1273.9 -1270.7 -1271.8 -1297.3
0.0 0.0 0.0 0.0 0.0 0.0 0.0
564.1 567.7 577.2 585.6 598.7 604.3 616.3
15385.0 15483.7 15741.0 15970.6 16327.1 16479.9 16809.5
538.5 516.1 524.7 532.4 544.2 549.3 560.3
1282.1 1032.2 1049.4 931.6 952.4 961.3 980.6
-4825.4 -4729.1 -4646.0 -4601.6 -4733.2 -4687.0 -4780.8 -1
-1109.7 -1136.3 -1163.6 -1191.5 -1214.2 -1236.0 -1260.7 -1
-2641.2 -2662.3 -2683.6 -2705.1 -2726.7 -2748.5 -2803.5
-1499.6 -1535.6 -1594.0 -1632.2 -1663.3 -1693.2 -1727.1
-1191.5 -1201.1 -1210.7 -1220.4 -1230.1 -1240.0 -1264.8
13300 13148 13536 13606 13943 13958 14237
2017 2018 2019 2020 2021 2022 2023
0.0 -340.2 -263.0 -629.1 -629.3 -827.6 -844.1
-1074.7 -1053.8 -1138.5 -1031.9 -1072.1 -1076.0 -1097.5 -1
181.8 0.0 0.0 0.0 0.0 0.0 0.0 -1
301.4 302.6 303.5 304.1 304.4 304.7 310.8
7123.1 7336.7 7556.7 7783.2 8016.6 8257.0 8422.1
964.0 944.7 973.0 963.3 992.2 982.3 1001.9
5803.9 5957.8 6103.9 6216.3 6331.1 6317.8 6444.2
13299.5 13147.8 13535.6 13606.0 13943.0 13958.3 14237.5
2017 2018 2019 2020 2021 2022 2023
3786.9 3780.7 3643.4 3357.5 3747.8 3693.8 3767.6
-1133.67 -1162.98 -1107.61 -970.81 -1132.74 -1106.81 -1128.95 -1
-219.15 -220.10 -226.70 -233.50 -240.50 -247.71 -252.66
1.50 1.21 0.91 0.61 0.30 0.30 6.09
$37.1 ($19.3) $28.3 ($9.7) $28.9 ($9.9) $19.6
2472.7 2379.6 2338.4 2144.1 2403.7 2329.6 2411.8
2017 2018 2019 2020 2021 2022 2023
$2,094.4 $2,056.5 $1,958.1 $1,791.9 $2,002.8 $1,956.7 $1,996.0
$328.72 $330.15 $340.05 $350.25 $360.75 $371.56 $379.00
$11.00 $11.00 $11.00 $11.00 $11.00 $11.00 $11.00
1.50 1.21 0.91 0.61 0.30 0.30 6.09
37.08 -19.28 28.34 -9.73 28.90 -9.92 19.65
$2,472.7 $2,379.6 $2,338.4 $2,144.1 $2,403.7 $2,329.6 $2,411.8
19.63% 17.89% 17.79% 15.84% 17.67% 16.71% 17.28%
1771 2531 1951 2074 2067 2314 2133

More Related Content

Similar to Wassim Zhani Kroger Value.pdf

What Is A Financial Model
What Is A Financial ModelWhat Is A Financial Model
What Is A Financial Modelttgoods
 
Brunswick (BC) Pitch - Jonathan Chang - FINAL COPY
Brunswick (BC) Pitch - Jonathan Chang - FINAL COPYBrunswick (BC) Pitch - Jonathan Chang - FINAL COPY
Brunswick (BC) Pitch - Jonathan Chang - FINAL COPYJonathan Chang
 
ACG_Cup_-_Valuation
ACG_Cup_-_ValuationACG_Cup_-_Valuation
ACG_Cup_-_ValuationIke Ekeh
 
5YR Equity ValuationNOTE Rule of thumb - 20 growth in forecast o.docx
5YR Equity ValuationNOTE Rule of thumb - 20 growth in forecast o.docx5YR Equity ValuationNOTE Rule of thumb - 20 growth in forecast o.docx
5YR Equity ValuationNOTE Rule of thumb - 20 growth in forecast o.docxevonnehoggarth79783
 
GuessBox Financial Model 2017
GuessBox Financial Model 2017GuessBox Financial Model 2017
GuessBox Financial Model 2017GuessBox
 
Senario Analysis for Risk management in Corporate Finance
Senario Analysis for Risk management in Corporate FinanceSenario Analysis for Risk management in Corporate Finance
Senario Analysis for Risk management in Corporate FinanceIman Najafi
 
Investor Relations Site Graphics Placemat
Investor Relations Site Graphics PlacematInvestor Relations Site Graphics Placemat
Investor Relations Site Graphics Placematnelnetir
 
Investor Relations Site Graphics Placemat
Investor Relations Site Graphics PlacematInvestor Relations Site Graphics Placemat
Investor Relations Site Graphics Placematnelnetir
 
Swifton - TechStars - Aug 7 2015
Swifton - TechStars - Aug 7 2015Swifton - TechStars - Aug 7 2015
Swifton - TechStars - Aug 7 2015David Fogel, CPA
 
FIN 667 Hershey Valuation PPT- Final
FIN 667 Hershey Valuation PPT- FinalFIN 667 Hershey Valuation PPT- Final
FIN 667 Hershey Valuation PPT- FinalLisa Lee
 
September 2017 digital realty company overview
September 2017 digital realty company overviewSeptember 2017 digital realty company overview
September 2017 digital realty company overviewir_digitalrealty
 
SBUX ISIncome Statement - As Reported 10K in millionsIncome Statem.docx
SBUX ISIncome Statement - As Reported 10K in millionsIncome Statem.docxSBUX ISIncome Statement - As Reported 10K in millionsIncome Statem.docx
SBUX ISIncome Statement - As Reported 10K in millionsIncome Statem.docxtodd331
 
alltel 4q05supplement
alltel  4q05supplementalltel  4q05supplement
alltel 4q05supplementfinance27
 

Similar to Wassim Zhani Kroger Value.pdf (20)

What Is A Financial Model
What Is A Financial ModelWhat Is A Financial Model
What Is A Financial Model
 
proforma sample
proforma sampleproforma sample
proforma sample
 
Exhibits - Copy
Exhibits - CopyExhibits - Copy
Exhibits - Copy
 
Brunswick (BC) Pitch - Jonathan Chang - FINAL COPY
Brunswick (BC) Pitch - Jonathan Chang - FINAL COPYBrunswick (BC) Pitch - Jonathan Chang - FINAL COPY
Brunswick (BC) Pitch - Jonathan Chang - FINAL COPY
 
ACG Cup - Valuation
ACG Cup - ValuationACG Cup - Valuation
ACG Cup - Valuation
 
ACG_Cup_-_Valuation
ACG_Cup_-_ValuationACG_Cup_-_Valuation
ACG_Cup_-_Valuation
 
5YR Equity ValuationNOTE Rule of thumb - 20 growth in forecast o.docx
5YR Equity ValuationNOTE Rule of thumb - 20 growth in forecast o.docx5YR Equity ValuationNOTE Rule of thumb - 20 growth in forecast o.docx
5YR Equity ValuationNOTE Rule of thumb - 20 growth in forecast o.docx
 
GuessBox Financial Model 2017
GuessBox Financial Model 2017GuessBox Financial Model 2017
GuessBox Financial Model 2017
 
Senario Analysis for Risk management in Corporate Finance
Senario Analysis for Risk management in Corporate FinanceSenario Analysis for Risk management in Corporate Finance
Senario Analysis for Risk management in Corporate Finance
 
MF
MFMF
MF
 
Investor Relations Site Graphics Placemat
Investor Relations Site Graphics PlacematInvestor Relations Site Graphics Placemat
Investor Relations Site Graphics Placemat
 
Investor Relations Site Graphics Placemat
Investor Relations Site Graphics PlacematInvestor Relations Site Graphics Placemat
Investor Relations Site Graphics Placemat
 
IFF 2016 DCF
IFF 2016 DCFIFF 2016 DCF
IFF 2016 DCF
 
INVESTAURA_Business-Planning-Template.pdf
INVESTAURA_Business-Planning-Template.pdfINVESTAURA_Business-Planning-Template.pdf
INVESTAURA_Business-Planning-Template.pdf
 
Medicals Logistics
Medicals LogisticsMedicals Logistics
Medicals Logistics
 
Swifton - TechStars - Aug 7 2015
Swifton - TechStars - Aug 7 2015Swifton - TechStars - Aug 7 2015
Swifton - TechStars - Aug 7 2015
 
FIN 667 Hershey Valuation PPT- Final
FIN 667 Hershey Valuation PPT- FinalFIN 667 Hershey Valuation PPT- Final
FIN 667 Hershey Valuation PPT- Final
 
September 2017 digital realty company overview
September 2017 digital realty company overviewSeptember 2017 digital realty company overview
September 2017 digital realty company overview
 
SBUX ISIncome Statement - As Reported 10K in millionsIncome Statem.docx
SBUX ISIncome Statement - As Reported 10K in millionsIncome Statem.docxSBUX ISIncome Statement - As Reported 10K in millionsIncome Statem.docx
SBUX ISIncome Statement - As Reported 10K in millionsIncome Statem.docx
 
alltel 4q05supplement
alltel  4q05supplementalltel  4q05supplement
alltel 4q05supplement
 

More from Wassim Zhani

Wassim Zhani Federal Taxation Chapter 7 Overview of Deductions and Losses.pdf
Wassim Zhani Federal Taxation Chapter 7 Overview of Deductions and Losses.pdfWassim Zhani Federal Taxation Chapter 7 Overview of Deductions and Losses.pdf
Wassim Zhani Federal Taxation Chapter 7 Overview of Deductions and Losses.pdfWassim Zhani
 
Wassim Zhani Federal Taxation Chapter 8 Employee Business Expenses.pdf
Wassim Zhani Federal Taxation Chapter 8 Employee Business Expenses.pdfWassim Zhani Federal Taxation Chapter 8 Employee Business Expenses.pdf
Wassim Zhani Federal Taxation Chapter 8 Employee Business Expenses.pdfWassim Zhani
 
Wassim Zhani Federal Taxation Chapter 9 Capital Recovery Depreciation, Amorti...
Wassim Zhani Federal Taxation Chapter 9 Capital Recovery Depreciation, Amorti...Wassim Zhani Federal Taxation Chapter 9 Capital Recovery Depreciation, Amorti...
Wassim Zhani Federal Taxation Chapter 9 Capital Recovery Depreciation, Amorti...Wassim Zhani
 
Wassim Zhani Federal Taxation Chapter 5 Gross Income.pdf
Wassim Zhani Federal Taxation Chapter 5 Gross Income.pdfWassim Zhani Federal Taxation Chapter 5 Gross Income.pdf
Wassim Zhani Federal Taxation Chapter 5 Gross Income.pdfWassim Zhani
 
Wassim Zhani Federal Taxation Chapter 4 Personal and Dependency Examptions; F...
Wassim Zhani Federal Taxation Chapter 4 Personal and Dependency Examptions; F...Wassim Zhani Federal Taxation Chapter 4 Personal and Dependency Examptions; F...
Wassim Zhani Federal Taxation Chapter 4 Personal and Dependency Examptions; F...Wassim Zhani
 
Wassim Zhani Federal Taxation Chapter 1 An Overview of Federal Taxation.pdf
Wassim Zhani Federal Taxation Chapter 1 An Overview of Federal Taxation.pdfWassim Zhani Federal Taxation Chapter 1 An Overview of Federal Taxation.pdf
Wassim Zhani Federal Taxation Chapter 1 An Overview of Federal Taxation.pdfWassim Zhani
 
Wassim Zhani Federal Taxation Chapter 6 Gross Income Inclusions and exclusion...
Wassim Zhani Federal Taxation Chapter 6 Gross Income Inclusions and exclusion...Wassim Zhani Federal Taxation Chapter 6 Gross Income Inclusions and exclusion...
Wassim Zhani Federal Taxation Chapter 6 Gross Income Inclusions and exclusion...Wassim Zhani
 
Wassim Zhani Federal Taxation Chapter 2 Tax Practice and Research.pdf
Wassim Zhani Federal Taxation Chapter 2 Tax Practice and Research.pdfWassim Zhani Federal Taxation Chapter 2 Tax Practice and Research.pdf
Wassim Zhani Federal Taxation Chapter 2 Tax Practice and Research.pdfWassim Zhani
 
Wassim Zhani Federal Taxation Chapter 3 Taxable Entities; Tax Formula, Introd...
Wassim Zhani Federal Taxation Chapter 3 Taxable Entities; Tax Formula, Introd...Wassim Zhani Federal Taxation Chapter 3 Taxable Entities; Tax Formula, Introd...
Wassim Zhani Federal Taxation Chapter 3 Taxable Entities; Tax Formula, Introd...Wassim Zhani
 
Wassim Zhani Chapter 9 Taxation of Partnerships and Partners.pdf
Wassim Zhani Chapter 9 Taxation of Partnerships and Partners.pdfWassim Zhani Chapter 9 Taxation of Partnerships and Partners.pdf
Wassim Zhani Chapter 9 Taxation of Partnerships and Partners.pdfWassim Zhani
 
Wassim Zhani Chapter 17 Sources and Applications of Federal Tax Law.pdf
Wassim Zhani Chapter 17 Sources and Applications of Federal Tax Law.pdfWassim Zhani Chapter 17 Sources and Applications of Federal Tax Law.pdf
Wassim Zhani Chapter 17 Sources and Applications of Federal Tax Law.pdfWassim Zhani
 
Wassim Zhani Chapter 10 Partnership Distributions, dispositions of Partnershi...
Wassim Zhani Chapter 10 Partnership Distributions, dispositions of Partnershi...Wassim Zhani Chapter 10 Partnership Distributions, dispositions of Partnershi...
Wassim Zhani Chapter 10 Partnership Distributions, dispositions of Partnershi...Wassim Zhani
 
Wassim Zhani Chapter 7 Corporate Reorganizations.pdf
Wassim Zhani Chapter 7 Corporate Reorganizations.pdfWassim Zhani Chapter 7 Corporate Reorganizations.pdf
Wassim Zhani Chapter 7 Corporate Reorganizations.pdfWassim Zhani
 
Wassim Zhani Chapter 2 Corporate Formation and Capital Structure.pdf
Wassim Zhani Chapter 2 Corporate Formation and Capital Structure.pdfWassim Zhani Chapter 2 Corporate Formation and Capital Structure.pdf
Wassim Zhani Chapter 2 Corporate Formation and Capital Structure.pdfWassim Zhani
 
Wassim Zhani Chapter 16 Family Tax Planning.pdf
Wassim Zhani Chapter 16 Family Tax Planning.pdfWassim Zhani Chapter 16 Family Tax Planning.pdf
Wassim Zhani Chapter 16 Family Tax Planning.pdfWassim Zhani
 
Wassim Zhani Chapter 1 Income Taxation of Corporations.pdf
Wassim Zhani Chapter 1 Income Taxation of Corporations.pdfWassim Zhani Chapter 1 Income Taxation of Corporations.pdf
Wassim Zhani Chapter 1 Income Taxation of Corporations.pdfWassim Zhani
 
Wassim Zhani Chapter 15 Income Taxation of Estates and Trusts.pdf
Wassim Zhani Chapter 15 Income Taxation of Estates and Trusts.pdfWassim Zhani Chapter 15 Income Taxation of Estates and Trusts.pdf
Wassim Zhani Chapter 15 Income Taxation of Estates and Trusts.pdfWassim Zhani
 
Wassim Zhani Chapter 8 Consolidated Tax Returns.pdf
Wassim Zhani Chapter 8 Consolidated Tax Returns.pdfWassim Zhani Chapter 8 Consolidated Tax Returns.pdf
Wassim Zhani Chapter 8 Consolidated Tax Returns.pdfWassim Zhani
 
Wassim Zhani Chapter 5 Complete Liquidations.pdf
Wassim Zhani Chapter 5 Complete Liquidations.pdfWassim Zhani Chapter 5 Complete Liquidations.pdf
Wassim Zhani Chapter 5 Complete Liquidations.pdfWassim Zhani
 
Wassim Zhani Chapter 4 Corporate Dictributions Stock Redemptions and Partial ...
Wassim Zhani Chapter 4 Corporate Dictributions Stock Redemptions and Partial ...Wassim Zhani Chapter 4 Corporate Dictributions Stock Redemptions and Partial ...
Wassim Zhani Chapter 4 Corporate Dictributions Stock Redemptions and Partial ...Wassim Zhani
 

More from Wassim Zhani (20)

Wassim Zhani Federal Taxation Chapter 7 Overview of Deductions and Losses.pdf
Wassim Zhani Federal Taxation Chapter 7 Overview of Deductions and Losses.pdfWassim Zhani Federal Taxation Chapter 7 Overview of Deductions and Losses.pdf
Wassim Zhani Federal Taxation Chapter 7 Overview of Deductions and Losses.pdf
 
Wassim Zhani Federal Taxation Chapter 8 Employee Business Expenses.pdf
Wassim Zhani Federal Taxation Chapter 8 Employee Business Expenses.pdfWassim Zhani Federal Taxation Chapter 8 Employee Business Expenses.pdf
Wassim Zhani Federal Taxation Chapter 8 Employee Business Expenses.pdf
 
Wassim Zhani Federal Taxation Chapter 9 Capital Recovery Depreciation, Amorti...
Wassim Zhani Federal Taxation Chapter 9 Capital Recovery Depreciation, Amorti...Wassim Zhani Federal Taxation Chapter 9 Capital Recovery Depreciation, Amorti...
Wassim Zhani Federal Taxation Chapter 9 Capital Recovery Depreciation, Amorti...
 
Wassim Zhani Federal Taxation Chapter 5 Gross Income.pdf
Wassim Zhani Federal Taxation Chapter 5 Gross Income.pdfWassim Zhani Federal Taxation Chapter 5 Gross Income.pdf
Wassim Zhani Federal Taxation Chapter 5 Gross Income.pdf
 
Wassim Zhani Federal Taxation Chapter 4 Personal and Dependency Examptions; F...
Wassim Zhani Federal Taxation Chapter 4 Personal and Dependency Examptions; F...Wassim Zhani Federal Taxation Chapter 4 Personal and Dependency Examptions; F...
Wassim Zhani Federal Taxation Chapter 4 Personal and Dependency Examptions; F...
 
Wassim Zhani Federal Taxation Chapter 1 An Overview of Federal Taxation.pdf
Wassim Zhani Federal Taxation Chapter 1 An Overview of Federal Taxation.pdfWassim Zhani Federal Taxation Chapter 1 An Overview of Federal Taxation.pdf
Wassim Zhani Federal Taxation Chapter 1 An Overview of Federal Taxation.pdf
 
Wassim Zhani Federal Taxation Chapter 6 Gross Income Inclusions and exclusion...
Wassim Zhani Federal Taxation Chapter 6 Gross Income Inclusions and exclusion...Wassim Zhani Federal Taxation Chapter 6 Gross Income Inclusions and exclusion...
Wassim Zhani Federal Taxation Chapter 6 Gross Income Inclusions and exclusion...
 
Wassim Zhani Federal Taxation Chapter 2 Tax Practice and Research.pdf
Wassim Zhani Federal Taxation Chapter 2 Tax Practice and Research.pdfWassim Zhani Federal Taxation Chapter 2 Tax Practice and Research.pdf
Wassim Zhani Federal Taxation Chapter 2 Tax Practice and Research.pdf
 
Wassim Zhani Federal Taxation Chapter 3 Taxable Entities; Tax Formula, Introd...
Wassim Zhani Federal Taxation Chapter 3 Taxable Entities; Tax Formula, Introd...Wassim Zhani Federal Taxation Chapter 3 Taxable Entities; Tax Formula, Introd...
Wassim Zhani Federal Taxation Chapter 3 Taxable Entities; Tax Formula, Introd...
 
Wassim Zhani Chapter 9 Taxation of Partnerships and Partners.pdf
Wassim Zhani Chapter 9 Taxation of Partnerships and Partners.pdfWassim Zhani Chapter 9 Taxation of Partnerships and Partners.pdf
Wassim Zhani Chapter 9 Taxation of Partnerships and Partners.pdf
 
Wassim Zhani Chapter 17 Sources and Applications of Federal Tax Law.pdf
Wassim Zhani Chapter 17 Sources and Applications of Federal Tax Law.pdfWassim Zhani Chapter 17 Sources and Applications of Federal Tax Law.pdf
Wassim Zhani Chapter 17 Sources and Applications of Federal Tax Law.pdf
 
Wassim Zhani Chapter 10 Partnership Distributions, dispositions of Partnershi...
Wassim Zhani Chapter 10 Partnership Distributions, dispositions of Partnershi...Wassim Zhani Chapter 10 Partnership Distributions, dispositions of Partnershi...
Wassim Zhani Chapter 10 Partnership Distributions, dispositions of Partnershi...
 
Wassim Zhani Chapter 7 Corporate Reorganizations.pdf
Wassim Zhani Chapter 7 Corporate Reorganizations.pdfWassim Zhani Chapter 7 Corporate Reorganizations.pdf
Wassim Zhani Chapter 7 Corporate Reorganizations.pdf
 
Wassim Zhani Chapter 2 Corporate Formation and Capital Structure.pdf
Wassim Zhani Chapter 2 Corporate Formation and Capital Structure.pdfWassim Zhani Chapter 2 Corporate Formation and Capital Structure.pdf
Wassim Zhani Chapter 2 Corporate Formation and Capital Structure.pdf
 
Wassim Zhani Chapter 16 Family Tax Planning.pdf
Wassim Zhani Chapter 16 Family Tax Planning.pdfWassim Zhani Chapter 16 Family Tax Planning.pdf
Wassim Zhani Chapter 16 Family Tax Planning.pdf
 
Wassim Zhani Chapter 1 Income Taxation of Corporations.pdf
Wassim Zhani Chapter 1 Income Taxation of Corporations.pdfWassim Zhani Chapter 1 Income Taxation of Corporations.pdf
Wassim Zhani Chapter 1 Income Taxation of Corporations.pdf
 
Wassim Zhani Chapter 15 Income Taxation of Estates and Trusts.pdf
Wassim Zhani Chapter 15 Income Taxation of Estates and Trusts.pdfWassim Zhani Chapter 15 Income Taxation of Estates and Trusts.pdf
Wassim Zhani Chapter 15 Income Taxation of Estates and Trusts.pdf
 
Wassim Zhani Chapter 8 Consolidated Tax Returns.pdf
Wassim Zhani Chapter 8 Consolidated Tax Returns.pdfWassim Zhani Chapter 8 Consolidated Tax Returns.pdf
Wassim Zhani Chapter 8 Consolidated Tax Returns.pdf
 
Wassim Zhani Chapter 5 Complete Liquidations.pdf
Wassim Zhani Chapter 5 Complete Liquidations.pdfWassim Zhani Chapter 5 Complete Liquidations.pdf
Wassim Zhani Chapter 5 Complete Liquidations.pdf
 
Wassim Zhani Chapter 4 Corporate Dictributions Stock Redemptions and Partial ...
Wassim Zhani Chapter 4 Corporate Dictributions Stock Redemptions and Partial ...Wassim Zhani Chapter 4 Corporate Dictributions Stock Redemptions and Partial ...
Wassim Zhani Chapter 4 Corporate Dictributions Stock Redemptions and Partial ...
 

Recently uploaded

Independent Call Girls Andheri Nightlaila 9967584737
Independent Call Girls Andheri Nightlaila 9967584737Independent Call Girls Andheri Nightlaila 9967584737
Independent Call Girls Andheri Nightlaila 9967584737Riya Pathan
 
Call Girls In Radisson Blu Hotel New Delhi Paschim Vihar ❤️8860477959 Escorts...
Call Girls In Radisson Blu Hotel New Delhi Paschim Vihar ❤️8860477959 Escorts...Call Girls In Radisson Blu Hotel New Delhi Paschim Vihar ❤️8860477959 Escorts...
Call Girls In Radisson Blu Hotel New Delhi Paschim Vihar ❤️8860477959 Escorts...lizamodels9
 
Investment in The Coconut Industry by Nancy Cheruiyot
Investment in The Coconut Industry by Nancy CheruiyotInvestment in The Coconut Industry by Nancy Cheruiyot
Investment in The Coconut Industry by Nancy Cheruiyotictsugar
 
NewBase 19 April 2024 Energy News issue - 1717 by Khaled Al Awadi.pdf
NewBase  19 April  2024  Energy News issue - 1717 by Khaled Al Awadi.pdfNewBase  19 April  2024  Energy News issue - 1717 by Khaled Al Awadi.pdf
NewBase 19 April 2024 Energy News issue - 1717 by Khaled Al Awadi.pdfKhaled Al Awadi
 
2024 Numerator Consumer Study of Cannabis Usage
2024 Numerator Consumer Study of Cannabis Usage2024 Numerator Consumer Study of Cannabis Usage
2024 Numerator Consumer Study of Cannabis UsageNeil Kimberley
 
Youth Involvement in an Innovative Coconut Value Chain by Mwalimu Menza
Youth Involvement in an Innovative Coconut Value Chain by Mwalimu MenzaYouth Involvement in an Innovative Coconut Value Chain by Mwalimu Menza
Youth Involvement in an Innovative Coconut Value Chain by Mwalimu Menzaictsugar
 
India Consumer 2024 Redacted Sample Report
India Consumer 2024 Redacted Sample ReportIndia Consumer 2024 Redacted Sample Report
India Consumer 2024 Redacted Sample ReportMintel Group
 
Call Girls In Sikandarpur Gurgaon ❤️8860477959_Russian 100% Genuine Escorts I...
Call Girls In Sikandarpur Gurgaon ❤️8860477959_Russian 100% Genuine Escorts I...Call Girls In Sikandarpur Gurgaon ❤️8860477959_Russian 100% Genuine Escorts I...
Call Girls In Sikandarpur Gurgaon ❤️8860477959_Russian 100% Genuine Escorts I...lizamodels9
 
Global Scenario On Sustainable and Resilient Coconut Industry by Dr. Jelfina...
Global Scenario On Sustainable  and Resilient Coconut Industry by Dr. Jelfina...Global Scenario On Sustainable  and Resilient Coconut Industry by Dr. Jelfina...
Global Scenario On Sustainable and Resilient Coconut Industry by Dr. Jelfina...ictsugar
 
8447779800, Low rate Call girls in Tughlakabad Delhi NCR
8447779800, Low rate Call girls in Tughlakabad Delhi NCR8447779800, Low rate Call girls in Tughlakabad Delhi NCR
8447779800, Low rate Call girls in Tughlakabad Delhi NCRashishs7044
 
Marketplace and Quality Assurance Presentation - Vincent Chirchir
Marketplace and Quality Assurance Presentation - Vincent ChirchirMarketplace and Quality Assurance Presentation - Vincent Chirchir
Marketplace and Quality Assurance Presentation - Vincent Chirchirictsugar
 
Marketing Management Business Plan_My Sweet Creations
Marketing Management Business Plan_My Sweet CreationsMarketing Management Business Plan_My Sweet Creations
Marketing Management Business Plan_My Sweet Creationsnakalysalcedo61
 
Lowrate Call Girls In Sector 18 Noida ❤️8860477959 Escorts 100% Genuine Servi...
Lowrate Call Girls In Sector 18 Noida ❤️8860477959 Escorts 100% Genuine Servi...Lowrate Call Girls In Sector 18 Noida ❤️8860477959 Escorts 100% Genuine Servi...
Lowrate Call Girls In Sector 18 Noida ❤️8860477959 Escorts 100% Genuine Servi...lizamodels9
 
Market Sizes Sample Report - 2024 Edition
Market Sizes Sample Report - 2024 EditionMarket Sizes Sample Report - 2024 Edition
Market Sizes Sample Report - 2024 EditionMintel Group
 
Case study on tata clothing brand zudio in detail
Case study on tata clothing brand zudio in detailCase study on tata clothing brand zudio in detail
Case study on tata clothing brand zudio in detailAriel592675
 
8447779800, Low rate Call girls in New Ashok Nagar Delhi NCR
8447779800, Low rate Call girls in New Ashok Nagar Delhi NCR8447779800, Low rate Call girls in New Ashok Nagar Delhi NCR
8447779800, Low rate Call girls in New Ashok Nagar Delhi NCRashishs7044
 
FULL ENJOY Call girls in Paharganj Delhi | 8377087607
FULL ENJOY Call girls in Paharganj Delhi | 8377087607FULL ENJOY Call girls in Paharganj Delhi | 8377087607
FULL ENJOY Call girls in Paharganj Delhi | 8377087607dollysharma2066
 
Digital Transformation in the PLM domain - distrib.pdf
Digital Transformation in the PLM domain - distrib.pdfDigital Transformation in the PLM domain - distrib.pdf
Digital Transformation in the PLM domain - distrib.pdfJos Voskuil
 
Call US-88OO1O2216 Call Girls In Mahipalpur Female Escort Service
Call US-88OO1O2216 Call Girls In Mahipalpur Female Escort ServiceCall US-88OO1O2216 Call Girls In Mahipalpur Female Escort Service
Call US-88OO1O2216 Call Girls In Mahipalpur Female Escort Servicecallgirls2057
 
(Best) ENJOY Call Girls in Faridabad Ex | 8377087607
(Best) ENJOY Call Girls in Faridabad Ex | 8377087607(Best) ENJOY Call Girls in Faridabad Ex | 8377087607
(Best) ENJOY Call Girls in Faridabad Ex | 8377087607dollysharma2066
 

Recently uploaded (20)

Independent Call Girls Andheri Nightlaila 9967584737
Independent Call Girls Andheri Nightlaila 9967584737Independent Call Girls Andheri Nightlaila 9967584737
Independent Call Girls Andheri Nightlaila 9967584737
 
Call Girls In Radisson Blu Hotel New Delhi Paschim Vihar ❤️8860477959 Escorts...
Call Girls In Radisson Blu Hotel New Delhi Paschim Vihar ❤️8860477959 Escorts...Call Girls In Radisson Blu Hotel New Delhi Paschim Vihar ❤️8860477959 Escorts...
Call Girls In Radisson Blu Hotel New Delhi Paschim Vihar ❤️8860477959 Escorts...
 
Investment in The Coconut Industry by Nancy Cheruiyot
Investment in The Coconut Industry by Nancy CheruiyotInvestment in The Coconut Industry by Nancy Cheruiyot
Investment in The Coconut Industry by Nancy Cheruiyot
 
NewBase 19 April 2024 Energy News issue - 1717 by Khaled Al Awadi.pdf
NewBase  19 April  2024  Energy News issue - 1717 by Khaled Al Awadi.pdfNewBase  19 April  2024  Energy News issue - 1717 by Khaled Al Awadi.pdf
NewBase 19 April 2024 Energy News issue - 1717 by Khaled Al Awadi.pdf
 
2024 Numerator Consumer Study of Cannabis Usage
2024 Numerator Consumer Study of Cannabis Usage2024 Numerator Consumer Study of Cannabis Usage
2024 Numerator Consumer Study of Cannabis Usage
 
Youth Involvement in an Innovative Coconut Value Chain by Mwalimu Menza
Youth Involvement in an Innovative Coconut Value Chain by Mwalimu MenzaYouth Involvement in an Innovative Coconut Value Chain by Mwalimu Menza
Youth Involvement in an Innovative Coconut Value Chain by Mwalimu Menza
 
India Consumer 2024 Redacted Sample Report
India Consumer 2024 Redacted Sample ReportIndia Consumer 2024 Redacted Sample Report
India Consumer 2024 Redacted Sample Report
 
Call Girls In Sikandarpur Gurgaon ❤️8860477959_Russian 100% Genuine Escorts I...
Call Girls In Sikandarpur Gurgaon ❤️8860477959_Russian 100% Genuine Escorts I...Call Girls In Sikandarpur Gurgaon ❤️8860477959_Russian 100% Genuine Escorts I...
Call Girls In Sikandarpur Gurgaon ❤️8860477959_Russian 100% Genuine Escorts I...
 
Global Scenario On Sustainable and Resilient Coconut Industry by Dr. Jelfina...
Global Scenario On Sustainable  and Resilient Coconut Industry by Dr. Jelfina...Global Scenario On Sustainable  and Resilient Coconut Industry by Dr. Jelfina...
Global Scenario On Sustainable and Resilient Coconut Industry by Dr. Jelfina...
 
8447779800, Low rate Call girls in Tughlakabad Delhi NCR
8447779800, Low rate Call girls in Tughlakabad Delhi NCR8447779800, Low rate Call girls in Tughlakabad Delhi NCR
8447779800, Low rate Call girls in Tughlakabad Delhi NCR
 
Marketplace and Quality Assurance Presentation - Vincent Chirchir
Marketplace and Quality Assurance Presentation - Vincent ChirchirMarketplace and Quality Assurance Presentation - Vincent Chirchir
Marketplace and Quality Assurance Presentation - Vincent Chirchir
 
Marketing Management Business Plan_My Sweet Creations
Marketing Management Business Plan_My Sweet CreationsMarketing Management Business Plan_My Sweet Creations
Marketing Management Business Plan_My Sweet Creations
 
Lowrate Call Girls In Sector 18 Noida ❤️8860477959 Escorts 100% Genuine Servi...
Lowrate Call Girls In Sector 18 Noida ❤️8860477959 Escorts 100% Genuine Servi...Lowrate Call Girls In Sector 18 Noida ❤️8860477959 Escorts 100% Genuine Servi...
Lowrate Call Girls In Sector 18 Noida ❤️8860477959 Escorts 100% Genuine Servi...
 
Market Sizes Sample Report - 2024 Edition
Market Sizes Sample Report - 2024 EditionMarket Sizes Sample Report - 2024 Edition
Market Sizes Sample Report - 2024 Edition
 
Case study on tata clothing brand zudio in detail
Case study on tata clothing brand zudio in detailCase study on tata clothing brand zudio in detail
Case study on tata clothing brand zudio in detail
 
8447779800, Low rate Call girls in New Ashok Nagar Delhi NCR
8447779800, Low rate Call girls in New Ashok Nagar Delhi NCR8447779800, Low rate Call girls in New Ashok Nagar Delhi NCR
8447779800, Low rate Call girls in New Ashok Nagar Delhi NCR
 
FULL ENJOY Call girls in Paharganj Delhi | 8377087607
FULL ENJOY Call girls in Paharganj Delhi | 8377087607FULL ENJOY Call girls in Paharganj Delhi | 8377087607
FULL ENJOY Call girls in Paharganj Delhi | 8377087607
 
Digital Transformation in the PLM domain - distrib.pdf
Digital Transformation in the PLM domain - distrib.pdfDigital Transformation in the PLM domain - distrib.pdf
Digital Transformation in the PLM domain - distrib.pdf
 
Call US-88OO1O2216 Call Girls In Mahipalpur Female Escort Service
Call US-88OO1O2216 Call Girls In Mahipalpur Female Escort ServiceCall US-88OO1O2216 Call Girls In Mahipalpur Female Escort Service
Call US-88OO1O2216 Call Girls In Mahipalpur Female Escort Service
 
(Best) ENJOY Call Girls in Faridabad Ex | 8377087607
(Best) ENJOY Call Girls in Faridabad Ex | 8377087607(Best) ENJOY Call Girls in Faridabad Ex | 8377087607
(Best) ENJOY Call Girls in Faridabad Ex | 8377087607
 

Wassim Zhani Kroger Value.pdf

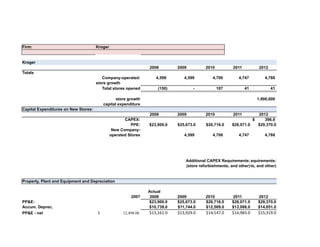
  • 1. Firm: Kroger Kroger 2008 2009 2010 2011 2012 Totals Company-operated: 4,599 4,599 4,706 4,747 4,788 store growth Total stores opened (150) - 107 41 41 store growth 1,900,000 capital expenditure Capital Expenditures on New Stores: 2008 2009 2010 2011 2012 CAPEX: $ 396.8 PPE: $23,900.0 $25,673.0 $26,716.0 $28,071.0 $29,370.0 New Company- operated Stores 4,599 4,706 4,747 4,788 Additional CAPEX Requirements: equirements: (store refurbishments, and other)ts, and other) Property, Plant and Equipment and Depreciation Actual 2007 2008 2009 2010 2011 2012 PP&E: $23,900.0 $25,673.0 $26,716.0 $28,071.0 $29,370.0 Accum. Deprec. $10,739.0 $11,744.0 $12,569.0 $13,088.0 $14,051.0 PP&E - net $ 12,498.00 $13,161.0 $13,929.0 $14,147.0 $14,983.0 $15,319.0
  • 2. CAPEX Forecasts from above: Depreciation Expense: $ 1,355.00 $ 1,443.00 $ 1,525.00 $ 1,600.00 $ 1,638.00 $ 1,652.00 PP&E in place at end of 2012: $ 15,319.0 Remaining balance to be depreciated. PP&E Purchases: Capex 2012 455.7 Capex 2013 515.2 Capex 2014 572.3 Capex 2015 624.5 Capex 2016 681.4 Capex 2017 743.6 Capex 2018 811.5 Capex 2019 885.6 Capex 2020 966.6 Capex 2021 1055.1 Capex 2022 0.0 Total Depreciation Expense 2008 2009 2010 2011 2012 Depreciation methods: Gross PPE $ 23,900 $ 25,673 $ 26,716 $ 28,071 $ 29,370 Depreciable PPE $ 5,365 $ 25,496 $ 26,484 $ 27,899 $ 29,060 Average Depreciable PPE $ 15,430 $ 25,990 $ 27,192 $ 28,479 Depreciation Expense $1,525.0 $1,600.0 $1,638.0 $1,652.0 Implied Average Useful Life in Years 10.1 16.2 16.6 17.2
  • 3. Forecasts: Numbers of Stores 2013 2014 2015 2016 2017 2018 2019 2020 2021 2022 4,828 4,868 4,908 4,948 4,988 5,028 5,068 5,108 5,148 5,188 0.84% 0.83% 0.82% 0.81% 0.81% 0.80% 0.80% 0.79% 0.78% 0.78% 40 40 40 40 40 40 40 40 40 40 0.84% 0.83% 0.82% 0.81% 0.81% 0.80% 0.80% 0.79% 0.78% 0.78% 2,200,000 2,508,000 2,808,960 3,089,856 3,398,842 3,738,726 4,112,598 4,523,858 4,976,244 5,473,868 16% 14% 12% 10% 10% 10% 10% 10% 10% 10% CAPEX Forecasts: 2013 2014 2015 2016 2017 2018 2019 2020 2021 2022 $455.7 $515.2 $572.3 $624.5 $681.4 $743.6 $811.5 $885.6 $966.6 $1,055.1 4,828 4,868 4,908 4,948 4,988 5,028 5,068 5,108 5,148 5,188 CAPEX Inflation Forecast: 3% 3% 3% 3% 3% 3% 3% 3% 3% 3% *assume they refurbish each store every __ years and it costs 25% of original build-out Property, Plant and Equipment and Depreciation Forecasts: Forecast: 2013 2014 2015 2016 2017 2018 2019 2020 2021 2022 2023 29825.7 30340.9 30913.2 31537.7 32219.1 32962.6 33774.1 34659.8 35626.4 36681.5 37782.0 12320.9 10560.9 8767.7 6938.3 -1731.3 -1939.7 -2195.1 -2502.0 -2864.9 -3289.0 -3387.7 42146.6 40901.8 39680.9 38476.0 30487.8 31023.0 31579.0 32157.8 32761.5 33392.5 0.0
  • 4. 455.7 515.2 572.3 624.5 681.4 743.6 811.5 885.6 966.6 1055.1 0.0 1703.7 1703.7 1703.7 1703.7 8504.3 0.0 0.0 0.0 0.0 0.0 0.0 13615.3 11911.7 10208.0 8504.3 0.0 0.0 0.0 0.0 0.0 0.0 0.0 26.4 26.4 26.4 26.4 26.4 26.4 26.4 26.4 26.4 26.4 26.4 29.9 29.9 29.9 29.9 29.9 29.9 29.9 29.9 29.9 29.9 33.2 33.2 33.2 33.2 33.2 33.2 33.2 33.2 33.2 36.2 36.2 36.2 36.2 36.2 36.2 36.2 36.2 39.5 39.5 39.5 39.5 39.5 39.5 39.5 43.1 43.1 43.1 43.1 43.1 43.1 47.1 47.1 47.1 47.1 47.1 51.4 51.4 51.4 51.4 56.1 56.1 56.1 61.2 61.2 0.0 1730.1 1760.0 1793.2 1829.4 8669.6 208.4 255.5 306.8 362.9 424.1 98.7 98.7 3% (remove land and work in progress)
  • 5.
  • 6. 15319.0 290.8 17.6 316.5 33.2 19.6 351.6 36.2 36.2 21.4 383.6 39.5 39.5 39.5 23.3 418.6 43.1 43.1 43.1 43.1 25.4 456.8 47.1 47.1 47.1 47.1 47.1 27.7 498.5 51.4 51.4 51.4 51.4 51.4 51.4 30.3 544.0 56.1 56.1 56.1 56.1 56.1 56.1 56.1 33.1 593.8 61.2 61.2 61.2 61.2 61.2 61.2 61.2 61.2 36.1 648.1 0.0 0.0 0.0 0.0 0.0 0.0 0.0 0.0 0.0 0.0 assumption for long run growth rate
  • 7. Firm: Kroger Kroger: Income Statement Forecasts Actual Forecasts (Thousands) 2012 2013 2014 2015 2016 2017 Total net revenues $ 96,751.00 $100,621.0 $104,645.9 $108,831.7 $112,096.7 $116,580.5 2011 Total net revenues $ 90,374.00 4% 4% 4.0% 3% 4% implied growth 7.1% Marchandise costs $ 76,858 79893 83193 86521 89117 92682 79.4% 79.4% 79.5% 79.5% 79.5% 79.5% Gross Profit $19,893 $20,728 $21,452 $22,311 $22,980 $23,899 implied margins 20.6% 20.6% 20.5% 20.5% 20.5% 20.5% Operating, General and Administrative $ 14,849 $ 15,395 $ 16,011 $ 16,651 $ 16,815 $ 17,487 15.3% 15.3% 15.3% 15.3% 15.0% 15.0% Rent $ 628 $ 805 $ 837 $ 871 $ 897 $ 933 0.6% 0.8% 0.8% 0.8% 0.8% 0.8% Depreciation and amortization expenses $ 1,652 $ 1,765 $ 1,784 $ 1,630 $ 1,653 $ 1,692 12% 12% 12% 12% 12% Operating income $2,764.0 $2,762.6 $2,820.1 $3,158.5 $3,615.8 $3,786.9 implied margins 2.9% 2.7% 2.7% 2.9% 3.2% 3.2% Interest expense ($462) ($521) ($525) ($524) ($519) ($548) interest rate on financial liabilities 7.0% 7.0% 7.5% 7.5% 7.5% Earnings before income taxes $2,302 $2,242 $2,295 $2,634 $3,097 $3,239 Income taxes $ 794 $ 785 $ 803 $ 922 $ 1,084 $ 1,134 effective tax rate assumption (10-K, p.26 mgt. provided) 35.0% 35.0% 35.0% 35.0% 35.0% 35.0% Net earnings including noncontrolling interes $1,508 $1,457 $1,492 $1,712 $2,013 $2,105 Net earnings attributable to noncontrolling in $11 $11 $11 $11 $11 $11
  • 8. Net earnings attributable to Kroger $1,497 $1,446 $1,481 $1,701 $2,002 $2,094
  • 9. Kroger: Balance Sheet Forecasts (Thousands) Actual Forecasts ASSETS 2012 2013 2014 2015 2016 2017 Current assets: Cash and temporary cash investments $238.0 0.0 0.0 0.0 165.5 0.0 days sales in cash 1.7 1.7 1.7 1.7 1.7 Deposits in-transit 955.00 974.7 1032.2 1055.0 1033.4 1074.7 percentage of total assets 3.50 3.50 3.50 3.40 3.30 Receivables $1,051.0 1071.7 1135.9 1070.5 1140.7 1159.0 percentage of total assets 3.85 3.85 3.70 3.60 3.60 FIFO inventory $6,244.0 6437.0 6464.5 6654.9 6858.1 6876.0 turnover assumption (in days) 23.0 22.5 22.0 22.0 21.5 LIFO reserve ($1,098.0) -1029.9 -1099.0 -1197.9 -1234.5 -1237.7 turnover assumption (in days) 0.18 0.16 0.17 0.18 0.18 0.18 Prefunded employee benefits $0.0 0.0 0.0 0.0 0.0 0.0 percentage of total assets Prepaid expenses and other current assets $569.0 539.4 520.4 518.7 550.9 564.1 percentage of total assets 2.2% 2.1% 2.1% 2.2% 2.2% Total current assets $7,959.0 $7,992.9 $8,054.1 $8,101.2 $8,514.2 $8,436.1 Property, plant and equipment, net $14,875.0 14710.85 14869.07 14819.33 15024.98 15384.98 60.0% 60.0% 60.0% 60.0% 60.0% Other assets $584.0 588.4 594.8 568.1 500.8 538.5 percentage of total assets 2.4% 2.4% 2.3% 2.0% 2.1% Goodwill $1,234.0 1225.9 1263.9 1210.2 1001.7 1282.1 percentage of total assets 5.0% 5.1% 4.9% 4.0% 5.0% TOTAL ASSETS $24,652.0 $24,518.1 $24,781.8 $24,698.9 $25,041.6 $25,641.6 LIABILITIES AND SHAREHOLDERS EQUITY Current liabilities:
  • 10. $2,734.0 $1,109.1 $986.9 $275.4 $0.0 $181.8 % of total debt 16.00% 16.00% 16.00% 16.00% 16.00% Trade accounts payable $4,524.0 4607.7 4560.1 4751.3 4894.3 4825.4 Turnover assumption (in days) 21.00 20.00 20.00 20.00 19.00 Accrued salaries and wages $977.0 1003.4 1030.5 1057.3 1083.7 1109.7 % of total assets 2.70% 2.70% 2.6% 2.5% 2.4% Deferred income taxes $284.0 291.1 295.5 298.4 299.9 301.4 grow with sales 2.5% 1.5% 1.0% 0.5% 0.5% Other current liabilities $2,538.0 $2,558.3 $2,578.8 $2,599.4 $2,620.2 $2,641.2 grow with company stores 0.80% 0.80% 0.80% 0.80% 0.80% Total current liabilities $11,057.0 $9,569.6 $9,451.7 $8,981.8 $8,898.1 $9,059.5 $6,141.0 6325 6515 6710 6912 7119 % of total equity 10961.3 11157.2 11427.1 11704.6 12014.1 $4.0 $4.0 $4.0 $4.0 $4.0 $4.0 Long-term debt including obligations under c $6,145.0 $6,329.2 $6,519.0 $6,714.4 $6,915.7 $7,123.1 Deferred income taxes $800.0 $832.0 $865.3 $899.9 $926.9 $964.0 grow with Sale 4.00% 4.00% 4.00% 3.00% 4.00% Pension and postretirement benefit obligatio $1,291.0 $1,337.8 $1,392.5 $1,409.7 $1,464.5 $1,499.6 %of accrual salaries 75% 74% 75% 74% 74% Other long-term liabilities $1,145.0 $1,154.2 $1,163.4 $1,172.7 $1,182.1 $1,191.5 % of store growth 0.80% 0.80% 0.80% 0.80% 0.80% TOTAL LIABILITIES $20,438.0 $19,222.8 $19,391.8 $19,178.5 $19,387.2 $19,837.7 Preferred shares, $100 par per share, 5 share $0.0 $0.0 $0.0 $0.0 $0.0 $0.0 $959.0 959.0 959.0 959.0 959.0 959.0 Current portion of long-term debt including obligations under capital leases and financing obligations Face-value of long-term debt including obligations under capital leases and financing obligations Adjustment related to fair-value of interest rate hedges Common shares, $1 par per share, 1,000 shares authorized; 959 shares issued in 2011 and 2010
  • 11. Additional paid-in capital $3,451.0 3485.5 3485.5 3485.5 3485.5 3485.5 Accumulated other comprehensive loss ($753.0) ($783.1) ($814.4) ($847.0) ($880.9) ($916.1) Accumulated earnings $9,787.0 10963.3 11182.5 11439.7 11702.9 11983.7 Common stock in treasury, at cost, 398 shares ($9,237.0) -9329.4 -9422.7 -9516.9 -9612.1 -9708.2 Total Shareowners’ Equity $4,207.0 5295.3 5389.9 5520.3 5654.4 5803.9 Noncontrolling interests $7.0 $7.0 $7.0 $7.0 $7.0 $7.0 Total equity $4,214.0 $5,295.3 $5,389.9 $5,520.3 $5,654.4 $5,803.9 TOTAL LIABILITIES AND SHAREHOLDERS EQUI $24,652.0 $24,518.1 $24,781.8 $24,698.9 $25,041.6 $25,641.6 implied debt/equity ratios 1.405 1.393 1.266 1.223 1.259 check: balance sheet balance? 0.0 0.0 0.0 0.0 0.0 Normal dividend payout forecast: 267.0 267.0 267.0 267.0 267.0 Plug: -10.0 -1001.3 -1184.1 -1479.0 -1553.5 Total implied dividends: 277.0 1268.3 1451.1 1746.0 1820.5
  • 12. kroger: Implied Statement of Cash Flows Forecasts Forecasts Implied Cash Flows: 2012 2013 2014 2015 2016 2017 Operations: Net earnings including noncontrolling interest 1508.00 1457.28 1491.57 1712.25 2013.12 2105.40 Depreciation and amortization 1652.00 1765.30 1784.29 1630.13 1652.75 1692.35 Goodwill impairment charge 0.00 0.00 0.00 0.00 0.00 0.00 Asset impairment charge 18.00 20.00 18.00 19.00 18.00 18.00 LIFO charge 55.00 111.85 116.47 121.13 124.76 129.75 Stock-based employee compensation 82.00 80.00 80.00 80.00 80.00 80.00 Expense for Company-sponsored pension pla 89.00 93.00 97.00 101.00 105.00 109.00 Deferred income taxes 176.00 -7.10 -4.37 -2.95 -1.49 -1.50 Other 17.00 23.17 29.34 35.51 41.68 47.85 Store deposits in-transit -169.00 -112.17 -177.17 -120.34 -185.34 -128.51 average 56.83 -65.00 56.83 -65.00 56.83 Inventories -78.00 -193.01 -27.53 -190.36 -203.22 -17.90 Receivables -126.00 -20.69 -64.22 65.36 -70.13 -18.31 Prepaid expenses -257.00 29.60 18.98 1.74 -32.24 -13.20 Trade accounts payable 58.00 -83.69 47.64 -191.26 -142.93 68.80 Accrued expenses 76.00 -26.38 -27.09 -26.79 -26.43 -26.01 Income taxes receivable and payable 164.00 -39.10 -37.65 -37.57 -28.49 -38.58 Contribution to Company-sponsored pension -71.00 -90.40 -109.80 -129.20 -148.60 -168.00 average -19.40 -19.40 -19.40 -19.40 -19.40 Other -361.00 -402.17 -443.34 -484.51 -525.68 -566.85 average -41.17 -41.17 -41.17 -41.17 -41.17 Adjustments to reconcile net earnings to net cash provided by Operating activities: Changes in operating assets and liabilities net of effects from acquisitions of businesses:
  • 13. Net cash provided by operating activities 2833.00 2662.32 2727.12 2639.96 2605.76 3329.12
  • 14. Terminal Growth Factor 1.02 Terminal 2018 2019 2020 2021 2022 2023 $114,248.9 $117,676.4 $116,499.6 $119,994.6 $118,794.7 $121,170.6 -2% 3% -1% 3% -1% 2% 90828 94141 93200 95996 95036 96936 79.5% 80.0% 80.0% 80.0% 80.0% 79.0% $23,421 $23,535 $23,300 $23,999 $23,759 $24,234 20.5% 20.0% 20.0% 20.0% 20.0% 20.0% $ 17,023 $ 17,298 $ 17,358 $ 17,639 $ 17,463 $ 17,812 14.9% 14.7% 14.9% 14.7% 14.7% $ 914 $ 941 $ 932 960.0 950.4 969.4 0.8% 0.8% 0.8% 0.8% 0.8% $ 1,703 $ 1,652 $ 1,652 $ 1,652 $ 1,652 $ 1,685 12% 12% 12% 12% 12% $3,780.7 $3,643.4 $3,357.5 $3,747.8 $3,693.8 $3,767.6 3.3% 3.1% 2.9% 3.1% 3.1% 3.1% ($550) ($567) ($584) ($601) ($619) ($632) 7.5% 7.5% 7.5% 7.5% 7.5% $3,230 $3,077 $2,774 $3,147 $3,074 $3,136 $ 1,163 $ 1,108 $ 971 $ 1,133 $ 1,107 $ 1,129 36.0% 36.0% 35.0% 36.0% 36.0% $2,068 $1,969 $1,803 $2,014 $1,968 $2,007 $11 $11 $11 $11 $11 $11
  • 15. $2,057 $1,958 $1,792 $2,003 $1,957 $1,996
  • 16. Terminal Growth Factor 1.02 Terminal 2018 2019 2020 2021 2022 2023 340.2 263.0 629.1 629.3 827.6 844.1 1.7 1.7 1.7 1.7 1.7 1053.8 1138.5 1031.9 1072.1 1076.0 1097.5 3.40 3.40 3.40 3.20 3.30 1157.3 1228.5 1133.4 1299.3 1174.2 1197.7 3.70 3.70 3.70 3.70 3.80 6896.5 6966.8 7077.0 7059.4 7065.8 7207.1 22.0 21.5 22.0 21.5 21.7 -1241.4 -1254.0 -1273.9 -1270.7 -1271.8 -1297.3 0.18 0.18 0.18 0.18 0.18 0.0 0.0 0.0 0.0 0.0 0.0 567.7 577.2 585.6 598.7 604.3 616.3 2.2% 2.2% 2.2% 2.2% 2.2% $8,774.1 $8,919.9 $9,183.1 $9,388.1 $9,476.0 $9,665.5 15483.69 15740.99 15970.63 16327.07 16479.93 16809.53 60.0% 60.0% 60.0% 60.0% 60.0% 516.1 524.7 532.4 544.2 549.3 560.3 2.0% 2.0% 2.0% 2.0% 2.0% 1032.2 1049.4 931.6 952.4 961.3 980.6 4.0% 4.0% 3.5% 3.5% 3.5% $25,806.1 $26,235.0 $26,617.7 $27,211.8 $27,466.5 $28,015.9
  • 17. $0.0 $0.0 $0.0 $0.0 $0.0 $0.0 16.00% 16.00% 16.00% 16.00% 16.00% 4729.1 4646.0 4601.6 4733.2 4687.0 4780.8 19.00 18.00 18.00 18.00 18.00 1136.3 1163.6 1191.5 1214.2 1236.0 1260.7 2.4% 2.4% 2.4% 1.9% 1.8% 302.6 303.5 304.1 304.4 304.7 310.8 0.4% 0.3% 0.2% 0.1% 0.1% $2,662.3 $2,683.6 $2,705.1 $2,726.7 $2,748.5 2803.5 0.80% 0.80% 0.80% 0.80% 0.80% $8,830.3 $8,796.8 $8,802.3 $8,978.5 $8,976.3 $9,155.8 7333 7553 7779 8013 8253 8418.1 12332.6 12635.0 12867.7 13105.4 13077.9 $4.0 $4.0 $4.0 $4.0 $4.0 $4.08 $7,336.7 $7,556.7 $7,783.2 $8,016.6 $8,257.0 $8,422.1 $944.7 $973.0 $963.3 $992.2 $982.3 $1,001.9 -2.00% 3.00% -1.00% 3.00% -1.00% $1,535.6 $1,594.0 $1,632.2 $1,663.3 $1,693.2 $1,727.1 74% 73% 73% 73% 73% $1,201.1 $1,210.7 $1,220.4 $1,230.1 $1,240.0 $1,264.8 0.80% 0.80% 0.80% 0.80% 0.80% $19,848.4 $20,131.1 $20,401.4 $20,880.7 $21,148.7 $21,571.7 $0.0 $0.0 $0.0 $0.0 $0.0 $0.0 959.0 959.0 959.0 959.0 959.0 978.2
  • 18. 3485.5 3485.5 3485.5 3485.5 3485.510 3555.220 ($952.8) ($990.9) ($1,030.5) ($1,071.8) ($1,114.6) -1136.9 12271.3 12553.6 12804.6 13060.7 13191.3 13455.2 -9805.3 -9903.3 -10002.3 -10102.4 -10203.4 -10407.462 5957.8 6103.9 6216.3 6331.1 6317.8 6444.2 $7.0 $7.0 $7.0 $7.0 $7.0 $7.0 $5,957.8 $6,103.9 $6,216.3 $6,331.1 $6,317.8 $6,444.2 $25,806.1 $26,235.0 $26,617.7 $27,211.8 $27,466.5 $28,015.9 1.231 1.238 1.252 1.266 1.307 1.307 0.0 0.0 0.0 0.0 0.0 0.0 267.0 267.0 267.0 267.0 267.0 267.0 -1508.9 -1415.8 -1280.9 -1486.7 -1566.1 -1472.2 1775.9 1682.8 1547.9 1753.7 1833.1 1739.2
  • 19. Terminal 1.02 1.02 2018 2019 2020 2021 2022 2023 2067.51 1969.08 1802.93 2013.77 1967.67 2007.02 1703.21 1652.00 1652.00 1652.00 1652.00 1685.04 0.00 0.00 0.00 0.00 0.00 0.00 18.00 18.00 18.00 18.00 18.00 18.36 127.16 131.80 130.48 134.39 133.05 135.71 80.00 80.00 80.00 80.00 80.00 80.00 113.00 117.00 121.00 125.00 129.00 131.58 -1.21 -0.91 -0.61 -0.30 -0.30 -6.09 54.02 60.19 66.36 72.53 78.70 84.87 -193.51 -136.68 -201.68 -144.85 -209.85 -214.05 -65.00 56.83 -65.00 56.83 -65.00 -20.43 -70.35 -110.20 17.64 -6.46 -141.32 1.71 -71.19 95.05 -165.91 125.14 -23.48 -3.62 -9.43 -8.42 -13.07 -5.60 -12.09 96.36 83.05 44.46 -131.58 46.15 -93.74 -26.63 -27.27 -27.93 -22.64 -21.86 -24.72 18.07 -29.25 9.12 -29.20 9.62 -25.74 -187.40 -206.80 -226.20 -245.60 -265.00 -270.30 -19.40 -19.40 -19.40 -19.40 -19.40 -608.02 -649.19 -690.36 -731.53 -772.70 -788.15 -41.17 -41.17 -41.17 -41.17 -41.17
  • 20. 3173.22 2966.87 2689.01 2685.47 2892.56 2542.90
  • 21. 371377193.xlsx Professor Matt Wieland Valuation Models **Go to Tools, Options, Calculations tab, and click on "Iteration" to allow changes to flow through. 3/21/2013 Firm: Starbucks Analyst: A517 (insert forecast assumptions in blue font cells.) Valuation Parameter Assumptions: WACC Computations: Forecasts: 2013 2014 2015 2016 Equity: Risk-free rate 2.2% 0.73 finance.yahoo.com Beta 0.65 0.6 value line Market risk premium 4% 0.38 google Equity cost of capital 4.93% 0.37 S&P 0.52 Shares Outstanding: 537.00 537.00 537.00 537.00 537.00 Market (Intrinsic) Value ps 23.46 24.62 25.83 27.10 28.44 Market Value total 12598.0 13219.1 13870.8 14554.6 15272.2 Debt: 35% 35% 35% 35% 35% Total debt capital 8879.0 7438.3 7505.9 6989.9 6915.7 cost of debt 6.1% 6.1% 6.1% 6.1% 6.1% 1-Tax rate 65.0% 65.0% 65.0% 65.0% 65.0% Cost of equity 4.93% 4.93% 4.93% 4.93% 4.93% Total capital (d+e) 21477.0 20036.3 20103.9 19587.9 19513.8 Equity Weight 0.59 0.63 0.63 0.64 0.65 Debt Weight: 0.41 0.37 0.37 0.36 0.35 WACC 4.53% 4.57% 4.57% 4.59% 4.59% WACC Discount Factors
  • 23. 371377193.xlsx Valuation: Residual Income 1 2 3 4 2013 2014 2015 2016 Net Earnings 1446.3 1480.6 1701.2 2002.1 Lagged Book Value Equity 4214.0 5295.3 5389.9 5520.3 Normal Earnings (Re * BVt-1) 207.8 261.1 265.7 272.2 Abnormal Earnings 1238.5 1219.5 1435.5 1730.0 Present Value Factors 0.953 0.908 0.866 0.825 PV Abnormal Earnings 1180.3 1107.6 1242.5 1427.1 Sum PV Abnormal Earnings thru Year +10 12,030.6 Sensitivity to growth PV of Continuing Abnormal Earnings 35,532.1 98.80 Add: Beginning Book Value of Equity 4,214.0 0% PV of Equity 51,776.7 1% 2% Adjust to midyear 1.02 3% Total PV Abnormal Earnings 53,053.01 4% Shares Outstanding 537.00 Estimated Value per Share 99 Valuation: Dividends 1 2 3 4 2013 2014 2015 2016 Dividends 277.0 1268.3 1451.1 1746.0 (1+Re) 1.049 1.101 1.155 1.212 V0 264.0 1151.9 1256.0 1440.3 Sum of V0 11398.8 D t+1 1390.9 1404.3 1627.5 1931.8 Earnings 1446 1481 1701 2002 (1+g) 1.020 1.020 1.020 1.020 Earnings*(1+g) 1475.2 1510.2 1735.3 2042.2
  • 24. 371377193.xlsx BV t 4214.0 5295.3 5389.9 5520.3 BV t * (1+g) 4298.3 5401.2 5497.7 5630.7 (Re-g) 2.93% 2.93% 2.93% 2.93% Vt PV of Vt 40,278.69 V 51677.5 Sensitivity to growth Midterm year 1.02 98 V 52711.06 0% 1% #REF! Shares outstanding 537.00 2% #REF! Value Per Share 98 3% #REF!
  • 25. 371377193.xlsx 4% #REF! Valuation: Free Cash Flow for Common Equity Ending Invested capital 14237.48 ROIC beyond horizon 15.80% cost of equity 4.93% growth 2.0% Horizon value 67057.07 Present value of horizon 41442.68 PV of FCF 17580.63 Total PV 59023.31 Midterm Year 1.02 Value of operation 60203.78 Add non operating assets Cash and temporary cash investments 238.00 Deposits in-transit 955.00 Value of enterprise 61396.78 Deduct debt 2734 6145 Noncontrolling interests 7 Total deduction 8886 Value of Common equity 52510.78 Shares outstanding 537.00 Current portion of long-term debt including obligations under capital leases and financing obligations Long-term debt including obligations under capital leases and financing
  • 27. 371377193.xlsx 2017 2018 2019 2020 2021 2022 finance.yahoo.com 537.00 537.00 537.00 537.00 537.00 537.00 29.84 31.31 32.86 34.48 36.18 37.96 Cost of Capital - Heinz 2,012 16025.1 16815.1 17644.1 18514.0 19426.7 20384.5 Share price at January 28, 2012 $23.46 Shares outstanding, January 2012 537.00 Market value of equity, in thousands 12,598 35% 35% 35% 35% 35% 35% 7304.9 7336.7 7556.7 7783.2 8016.6 8257.0 Portion of long-term debt due within one year 2,734 6.1% 6.1% 6.1% 6.1% 6.1% 6.1% long term debt 6,145 65.0% 65.0% 65.0% 65.0% 65.0% 65.0% Market value of debt 8,879 4.93% 4.93% 4.93% 4.93% 4.93% 4.93% 19902.9 19934.7 20154.7 20381.3 20614.6 20855.0 0.63 0.63 0.63 0.62 0.61 0.60 Total market value 21,477 0.37 0.37 0.37 0.38 0.39 0.40 Weight of equity 0.59 Weight of debt 0.41 4.58% 4.57% 4.57% 4.56% 4.55% 4.55% Risk-free rate (recent 10-yr Treasury rate) 2.20%
  • 29. 371377193.xlsx 5 6 7 8 9 10 11 2017 2018 2019 2020 2021 2022 2023 2094.4 2056.5 1958.1 1791.9 2002.8 1956.7 1996.0 5654.4 5803.9 5957.8 6103.9 6216.3 6331.1 6317.8 278.8 286.1 293.7 300.9 306.5 312.1 311.5 1815.6 1770.4 1664.4 1491.0 1696.3 1644.5 1684.6 0.786 0.749 0.714 0.680 0.648 0.618 0.029 (Re - g) 1427.3 1326.4 1188.4 1014.6 1100.0 1016.4 57,493.3 Sensitivity to discount rate 0.618 98.80 35,532.1 3% 4% 5% 6% 7% 8% 5 6 7 8 9 10 11 2017 2018 2019 2020 2021 2022 2023 1820.5 1775.9 1682.8 1547.9 1753.7 1833.1 1739.2 1.272 1.335 1.401 1.470 1.542 1.618 1431.2 1330.5 1201.6 1053.3 1137.2 1132.9 2023.2 1981.6 1878.1 1705.7 1918.5 1869.2 1909.6 2094 2057 1958 1792 2003 1957 1996 1.020 1.020 1.020 1.020 1.020 1.020 1.020 2136.3 2097.6 1997.2 1827.8 2042.8 1995.8 2035.9
  • 30. 371377193.xlsx 5654.4 5803.9 5957.8 6103.9 6216.3 6331.1 6317.8 5767.5 5920.0 6077.0 6225.9 6340.6 6457.7 6444.2 2.93% 2.93% 2.93% 2.93% 2.93% 2.93% 2.93% 65174 Sensitivity to discount rate 98 3.0% 4.0% #REF! 5.0% #REF! 6.0% #REF!
  • 32. 371377193.xlsx 2013 2014 2015 2016 2017 2018 2019 2020 2021 2022 $23.46 $23.46 $23.46 $23.46 $23.46 $23.46 $23.46 $23.46 $23.46 $23.46 537.00 537.00 537.00 537.00 537.00 537.00 537.00 537.00 537.00 537.00 12,598 12,598 12,598 12,598 12,598 12,598 12,598 12,598 12,598 12,598 1,109 987 275 0 182 0 0 0 0 0 6,329 6,519 6,714 6,916 7,123 7,337 7,557 7,783 8,017 8,257 7,438 7,506 6,990 6,916 7,305 7,337 7,557 7,783 8,017 8,257 20,036 20,104 19,588 19,514 19,903 19,935 20,155 20,381 20,615 20,855 0.63 0.63 0.64 0.65 0.63 0.63 0.63 0.62 0.61 0.60 0.37 0.37 0.36 0.35 0.37 0.37 0.37 0.38 0.39 0.40
  • 33. Firm: kroger kroger: Income Statement Forecasts Actual Forecasts (Thousands) 2012 2013 2014 2015 2016 Total net revenues $ 96,751.00 $100,621.0 $104,645.9 $108,831.7 $112,096.7 2011 Total net revenues $ 90,374.00 4% 4% 4.0% 3% implied growth 7.1% Marchandise costs $ 76,858.00 79893.1 83193.5 86521.2 89116.9 79.4% 79.4% 79.5% 79.5% 79.5% Gross Profit $19,893.0 $20,727.9 $21,452.4 $22,310.5 $22,979.8 implied margins 20.6% 20.6% 20.5% 20.5% 20.5% Operating, General and Administrative $ 14,849.00 15395.0 16010.8 16651.3 16814.5 15.3% 15.3% 15.3% 15.3% 15.0% Rent $ 628.00 805.0 837.2 870.7 896.8 0.6% 0.8% 0.8% 0.8% 0.8% Depreciation and amortization expenses $ 1,652.00 $ 1,765.30 $ 1,784.29 $ 1,630.13 $ 1,652.75 12% 12% 12% 12% Operating income $2,764.0 $2,762.6 $2,820.1 $3,158.5 $3,615.8 implied margins 2.9% 2.7% 2.7% 2.9% 3.2% Interest expense ($462.0) ($520.7) ($525.4) ($524.2) ($518.7) interest rate on financial liabilities 7.0% 7.0% 7.5% 7.5% Earnings before income taxes $2,302.0 $2,242.0 $2,294.7 $2,634.2 $3,097.1 Income taxes 794.00 784.7 803.2 922.0 1084.0 effective tax rate assumption (10-K, p.26 mgt. provided) 35.0% 35.0% 35.0% 35.0% 35.0% Net earnings including noncontrolling interests $1,508.0 $1,457.3 $1,491.6 $1,712.2 $2,013.1 Net earnings attributable to noncontrolling interests $11.0 $11.0 $11.0 $11.0 $11.0
  • 34. Net earnings attributable to Kroger $1,497.0 $1,446.3 $1,480.6 $1,701.2 $2,002.1
  • 35. Kroger: Balance Sheet Forecasts (Thousands) Actual Forecasts ASSETS 2012 2013 2014 2015 2016 Current assets: Cash and temporary cash investments $238.0 0.0 0.0 0.0 165.5 days sales in cash 1.7 1.7 1.7 1.7 Deposits in-transit 955.00 974.7 1032.2 1055.0 1033.4 percentage of total assets 3.50 3.50 3.50 3.40 Receivables $1,051.0 1071.7 1135.9 1070.5 1140.7 percentage of total assets 3.85 3.85 3.70 3.60 FIFO inventory $6,244.0 6437.0 6464.5 6654.9 6858.1 turnover assumption (in days) 23.0 22.5 22.0 22.0 LIFO reserve ($1,098.0) -1029.9 -1099.0 -1197.9 -1234.5 turnover assumption (in days) 0.18 0.16 0.17 0.18 0.18 Prefunded employee benefits $0.0 0.0 0.0 0.0 0.0 percentage of total assets Prepaid expenses and other current assets $569.0 539.4 520.4 518.7 550.9 percentage of total assets 2.2% 2.1% 2.1% 2.2% Total current assets $7,959.0 $7,992.9 $8,054.1 $8,101.2 $8,514.2 Property, plant and equipment, net $14,875.0 14710.85 14869.07 14819.33 15024.98 60.0% 60.0% 60.0% 60.0% Other assets $584.0 588.4 594.8 568.1 500.8 percentage of total assets 2.4% 2.4% 2.3% 2.0% Goodwill $1,234.0 1225.9 1263.9 1210.2 1001.7 percentage of total assets 5.0% 5.1% 4.9% 4.0% TOTAL ASSETS $24,652.0 $24,518.1 $24,781.8 $24,698.9 $25,041.6 LIABILITIES AND SHAREHOLDERS EQUITY Current liabilities:
  • 36. $2,734.0 $1,109.1 $986.9 $275.4 $0.0 % of total debt 16.00% 16.00% 16.00% 16.00% Trade accounts payable $4,524.0 4607.7 4560.1 4751.3 4894.3 Turnover assumption (in days) 21.00 20.00 20.00 20.00 Accrued salaries and wages $977.0 1003.4 1030.5 1057.3 1083.7 % of total assets 2.70% 2.70% 2.6% 2.5% Deferred income taxes $284.0 291.1 295.5 298.4 299.9 grow with sales 2.5% 1.5% 1.0% 0.5% Other current liabilities $2,538.0 $2,558.3 $2,578.8 $2,599.4 $2,620.2 grow with company stores 0.80% 0.80% 0.80% 0.80% Total current liabilities $11,057.0 $9,569.6 $9,451.7 $8,981.8 $8,898.1 $6,141.0 6325 6515 6710 6912 % of total equity 10961.3 11157.2 11427.1 11704.6 Adjustment related to fair-value of interest rate hedges $4.0 $4.0 $4.0 $4.0 $4.0 Long-term debt including obligations under capital leas $6,145.0 $6,329.2 $6,519.0 $6,714.4 $6,915.7 Deferred income taxes $800.0 $832.0 $865.3 $899.9 $926.9 grow with Sale 4.00% 4.00% 4.00% 3.00% Pension and postretirement benefit obligations $1,291.0 $1,337.8 $1,392.5 $1,409.7 $1,464.5 %of accrual salaries 75% 74% 75% 74% Other long-term liabilities $1,145.0 $1,154.2 $1,163.4 $1,172.7 $1,182.1 % of store growth 0.80% 0.80% 0.80% 0.80% TOTAL LIABILITIES $20,438.0 $19,222.8 $19,391.8 $19,178.5 $19,387.2 Preferred shares, $100 par per share, 5 shares authorize $0.0 $0.0 $0.0 $0.0 $0.0 $959.0 959.0 959.0 959.0 959.0 Additional paid-in capital $3,451.0 3485.5 3485.5 3485.5 3485.5 Current portion of long-term debt including obligations under capital leases and financing obligations Face-value of long-term debt including obligations under capital leases and financing obligations Common shares, $1 par per share, 1,000 shares authorized; 959 shares issued in 2011 and 2010
  • 37. Accumulated other comprehensive loss ($753.0) ($783.1) ($814.4) ($847.0) ($880.9) Accumulated earnings $9,787.0 10963.3 11182.5 11439.7 11702.9 Common stock in treasury, at cost, 398 shares in 2011 an ($9,237.0) -9329.4 -9422.7 -9516.9 -9612.1 Total Shareowners’ Equity $4,207.0 5295.3 5389.9 5520.3 5654.4 Noncontrolling interests $7.0 $7.0 $7.0 $7.0 $7.0 Total equity $4,214.0 $5,295.3 $5,389.9 $5,520.3 $5,654.4 TOTAL LIABILITIES AND SHAREHOLDERS EQUITY $24,652.0 $24,518.1 $24,781.8 $24,698.9 $25,041.6 implied debt/equity ratios 1.405 1.393 1.266 1.223 check: balance sheet balance? 0.0 0.0 0.0 0.0 Invested Capital (operating) 2012 2013 2014 2015 2016 Receivables 1051.0 1071.7 1135.9 1070.5 1140.7 FIFO inventory 6244.0 6437.0 6464.5 6654.9 6858.1 LIFO reserve -1098.0 -1029.9 -1099.0 -1197.9 -1234.5 Prefunded employee benefits 0.0 0.0 0.0 0.0 0.0
  • 38. Prepaid expenses and other current assets 569.0 539.4 520.4 518.7 550.9 Property, plant and equipment, net 14875.0 14710.8 14869.1 14819.3 15025.0 Other assets 584.0 588.4 594.8 568.1 500.8 Goodwill 1234.0 1225.9 1263.9 1210.2 1001.7 Trade accounts payable -4524.0 -4607.7 -4560.1 -4751.3 -4894.3 Accrued salaries and wages -977.0 -1003.4 -1030.5 -1057.3 -1083.7 Other current liabilities -2538.0 -2558.3 -2578.8 -2599.4 -2620.2 Pension and postretirement benefit obligations -1291.0 -1337.8 -1392.5 -1409.7 -1464.5 Other long-term liabilities -1145.0 -1154.2 -1163.4 -1172.7 -1182.1 Total Invested Capital (operating) 12984 12882 13024 12654 12598 Invested Capital (financing) 2012 2013 2014 2015 2016 Cash and temporary cash investments -238.0 0.0 0.0 0.0 -165.5 Deposits in-transit -955.0 -974.7 -1032.2 -1055.0 -1033.4 2734.0 1109.1 986.9 275.4 0.0 Deferred income taxes 284.0 291.1 295.5 298.4 299.9 6145.0 6329.2 6519.0 6714.4 6915.7 Deferred income taxes 800.0 832.0 865.3 899.9 926.9 Total equity 4214.0 5295.3 5389.9 5520.3 5654.4 Total Invested Capital (financing) 12984.0 12882.0 13024.4 12653.5 12598.1 NOPAT (operating) 2012 2013 2014 2015 2016 Operating income 2764.0 2762.6 2820.1 3158.5 3615.8 Income tax provision -794.00 -784.69 -803.15 -921.98 -1083.99 Reverse non-operating tax effect Interest expense tax affect -184.80 -208.27 -210.16 -209.70 -207.47 Change in deffered income tax liabilities 1 7.10 4.37 2.95 1.49 Liabilities 2 $32.0 $33.3 $34.6 $27.0 Current portion of long-term debt including obligations under capital leases and financing obligations Long-term debt including obligations under capital leases and financing
  • 39. NOPAT (Operating) 1808.8 1844.5 2064.4 2352.8 NOPAT (financing) 2012 2013 2014 2015 2016 Net income $1,497.0 $1,446.3 $1,480.6 $1,701.2 $2,002.1 Reverse nonoperating ithems Interest expense $277.20 $312.41 $315.25 $314.54 $311.21 Net earnings attributable to noncontrolling interests $11.00 $11.00 $11.00 $11.00 $11.00 Change in deferred income tax liabilities 1 7.10 4.37 2.95 1.49 Liabilities 2 32.00 33.28 34.61 27.00 NOPAT (Financing) $1,808.8 $1,844.5 $2,064.4 $2,352.8 ROIC 13.93% 14.32% 15.85% 18.59% FCF 1911 1702 2435 2408
  • 40. Terminal Growth Factor 1.02 Terminal 2017 2018 2019 2020 2021 2022 2023 $116,580.5 $114,248.9 $117,676.4 $116,499.6 $119,994.6 $118,794.7 $121,170.6 4% -2% 3% -1% 3% -1% 2% 92681.5 90827.9 94141.1 93199.7 95995.7 95035.7 96936.5 79.5% 79.5% 80.0% 80.0% 80.0% 80.0% 79.0% $23,899.0 $23,421.0 $23,535.3 $23,299.9 $23,998.9 $23,758.9 $24,234.1 20.5% 20.5% 20.0% 20.0% 20.0% 20.0% 20.0% 17487.1 17023.1 17298.4 17358.4 17639.2 17462.8 17812.1 15.0% 14.9% 14.7% 14.9% 14.7% 14.7% 932.6 914.0 941.4 932.0 960.0 950.4 969.4 0.8% 0.8% 0.8% 0.8% 0.8% 0.8% $ 1,692.35 $ 1,703.21 $ 1,652.00 $ 1,652.00 $ 1,652.00 $ 1,652.00 1685.0 12% 12% 12% 12% 12% 12% $3,786.9 $3,780.7 $3,643.4 $3,357.5 $3,747.8 $3,693.8 $3,767.6 3.2% 3.3% 3.1% 2.9% 3.1% 3.1% 3.1% ($547.9) ($550.3) ($566.7) ($583.7) ($601.2) ($619.3) -631.7 7.5% 7.5% 7.5% 7.5% 7.5% 7.5% $3,239.1 $3,230.5 $3,076.7 $2,773.7 $3,146.5 $3,074.5 $3,136.0 1133.7 1163.0 1107.6 970.8 1132.7 1106.8 1129.0 35.0% 36.0% 36.0% 35.0% 36.0% 36.0% $2,105.4 $2,067.5 $1,969.1 $1,802.9 $2,013.8 $1,967.7 $2,007.0 $11.0 $11.0 $11.0 $11.0 $11.0 $11.0 $11.0
  • 41. $2,094.4 $2,056.5 $1,958.1 $1,791.9 $2,002.8 $1,956.7 $1,996.0
  • 42. Terminal Growth Factor 1.02 Terminal 2017 2018 2019 2020 2021 2022 2023 0.0 340.2 263.0 629.1 629.3 827.6 844.1 1.7 1.7 1.7 1.7 1.7 1.7 1074.7 1053.8 1138.5 1031.9 1072.1 1076.0 1097.5 3.30 3.40 3.40 3.40 3.20 3.30 1159.0 1157.3 1228.5 1133.4 1299.3 1174.2 1197.7 3.60 3.70 3.70 3.70 3.70 3.80 6876.0 6896.5 6966.8 7077.0 7059.4 7065.8 7207.1 21.5 22.0 21.5 22.0 21.5 21.7 -1237.7 -1241.4 -1254.0 -1273.9 -1270.7 -1271.8 -1297.3 0.18 0.18 0.18 0.18 0.18 0.18 0.0 0.0 0.0 0.0 0.0 0.0 0.0 564.1 567.7 577.2 585.6 598.7 604.3 616.3 2.2% 2.2% 2.2% 2.2% 2.2% 2.2% $8,436.1 $8,774.1 $8,919.9 $9,183.1 $9,388.1 $9,476.0 $9,665.5 15384.98 15483.69 15740.99 15970.63 16327.07 16479.93 16809.53 60.0% 60.0% 60.0% 60.0% 60.0% 60.0% 538.5 516.1 524.7 532.4 544.2 549.3 560.3 2.1% 2.0% 2.0% 2.0% 2.0% 2.0% 1282.1 1032.2 1049.4 931.6 952.4 961.3 980.6 5.0% 4.0% 4.0% 3.5% 3.5% 3.5% $25,641.6 $25,806.1 $26,235.0 $26,617.7 $27,211.8 $27,466.5 $28,015.9
  • 43. $181.8 $0.0 $0.0 $0.0 $0.0 $0.0 $0.0 16.00% 16.00% 16.00% 16.00% 16.00% 16.00% 4825.4 4729.1 4646.0 4601.6 4733.2 4687.0 4780.8 19.00 19.00 18.00 18.00 18.00 18.00 1109.7 1136.3 1163.6 1191.5 1214.2 1236.0 1260.7 2.4% 2.4% 2.4% 2.4% 1.9% 1.8% 301.4 302.6 303.5 304.1 304.4 304.7 310.8 0.5% 0.4% 0.3% 0.2% 0.1% 0.1% $2,641.2 $2,662.3 $2,683.6 $2,705.1 $2,726.7 $2,748.5 2803.5 0.80% 0.80% 0.80% 0.80% 0.80% 0.80% $9,059.5 $8,830.3 $8,796.8 $8,802.3 $8,978.5 $8,976.3 $9,155.8 7119 7333 7553 7779 8013 8253 8418.1 12014.1 12332.6 12635.0 12867.7 13105.4 13077.9 $4.0 $4.0 $4.0 $4.0 $4.0 $4.0 $4.08 $7,123.1 $7,336.7 $7,556.7 $7,783.2 $8,016.6 $8,257.0 $8,422.1 $964.0 $944.7 $973.0 $963.3 $992.2 $982.3 $1,001.9 4.00% -2.00% 3.00% -1.00% 3.00% -1.00% $1,499.6 $1,535.6 $1,594.0 $1,632.2 $1,663.3 $1,693.2 $1,727.1 74% 74% 73% 73% 73% 73% $1,191.5 $1,201.1 $1,210.7 $1,220.4 $1,230.1 $1,240.0 $1,264.8 0.80% 0.80% 0.80% 0.80% 0.80% 0.80% $19,837.7 $19,848.4 $20,131.1 $20,401.4 $20,880.7 $21,148.7 $21,571.7 $0.0 $0.0 $0.0 $0.0 $0.0 $0.0 $0.0 959.0 959.0 959.0 959.0 959.0 959.0 978.2 3485.5 3485.5 3485.5 3485.5 3485.5 3485.510 3555.220
  • 44. ($916.1) ($952.8) ($990.9) ($1,030.5) ($1,071.8) ($1,114.6) -1136.9 11983.7 12271.3 12553.6 12804.6 13060.7 13191.3 13455.2 -9708.2 -9805.3 -9903.3 -10002.3 -10102.4 -10203.4 -10407.462 5803.9 5957.8 6103.9 6216.3 6331.1 6317.8 6444.2 $7.0 $7.0 $7.0 $7.0 $7.0 $7.0 $7.0 $5,803.9 $5,957.8 $6,103.9 $6,216.3 $6,331.1 $6,317.8 $6,444.2 $25,641.6 $25,806.1 $26,235.0 $26,617.7 $27,211.8 $27,466.5 $28,015.9 1.259 1.231 1.238 1.252 1.266 1.307 1.307 0.0 0.0 0.0 0.0 0.0 0.0 0.0 2017 2018 2019 2020 2021 2022 2023 1159.0 1157.3 1228.5 1133.4 1299.3 1174.2 1197.7 6876.0 6896.5 6966.8 7077.0 7059.4 7065.8 7207.1 -1237.7 -1241.4 -1254.0 -1273.9 -1270.7 -1271.8 -1297.3 0.0 0.0 0.0 0.0 0.0 0.0 0.0
  • 45. 564.1 567.7 577.2 585.6 598.7 604.3 616.3 15385.0 15483.7 15741.0 15970.6 16327.1 16479.9 16809.5 538.5 516.1 524.7 532.4 544.2 549.3 560.3 1282.1 1032.2 1049.4 931.6 952.4 961.3 980.6 -4825.4 -4729.1 -4646.0 -4601.6 -4733.2 -4687.0 -4780.8 -1 -1109.7 -1136.3 -1163.6 -1191.5 -1214.2 -1236.0 -1260.7 -1 -2641.2 -2662.3 -2683.6 -2705.1 -2726.7 -2748.5 -2803.5 -1499.6 -1535.6 -1594.0 -1632.2 -1663.3 -1693.2 -1727.1 -1191.5 -1201.1 -1210.7 -1220.4 -1230.1 -1240.0 -1264.8 13300 13148 13536 13606 13943 13958 14237 2017 2018 2019 2020 2021 2022 2023 0.0 -340.2 -263.0 -629.1 -629.3 -827.6 -844.1 -1074.7 -1053.8 -1138.5 -1031.9 -1072.1 -1076.0 -1097.5 -1 181.8 0.0 0.0 0.0 0.0 0.0 0.0 -1 301.4 302.6 303.5 304.1 304.4 304.7 310.8 7123.1 7336.7 7556.7 7783.2 8016.6 8257.0 8422.1 964.0 944.7 973.0 963.3 992.2 982.3 1001.9 5803.9 5957.8 6103.9 6216.3 6331.1 6317.8 6444.2 13299.5 13147.8 13535.6 13606.0 13943.0 13958.3 14237.5 2017 2018 2019 2020 2021 2022 2023 3786.9 3780.7 3643.4 3357.5 3747.8 3693.8 3767.6 -1133.67 -1162.98 -1107.61 -970.81 -1132.74 -1106.81 -1128.95 -1 -219.15 -220.10 -226.70 -233.50 -240.50 -247.71 -252.66 1.50 1.21 0.91 0.61 0.30 0.30 6.09 $37.1 ($19.3) $28.3 ($9.7) $28.9 ($9.9) $19.6
  • 46. 2472.7 2379.6 2338.4 2144.1 2403.7 2329.6 2411.8 2017 2018 2019 2020 2021 2022 2023 $2,094.4 $2,056.5 $1,958.1 $1,791.9 $2,002.8 $1,956.7 $1,996.0 $328.72 $330.15 $340.05 $350.25 $360.75 $371.56 $379.00 $11.00 $11.00 $11.00 $11.00 $11.00 $11.00 $11.00 1.50 1.21 0.91 0.61 0.30 0.30 6.09 37.08 -19.28 28.34 -9.73 28.90 -9.92 19.65 $2,472.7 $2,379.6 $2,338.4 $2,144.1 $2,403.7 $2,329.6 $2,411.8 19.63% 17.89% 17.79% 15.84% 17.67% 16.71% 17.28% 1771 2531 1951 2074 2067 2314 2133