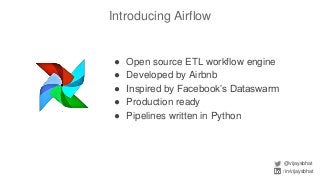
Data scientists spend a lot of time doing (and redoing) tedious ETL work. This is all the more so if they don't have data engineers to support their ETL pipelines. It doesn't have to be that way. This talk will cover Airflow, an awesome open source ETL workflow tool developed by Airbnb (and inspired by Facebook's Dataswarm ETL system). We will go over how data scientists can setup, monitor and self-service their pipelines without data engineering's support. There will also be a live demo.
http://www.meetup.com/SF-Bay-Area-Data-Ingest-Meetup/events/231024947/


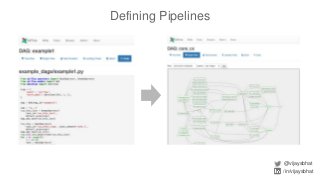
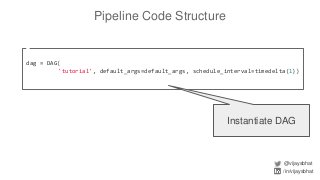
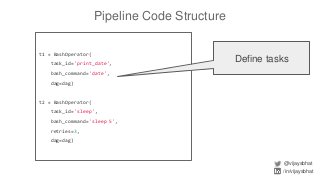
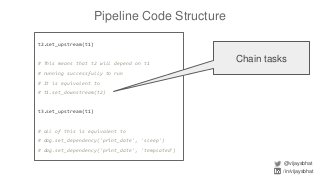
![Pipeline Code Structure
@vijaysbhat
/in/vijaysbhat
from datetime import datetime, timedelta
default_args = {
'owner': 'airflow',
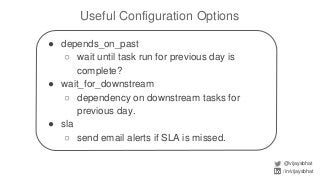
'depends_on_past': False,
'start_date': datetime(2015, 6, 1),
'email': ['airflow@airflow.com'],
'email_on_failure': False,
'email_on_retry': False,
'retries': 1,
'retry_delay': timedelta(minutes=5),
# 'queue': 'bash_queue',
# 'pool': 'backfill',
# 'priority_weight': 10,
# 'end_date': datetime(2016, 1, 1),
}
Define default
arguments](https://image.slidesharecdn.com/fussfreeetlwithairflow-160624015842/85/Fuss-Free-ETL-with-Airflow-11-320.jpg?cb=1466734262)
![CLI Commands
@vijaysbhat
/in/vijaysbhat
● airflow [-h]
○ webserver
○ scheduler
○ test
○ run
○ backfill
○ ...](https://image.slidesharecdn.com/fussfreeetlwithairflow-160624015842/85/Fuss-Free-ETL-with-Airflow-22-320.jpg?cb=1466734262)