1. 1
Feb 24, 2015
Kajaria Ceramics Ltd
80
175
270
Jan-14 May-14 Sep-14 Jan-15
KJC Sensex
Consumer Discretionary Feb 24, 2015
Kajaria Ceramics LtdIndia Research – Stock Broking
Bloomberg Code: KJC IN
HOLD
For private circulation only. For important information about Karvy’s rating system and other disclosures refer to the end
of this material. Karvy Stock Broking is also available on Bloomberg, KRVY<GO>, Thomson Publishers & Reuters
Exhibit 1: Valuation Summary (Rs. Mn)
YE Mar FY13 FY14 FY15E FY16E FY17E
Net Sales 15832 18400 21933 26890 32975
EBITDA 2477 2870 3424 4265 5230
EBITDA Margin (%) 15.6 15.5 15.6 15.8 15.8
Adj. Net Profit 1044 1242 1657 2110 2718
EPS (Rs.) 14.2 16.4 20.8 26.6 34.2
RoE (%) 30.2 25.4 23.2 24.2 25.3
PE (x)* 14.2 24.8 35.8 28.1 21.8
Source: Company, Karvy Research; *For FY13,FY14 PE multiples are on historic basis
Kajaria: Capacity expansion to drive growth
Revenue growth driven by capacity expansion: Revenue is likely to
witness CAGR growth of 22% during FY14-17E period, on the back of 20.5 million
square meter (MSM) capacity expansion. Post capacity expansion, the total
capacity will increase to 67.1 MSM from 46.6 MSM in FY14.
Higher realizations due to better product mix: Realizations are likely to
improve because of higher contribution from Value Added Products (VAP).
EBITDA margin is expected to stabilize on account of easing natural gas prices
and risk of gas price increase is waning. EBITDA is expected to post CAGR growth
of 22% during FY14-17E. EPS is expected to show CAGR growth of 27% during
the period FY 14-17E mainly because of declining interest expenses.
Government policies to provide fillip to Indian Ceramic tile Industry: Real
estate industry is slowing down in recent years, however it is expected to get
required boost from government policies. Housing sector which contributed for
70% of the ceramic tiles industry sales is likely to get much needed push from the
government in order to address the prevailing housing shortage. Government’s
policies such as developing 100 smart cities in next few years, Modi’s ‘Clean India’
campaign with ‘sanitization for all by 2019’ and ‘Housing for all by 2022’ schemes
will lead to boom in the ceramic tiles industry in India for the next few years.
Valuation and Outlook
There has been significant re-rating on the stock and is evident from Kajaria’s PE
which has moved up from 22 times to 40 times. Re-rating was mainly because
of company’s growth faster than industry and higher operating margins than
its peers. At CMP of Rs.747, the stock is trading at 22x FY17E EPS. We initiate
coverage on Kajaria and value the company at 25x FY17E EPS for target price of
Rs. 855 with “HOLD” rating.
Key Risks
• Slower than expected growth in housing sector
• Imports from China; Competition from foreign players
• Surge in natural gas prices
Recommendation (Rs.)
CMP* 747
Target Price 855
Upside (%) 14
*CMP as on Feb 23, 2015
Stock Information
Mkt Cap (Rs.mn/US$ mn) 60392 / 990
52-wk High/Low (Rs.) 826 / 292
3M Avg. daily volume (mn) 0.2
Beta (x) 0.9
Sensex/Nifty 28975 / 8754
O/S Shares(mn) 79.5
Shareholding Pattern (%)
Promoters 49.5
FIIs 23.4
DIIs 4.2
Others 22.9
Analyst Contact
Vignesh S.B.K
040 - 4485 7902
vignesh.sbk@karvy.com
Technical View
The stock is making repeated cycles of higher
highs and higher lows suggesting good
demand for the stock even at higher levels.
Volume activity on any minor dip has also
been good for the stock. Kajaria Ceramics is
in a structural uptrend and looks well placed
to surge higher towards our fundamental
target. We recommend traders to accumulate
the stock on dips for the mentioned target
levels.
Stock Performance (%)
1M 3M 6M 12M
Absolute 22 34 31 151
Relative to Sensex 17 29 17 75
Source: Company, Karvy Research
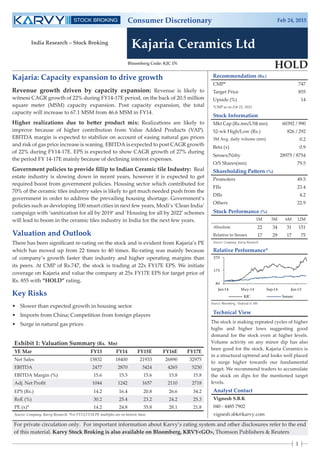
Relative Performance*
Source: Bloomberg, *Indexed to 100
2. 2
Feb 24, 2015
Kajaria Ceramics Ltd
Balance sheet (Rs.mn)
FY15E FY16E FY17E
Total Assets 14619 16914 19706
Net Fixed assets 8110 9194 10412
Current assets 5399 6646 8343
Other assets 1109 1074 950
Total Liabilities 14619 16914 19706
Networth 7286 8874 10918
Debt 2164 1864 1364
Current Liabilities 3804 4683 5714
Other liabilities 651 780 997
Balance Sheet Ratios
RoE (%) 23.2 24.2 25.3
ROCE (%) 30.7 33.1 34.6
Net Debt/Equity 0.3 0.2 0.1
Equity/Total Assets 0.5 0.5 0.6
P/BV (x) 8.1 6.7 5.4
Source: Company, Karvy Research
Cash Flow (Rs.mn)
FY15E FY16E FY17E
EBITDA 3424 4265 5230
Other Income 46 57 69
Interest 280 317 232
Tax 860 1098 1417
Changes in WC (480) (149) (331)
CF from Operations 1804 2701 3250
Capex (1800) (1700) (1800)
Others 4 20 48
Cash flow from Investing (1796) (1680) (1752)
Proceeds from issue of
Equity Issue/Warrants
750 0 0
Inc / (Dec) in borrowing (200) (300) (500)
Dividends paid (411) (523) (673)
Others 89 119 160
CF from Financing 228 (704) (1014)
Change in Cash 236 317 485
Source: Company, Karvy Research
Company Background
Kajaria Ceramics is the largest manufacturer of ceramic &
vitrified tiles in India. The company as of December 2014
has an annual aggregate capacity of 54.10 mn. sq. meters,
distributed across seven plants Sikandrabad in Uttar Pradesh,
Gailpur in Rajasthan, four plants in Morbi in Gujarat and
one at Vijayawada in Andhra Pradesh. Kajaria Ceramics has
increased its capacity from 1 MSM to 54.10 MSM in the last
25 years and offers more than 1200 options in ceramic wall
& floor tiles, vitrified tiles and designer tiles. Kajaria enjoys
a broad presence across ceramic tiles, Polished Vitrified Tiles
(PVT) and Glazed Vitrified Tiles (GVT). Kajaria is the only
ceramic tile company of India to achieve the rare distinction
of being a Super brand for the eighth time in a row, a status
shared by only sixty other corporate houses in India. Kajaria’s
membership to the Indian Green Building Council, reassures
the consumers and stakeholders that each product has been
created in an eco-friendly process.
Exhibit 2: Shareholding Pattern (%)
Source: Company, Karvy Research
Exhibit 3: Revenue Segmentation (%)
Source: Company, Karvy Research
Company Financial Snapshot (Y/E Mar)
Profit & Loss (Rs.mn)
FY15E FY16E FY17E
Net sales 21933 26890 32975
Optg. Exp 18556 22681 27815
EBITDA 3424 4265 5230
Depreciation 538 621 704
Interest 280 317 232
PBT 2605 3327 4294
Tax 860 1098 1417
PAT 1657 2110 2718
Profit & Loss Ratios
EBITDA margin (%) 15.6 15.8 15.8
Net margin (%) 7.5 7.8 8.2
P/E (x) 35.8 28.1 21.8
EV/EBITDA (x) 18.0 14.5 11.8
Dividend yield (%) 0.6 0.8 1.0
Source: Company, Karvy Research
Promoter
50%
DII
4%
FII
23%
Others
23%
Own
Manufacturing
53%
JV
27%
Import /
Outsourced
20%
3. 3
Feb 24, 2015
Kajaria Ceramics Ltd
Revenue growth will be driven by capacity expansion and higher realizations from value added products
Kajaria has been growing faster than the industry in the last few years and we expect the company to outperform the industry.
Indian tile industry registered CAGR growth of 16% during FY10-14 compared to Kajaria’s CAGR growth of 24%. Capacity
expansion, better product mix and higher realizations are expected to boost the revenue growth which is likely to post
22% CAGR growth during FY14-17E. Volumes are likely to grow at CAGR of 15% during FY14-17E and remaining growth
contribution will be in the form of pricing and higher realizations. Kajaria’s related diversification by entering into sanitary-
ware and faucet business will provide a boost to the revenue growth over the next couple of years. Kajaria’s sanitary-ware
plant commissioned in H1FY15 and higher capacity utilization will be seen in FY16. Kajaria is setting up faucet plant which is
expected to commence during Q1FY16.
Realizations to improve
Sales realizations per square meter is expected to grow at CAGR of 5% during FY14-FY17E on higher contribution from Value
added products. Value added products share out of the total revenue is on the rise in the last few years from 27% in 2010 to 32%
in 2014. This has lead to increased sales realization during the period and is expected to increase going forward. Product mix
in FY2014 was skewed towards Ceramics tile segment which is at 56% and remaining from Vitrified tiles segment. Out of 20.5
MSM capacity planned for, close to 86% of the capacity is towards production of Polished Vitrified and expect the blended
realization to be higher than the current levels of 376 per square meter (Q3FY15). In FY14 industry blended realizations stood
at Rs. 324 compared to Kajaria realization of Rs. 354. Product mix is likely to change by the end of 2016 and contribution from
vitrified tiles segment will be at 57% and ceramics tiles segment will stand at 43%.
Exhibit 4: Revenue and Growth rate
Source: Company, Karvy Research
Exhibit 6: Sales realization per square meter & Growth rate
Source: Company, Karvy Research
Exhibit 5: Industry vs. Kajaria realization (per square meter)
Source: Company, Karvy Research
Exhibit 7: PVT production volume to increase (MSM)
Source: Company, Karvy Research
13130
15832
18400
21933
26890
32975
38%
21% 16%
19%
23%
23%
-10%
10%
30%
50%
0
7000
14000
21000
28000
35000
FY12 FY13 FY14 FY15E FY16E FY17E
Revenue (In Mn) Growth rate (RHS)
330
347
354
371
393
409
3%
5%
2%
5%
6%
4%
0%
2%
4%
6%
8%
300
330
360
390
420
FY12 FY13 FY14 FY15E FY16E FY17E
Realisation per Sq mt Growth rate (RHS)
25.9 28.9 28.9
11.4
16.4
28.99.3
9.3
9.3
10
30
50
70
FY 2014 FY 2015 E FY 2016 E
Cermaic Tiles Polished Vitrified Tiles Glazed Vitrifed Tiles
325
354
367
300
314
328
342
356
370
Industry FY14 Kajaria FY14 Kajaria H1FY15
4. 4
Feb 24, 2015
Kajaria Ceramics Ltd
Housing shortage to boost demand for ceramics industry
According to the planning commission, urban India is going to be home
to 600 million people by 2031; an increase of 59% from 2011, which is
nearly equal to twice the population of United States. India’s urban
population grew from the 290 million reported in the 2001 census to an
estimated 340 million in 2008, and it could soar further to 600 million by
2030. In current scenario approximately 594 million people, about half
of India’s population do not have toilets or bathrooms as per census
report. Housing shortage is estimated for urban India at 18.78 Million
& at 40 million as per National Housing Board (NHB).
Exhibit 10: Related Diversification
Source: Company, Karvy Research
Exhibit 11: Urban Housing shortage - Top 6 states
Source: Ministry of Housing, Karvy Research
Exhibit 8: Consistent capacity addition
Source: Company, Karvy Research
The company has opted for related diversification and in the process of
setting up faucet plant with the capacity to produce 1.00 million pieces
per annum which is expected to commence in Q1FY16. The company’s
sanitary-ware plant which has production capacity of 700000 pieces
per annum has started commissioning towards the end of H1FY15
and expected to achieve full capacity in FY16. Kajaria has been pure
tiles player and now by entering into production of sanitary-ware and
faucet will transform company into complete solution provider in this
segment.
Capacity Expansion of 20.5 MSM by FY16
Kajaria had capacity of 46.6 MSM at the end of FY14 and company laid
out plans to expand its capacity by 20.5 msm to reach 67.1 MSM by
FY16. This target will be met by brown field, greenfield expansions &
through joint ventures. In H1 FY15, capacity was increased by 7.5 MSM.
Remaining capacity of 13.1MSM will be met through greenfield unit at
Rajasthan with an annual capacity of 5 MSM expected to be completed
by December 2015; brown field facility at Rajasthan with an annual
capacity of 3 MSM to produce ceramic tiles. Company has ventured
into JV with Taurus which is putting up a 5 MSM PVT capacity at Morbi.
Exhibit 9: Kajaria Manufacturing plants presence and expected capacity as of March 2016 (Units MSM)
Plants Ceramic Tiles PVT GVT Total
Sikandrabad (UP) 3.5 0 6.3 9.8
Gailpur (Rajasthan) 18.5 8.0 3.0 29.5
Morbi (Gujarat) 4.6 20.9 0 25.5
Vijayawada (AP) 2.3 0 0 2.3
Source: Company, Karvy Research
36
46.6
67.1
0
25
50
75
FY12 FY14 FY16E
Capacity in MSM
3.1
1.9
1.3 1.3 1.3 1.2
0.8
1.6
2.4
3.2
UP MH WB AP TN RJ
Housing shortage in Million Units
Exhibit 12: Tiles demand break up
Source: Ministry of Housing, Karvy Research
Residential
70%
Replacement
15%
Commercial
15%
Housing demand constitutes 70% of Indian tiles demand, replacement
demand forms 15% and commercial demand forms 15%. Housing
demand is highly correlated to construction activity and to economy.
As far as replacement demand is concerned, the durability of tiles
is between 8-10 years. Malls, airports and other commercial places
have started using high end tiles and it is evident from the usage in
construction of recent airport terminals.
100%
96% 94%
4% 6%
75%
80%
85%
90%
95%
100%
FY15E FY16E FY17E
Tiles Business Faucet & Saniatary-ware Business
5. 5
Feb 24, 2015
Kajaria Ceramics Ltd
Market leader
Kajaria ceramics has market share close to 20% in the organized sector and 10% market share in Indian ceramic industry. The
company’s goal is to garner market share of 15% in next few years in Indian ceramics industry. With more capacity expected
to become operational in next 12 months, it is well positioned to reach the goal of 15% market share in Indian ceramics
industry. The company has entered into sanitary-ware and faucet segments, which is the key area of focus for the government
and right time for the company to enter into the segment.
Exhibit 16: Organized sector market share as of March 2014
Source: Company, Karvy Research
Manufacturing plants spread across India
Kajaria has manufacturing presence in key markets across India, which helps them to cut down logistics costs. Plants produce
variety of ceramic category products such as ceramic tiles, PVT and GZT. In western region, plants are located in Gujarat and
Rajasthan; and in Central India, they have plant in UP. These plants cater to Central India and Northern India. Markets as far
as south India are concerned, plant is located in Andhra Pradesh. North and West are major markets for tiles and next would
be the southern market. Kajaria is well placed to tap the demand because of housing shortage in top states where production
plants are present.
20%
19%
13%
8%
7% 7% 6%
4% 5% 4%
6%
2%
7%
12%
17%
22%
H & R
Johnson
Kajaria
Cermaics
Somany
Cermaics
Nitco Tiles Asian
Granito
RAK
Ceramics
Orient Bell
Ceramics
Varmora Simpolo Sun heart Others
Exhibit 14: Kajaria gaining market share
Source: Company, Karvy Research
Exhibit 15: Kajaria out performing industry’s growth rate
Source: Company, Karvy Research
15%
12% 12%
14% 14%
21%
16%
19%
23% 23%
0%
10%
20%
30%
FY13 FY14 FY15E FY16E FY17E
Indian Tiles Industry Kajaria
Exhibit 13: Kajaria manufacturing plants presence and capacity as of September 2014 (Units MSM)
Plants Ceramic Tiles PVT GVT Total
Sikandrabad (UP) 3.5 0 6.3 9.8
Gailpur (Rajasthan) 15.5 3.0 3.0 21.5
Morbi (Gujarat) 4.6 15.9 0 20.5
Vijayawada (AP) 2.3 0 0 2.3
Source: Company, Karvy Research
6.6% 6.7%
7.7% 8.0%
9.1%
0%
3%
5%
8%
10%
FY10 FY11 FY12 FY13 FY14
Kajaria's market share in Industry
6. 6
Feb 24, 2015
Kajaria Ceramics Ltd
Kajaria’s segment market share
Kajaria has decent market share across major tiles segment. Among these segments, it has highest market share of 25% in
Glazed vitrified tiles, 7% in vitrified tiles segment and 6% in Ceramic tiles division. Polished vitrified tiles segment has been
growing at CAGR of 20% in last 4 years compared to 14% growth in Ceramic tiles segment indicates shift in preference by
customers towards Vitrified tiles segment.
Strong Distribution Channel
The company has wide and deep distribution network with more than 900 dealers and 10000 sales points across India. Kajaria
is planning to increase its dealers and extend its reach towards non-metros. This would help the company to reach Tier II
and Tier III cities and gain access to new places and help Kajaria to convert their additional production into sales. In urban
locations, Kajaria markets its products through Kajaria world and Kajaria studio.
Organized players gaining market share
Towards the end of 2013, Gujarat High Court ordered Gujarat Pollution control board to shut down the coal based gasifiers.
Order came on the back of ceramic units polluting and they were asked to switch over from coal to natural gas. As a result
the demand for Liquefied Natural Gas (LNG) shot up and prices started to impact the unorganized players. Gradually, they
have started losing market share as competitive edge waned and were unable to compete with organized players which lead
Exhibit 17: Segment Market Share (%)
Source: Company, Karvy Research
Exhibit 18: Industry Segment growth rate (%)
Source: Company, Karvy Research
5.8%
7.3%
24.5%
0%
5%
10%
15%
20%
25%
30%
Ceramic wall &
floor tiles
Polished Vitrified
tiles
Glazed Vitrified
tiles
Wide range of product offering
Kajaria is expanding its presence in entire value chain by offering new products adopting latest technologies. With digital
printing technologies, tiles are preferred over natural stones because former has attractive looks and cheaper than the latter.
Large format tiles and double charge vitrified tiles are gaining traction in the market which are preferred by customers.
Vitrified tiles segment caters to higher end and middle end segments whereas ceramics tiles are offered to value customers.
Kajaria offers products at various price ranges starting from Rs. 200 Square meter to Rs. 1800 Square meter.
13
20
26
0
10
20
30
Ceramic tiles Polished vitrified
tiles
Glazed vitrified tiles
CAGR Growth 2009-2013
Exhibit 19: Industry scenario - 2008
Source: Company, Karvy Research
Exhibit 20: Industry scenario - 2014
Source: Company, Karvy Research
Organized
players
49%
Unorganized
players
51%
Organized
players
40%Unorganized
players
60%
7. 7
Feb 24, 2015
Kajaria Ceramics Ltd
Implementation of Goods and Service Tax (GST) would be beneficiary to organized players such as Kajaria
By implementing GST, more companies will come under the tax bracket which will increase the costs and taxes for unorganized
players. Under GST proposal, companies with turnover of Rs.10 lakh has to pay GST and this will lead to small players
in unorganized segment will end up paying excise or value added taxes. Organized players will be beneficiaries as they
get deduction from their suppliers. Price differential between the organized and unorganized players for their products is
expected to shrink to 10% compared to 18% differential now. In the current scenario, indirect tax rate for manufacturing goods
is at 26% compared to proposed rate of 20% under GST (10% for excise and 10% for VAT). This will lead to lower pricing for
the products and benefits are likely to be passed on to the customer.
Household by material of floor
Ceramics tiles market is influenced by rapid urbanization and preference towards middle and higher end tiles. There is
increased scope for people shifting from other floor materials such as cement, mud & stone to other floor materials because
of higher disposable incomes & rising middle class population. In India, 47% of the population lives in houses which have
mud flooring, cement flooring (37%) and 11% in mosaic & tiles flooring as per census 2011. Close to 26% of urban population
lives in houses with tiles flooring and 46% lives in houses which have cement flooring. On the other hand, only 3.7% of rural
population lives in houses with tiles flooring and 62.6% of population lives in houses which have mud as flooring. Facts show
the huge opportunities for the Indian tiles industry. As urbanization happens people shift from rural areas to cities which will
lead to huge demand for flooring materials.
Government providing fillip to the Ceramic Industry
Smart cities – Building 100 smart cities in next few years as outlined by Prime Minister will be big boost for construction
and building materials space. Government has decided to deploy funds close to Rs. 6,00,000 cr for the development of smart
cities. Focus is likely to be on existing cities and brown field development. Smart cities are expected to spur the demand
for everything from construction materials to digital technology, automobiles, energy, healthcare and transport systems in
forthcoming years. With assumption of 1 lakh people in each smart city and 4 members residing in each house, smart city plan
would generate demand for 25 lakh new homes. Housing demand constitutes 70% of the demand for the ceramics Industry.
Exhibit 21: Percentage of Households by material of floor (%)
INDIA RURAL URBAN
1991 2001 2011 2001 2011 2001 2011
Mud 67 57 47 72 63 18 12
Stone - 6 8 5 6 9 12
Cement 21 27 31 18 24 48 46
Mosaic/ Floor tiles 4 7 11 2 4 21 26
Others 8 3 4 3 3 4 4
Source: Company, Karvy Research
to consolidation in the space. In 2008, unorganized players had market share of above 60% and organized players had smaller
portion of 40%. In the current scenario, the trend has changed with organized players capturing higher pie and they have
successfully managed to garner close to 50% market share in 2014. Organized players such as Kajaria and Somany growing
faster than the industry which would help the organized players to gain more market share in future.
Organized players such as Kajaria are opting for joint ventures with unorganized players which provide instant access to
readily available capacity and faster revenue generation. On the other hand, unorganized players get access to pan India
market for their products and brand recognition. Growth for organized players is faster than the unorganized players because
of wide variety of product offerings, pan India market access and strong brand recognition.
8. 8
Feb 24, 2015
Kajaria Ceramics Ltd
Exhibit 22: Business Assumptions
Y/E Mar (Rs. Mn) FY14 FY15E FY16E FY17E Comments
India Business (Consolidated)
Revenue 18400 21933 26890 32975
Capacity addition to drive sales growth.
Revenue Growth (%) 16.8 19.4 22.6 22.6
EBITDA 2870 3424 4265 5230 Margins to improve on the back of decline in fuel &
power costs.EBITDA Margins (%) 15.5 15.6 15.8 15.8
PAT 1242.5 1656.7 2110.2 2717.7
Expected to be strong on decline in finance costs.
Diluted EPS (Rs) 16.4 20.8 26.6 34.2
Diluted EPS Growth (%) 15.8 26.8 27.4 28.8
Net CFO 1662 1804 2701 3250
Strong cash flows on improving RoAs and reduction in
working capital days.
Net Debt 2303 1928 1547 879 Debt is expected to decline going forward
Free Cash Flow 50 287 604 1088
Source: Company, Karvy Research
Exhibit 23: Karvy vs. Consensus
Karvy Consensus Divergence (%) Comments
Revenues (Rs.mn)
FY15E 21933 22190 (1.2)
Sales driven by capacity expansion and higher value productsFY16E 26890 27353 (1.7)
FY17E 32975 32684 0.9
EBITDA (Rs.mn)
FY15E 3424 3440 (0.5)
EBITDA to improve on lower fuel costs and higher contribution
from higher margin products
FY16E 4265 4294 (0.7)
FY17E 5230 5213 0.3
EPS (Rs.)
FY15E 21 21 (2.6)
EPS to grow on the back of decline in finance costsFY16E 27 27 (2.9)
FY17E 34 34 0.8
Source: Bloomberg, Karvy Research
Revenues expected to grow at CAGR of 22% during FY 14-17E, driven
by capacity expansion and higher contribution from VAP such as
Vitrified tiles segments. Realizations are likely to improve on the back
of increasing contribution from Vitrified tiles segment. In H1FY15,
realization came in at Rs.366 per Sq mt compared to Rs.354 per sq mt
in FY14, because of increased contribution from Vitrified tiles. Sales
realization is expected to grow at CAGR of 5% during FY14–17E driven
by change in product mix and product pricing.
Exhibit 24: Sales realization per square meter (Rs.)
Source: Company, Karvy Research
Realizations to improve on back of increase in value added products
346
354
371
393
409
330
355
380
405
430
FY13 FY14 FY15E FY16E FY17E
9. 9
Feb 24, 2015
Kajaria Ceramics Ltd
EBITDA reported CAGR growth of 27% during FY12-FY14. EBITDA is
likely to witness CAGR growth of 22% because of improved realization
from value added products and fall in fuel costs which is a major
component of expenses. Kajaria is adding more dealers and expected
to increase promotional expenses in order to increase its reach across
Tier II and III cities where demand is seen increasing and to promote
the brand. Increase in promotional costs is likely to be offset by benefits
of lower fuel expenses. EBITDA per sq mt is expected to reach Rs.64 Sq
mt by FY17E from Rs.55 per Sq mt in FY14. EBITDA per square meter
growth expected at CAGR of 5% during FY14-17E.
Exhibit 25
Source: Company, Karvy Research
Operating Margins to Stabilize (%)
15.6%
15.5%
15.6%
15.8% 15.9%
15.5%
15.6%
15.7%
15.8%
15.9%
FY13 FY14 FY15 FY16 FY17
Exhibit 26: Expense break up for square meter
FY12 FY13 FY14 FY15E FY16E FY17E
Raw material costs 163 157 158 169 176 183
Employee costs 27 30 33 35 37 38
Power & fuel costs 53 67 72 78 79 82
Selling & distribution 12 13 12 13 13 14
Other expenses 22 26 25 26 28 29
EBITDA 52 54 55 58 61 64
Source: Company, Karvy Research
Kajaria registered CAGR of 23% in PAT during FY12-14. PAT is likely
to grow at a CAGR of 27% during FY14-17E (mainly on the back of
lower finance costs). Interest coverage ratio has improved from 3.47
times in FY12 to 6 times in FY 14 and is expected to further strengthen
to 17 times in FY17. Sharp reduction in working capital cycle days lead
to increased cash flows from operations and reduced the need for short
term borrowings. Debt level fell to Rs. 2360 Million in March FY14
compared to Rs. 3200 Cr as of March FY13. PAT margins improved to
6.73% in FY14 from 6.15% in FY12.
Exhibit 27
Source: Company, Karvy Research
Fall in Interest costs to boost PAT margins
454 408
280
317
232
6.6% 6.7%
7.5%
7.8%
8.2%
4%
5%
6%
7%
8%
9%
200
300
400
500
FY13 FY14 FY15E FY16E FY17E
Finance Costs PAT Margins (RHS)
73
62
37
30
38
40 37
38 39
20
35
50
65
80
FY09
FY10
FY11
FY12
FY13
FY14
FY15E
FY16E
FY17E
Payable days Inventory days
Debtors Days WC days
Working capital days have significantly reduced from 62 days in FY10
to 40 days in FY14. This reduction was mainly on account of inventory
days which declined from 69 days to 41 days from FY14. Inventory
days have fallen indicating company is able to convert its inventories
faster and improved the cash conversion time frame. Working capital
as % of sales has reduced from 16% in FY10 to 11% in FY14 which has
reduced the requirement of short term working capital loans. Debtor
days are stable over the years at 37 days during FY10 and 30 days in
FY14. Stable debtor days indicate company’s ability to collect debt and
are best in the industry whereas its competitors are taking longer time
to collect.
Exhibit 28
Source: Company, Karvy Research
Reduction in working capital cycle days
10. 10
Feb 24, 2015
Kajaria Ceramics Ltd
Significant amount of debt has come off the balance sheet on the back of
improvement in working capital cycle days. Debt has reduced sharply
from Rs.3200 Mn in FY13 to Rs. 2360 Mn as of March FY14. Debt Equity
ratio has declined to 0.41 from 0.82 during the same period. We expect
debt equity ratio to decline going forward despite significant capacity
addition on the cards. Equity infusion from West Bridge Cross Over
fund will help the company to meet its funding requirement for capex.
Return on Assets has increased from 9% in FY12 to 11% in FY14 and to
reach 14% in FY17. RoAs are expected to improve on account of higher
product realization from commissioning of new plants.
Exhibit 29: Decline in Debt Equity ratio
Source: Company, Karvy Research
Strengthening Balance sheet
1.0 0.9
0.4
0.3
0.2
0.1
0.0
0.3
0.5
0.8
1.0
FY12 FY13 FY14 FY15E FY16E FY17E
Debt Equity (x)
Stable return ratios (%)
Exhibit 30:
Source: Company, Karvy Research
Kajaria’s RoE declined mainly on account of equity dilution in the form of
issue of equity shares to West Bridge Cross Over fund and conversion of
warrants to equity. However, RoE is expected to improve going forward
from 23% in FY15E to 25% in FY17E. RoCE is expected to improve from
30% in FY15E to 34% in FY17E on the back of declining debt levels in the
coming years.
23.2%
24.2%
25.3%
30.7%
33.1%
34.6%
12.4%
13.2%
14.7%
5%
15%
25%
35%
FY15E FY16E FY17E
RoE RoCE RoA
Kajaria expected to generate strong operating cash flows
Exhibit 31: (Rs. mn)
Source: Company, Karvy Research
Company has marked 45% expansion in capacity which will generate
strong cash flows in the next couple of years. Majority of new capacity is
expected to commission in next 12 months and most of them are towards
production of vitrified tiles which will fetch higher realizations. In next
couple of years, Kajaria is expected to transform into a company with
strong free cash flows which will lead to strengthening of its financials
and help the company to expand its business in future.
976
1662
1804
2701
3250
0
1100
2200
3300
FY13 FY14 FY15E FY16E FY17E
Operating cash flow
11. 11
Feb 24, 2015
Kajaria Ceramics Ltd
Exhibit 32: Company Snapshot (Ratings)
Low High
1 2 3 4 5
Quality of Earnings 99
Domestic Sales 99
Exports 99
Net Debt/Equity 99
Working Capital req 99
Quality of Management 99
Depth of Management 99
Promoter 99
Corporate Governance 99
Source: Company, Karvy Research
Valuation & Outlook
We initiate coverage on Kajaria and value the company at 25x FY17E EPS for target price of Rs. 855 with HOLD rating. Kajaria
is currently trading at 22x times FY17E EPS. We have assigned average PE multiple of 25 times in which the stock has been
trading in the last couple of years. Kajaria has seen significant re-rating which is evident from its PE moving to 40x from 22x.
Re-rating was mainly because company was growing faster than industry and has higher operating margins than its peers.
Strong revenue growth rate and with operating margins highest in the industry indicate the company’s competitiveness. With
20.5 MSM capacity coming up in the next 12 months, revenues likely to get boost from the capacity addition. Management
has focused on certain issues such as reducing debt, successfully reduced the working capital days and raised money from
PE players to fund capex for the growth. Now the focus for the company is to capture the 15% market share in the industry.
Exhibit 33: P/E Band (x)
Source: Bloomberg, Karvy Research
Exhibit 34: P/B Band (x)
Source: Bloomberg, Karvy Research
2
4
6
8
10
Feb-13 Jun-13 Oct-13 Feb-14 Jun-14 Oct-14 Feb-15
PB Avg Highest Lowest
5
15
25
35
45
Feb-13 Jun-13 Oct-13 Feb-14 Jun-14 Oct-14 Feb-15
PE Avg Highest Lowest
Exhibit 35: Comparative valuation summary
CMP
M-cap
(Rs. mn)
EPS (Rs.) P/E (x) RoE (%)
FY15E FY16E FY17E FY15E FY16E FY17E FY15E FY16E FY17E
Kajaria Ceramics 747 60392 20.8 26.6 34.2 35.8 28.1 21.8 23.2 24.2 25.3
Somany Ceramics 361 14518 11.4 16.5 22.6 31.6 21.9 16.0 18.3 22.3 24.9
Source: Company, Bloomberg, Karvy Research
12. 12
Feb 24, 2015
Kajaria Ceramics Ltd
Exhibit 40: Scenario analysis of earnings and target prices based on % cost of raw materials to sales revenue
Base assumption
YoY Cost of raw materials as a % of Sales revenue
3% 2% 1% -1% -2% -3%
EBITDA margin (%)
FY15E 15.5 14.3 14.7 15.2 16.0 16.4 16.8
FY16E 15.8 14.5 15.0 15.4 16.3 16.7 17.1
FY17E 15.8 14.5 15.0 15.4 16.3 16.7 17.1
EPS (Rs.)
FY15E 20.85 18.5 19.3 20.1 21.6 22.4 23.2
FY16 E 26.55 23.7 24.6 25.6 27.5 28.5 34.2
FY17E 34.2 30.6 31.8 33.0 35.4 36.6 37.8
Target price 855 796 827 858 920 950 981
Change in TP (%) - (10.5) (7.0) (3.5) 7.6 11.1 14.7
Source: Company, Karvy Research, NA: Not Applicable
Peers Group Comparison
Exhibit 36: Trend in EBITDA margins
Source: Company, Karvy Research
Exhibit 38: Trend in RoE
Source: Company, Karvy Research
Exhibit 37: Sales Growth Rate (%)
Source: Company, Karvy Research
Exhibit 39: Debt Equity Ratio Trend (%)
Source: Company, Karvy Research
Key Risks
• Slower than expected growth in housing sector
• Imports from China; Competition from foreign players
• Surge in natural gas prices
15.7
15.8
15.6
15.5
15.3
15.6
15.8
16.1
5
10
15
FY11 FY12 FY13 FY14
Somany Kajaria (RHS)
37.6%
20.6%
16.2%
10%
20%
30%
40%
FY12 FY13 FY14
Somany Kajaria
27.1
29.5
30.5
26.1
15
20
25
30
35
10
15
20
25
30
FY11 FY12 FY13 FY14
Somany kajaria (RHS)
1.3
1.0
0.9
0.4
0.1
0.6
1.1
1.6
0.1
0.6
1.1
1.6
2.1
FY11 FY12 FY13 FY14
Somany kajaria (RHS)
14. 14
Feb 24, 2015
Kajaria Ceramics Ltd
Exhibit 43: Cash Flow Statement
YE Mar (Rs. Million) FY13 FY14 FY15E FY16E FY17E
PBT 1576 1992 2605 3327 4294
Depreciation 446 470 538 621 704
Interest 454 408 280 317 232
Tax Paid 499 678 860 1098 1417
(Inc)/dec in Net WC (595) 148 (480) (149) (331)
Other Income 30 63 46 57 69
Cash flow from operating activities 976 1662 1804 2701 3250
(Inc)/dec in capital expenditure (1543) (1568) (1800) (1700) (1800)
(Inc)/dec in investments 0 0 0 0 0
Others 8 9 4 20 48
Cash flow from investing activities (1535) (1559) (1796) (1680) (1752)
Inc/(dec) in borrowings 568 (690) (200) (300) (500)
Issuance of equity/ Warrants 754 750
Dividend paid (214) (257) (411) (523) (673)
Others 170 62 89 119 160
Cash flow from financing activities 524 (131) 228 (704) (1014)
Net change in cash (1) 17 236 317 485
Source: Company, Karvy Research
Exhibit 44: Key Ratios
YE Mar (%) FY13 FY14 FY15E FY16E FY17E
EBITDA Margin (%) 15.6 15.5 15.6 15.8 15.8
EBIT Margin (%) 12.8 13.0 13.1 13.5 13.7
Net Profit Margin (%) 6.6 6.7 7.5 7.8 8.2
Dividend Payout ratio 21.1 21.3 21.2 21.2 21.2
Net Debt/Equity 0.5 0.3 0.2 0.2 0.1
RoE (%) 30.2 25.4 23.2 24.2 25.3
RoCE (%) 36.8 32.6 30.7 33.1 34.6
Source: Company, Karvy Research
Exhibit 45: Valuation Parameters
YE Mar FY13 FY14 FY15E FY16E FY17E
EPS (Rs.) 14.2 16.4 20.8 26.6 34.2
DPS (Rs.) 3.0 3.5 4.4 5.6 7.3
BV (Rs.) 49.0 66.7 91.7 111.7 137.4
PE (x)* 14.2 24.8 35.8 28.1 21.8
P/BV (x)* 3.9 5.5 8.1 6.7 5.4
EV/EBITDA (x)* 9.0 12.9 18.0 14.5 11.8
EV/Sales (x) 3.9 3.4 2.8 2.3 1.9
Source: Company, Karvy Research, * P/E, P/BV and EV/EBITDA for FY13, FY14 are on historic basis.
15. 15
Feb 24, 2015
Kajaria Ceramics Ltd
Stock Ratings Absolute Returns
Buy : > 15%
Hold : 5-15%
Sell : <5%
Disclaimer
Analyst certification: The following analyst(s), Vignesh S.B.K, who is (are) primarily responsible for this report and whose name(s) is / are
mentioned therein, certify (ies) that the views expressed herein accurately reflect his (their) personal view(s) about the subject security (ies) and
issuer(s) and that no part of his (their) compensation was, is or will be directly or indirectly related to the specific recommendation(s) or views
contained in this research report.
Disclaimer: Karvy Stock Broking Limited [KSBL] is a SEBI registered Stock Broker, Depository Participant and Portfolio Manager and also
distributes financial products. Subsidiaries and group companies of KSBL [associates] provide services as Registrar and Share Transfer Agent,
Commodity Broker, Currency and forex broker, merchant banker and underwriter, Investment Advisory services, insurance repository services,
consultancy and advisory services, realty services, data processing, profiling and related services. Therefore associates of KSBL are likely to have
business relations with most of the companies whose securities are traded on the exchange platform. The information and views presented in this
report are prepared by Karvy Stock Broking Limited and are subject to change without any notice. This report is based on information obtained from
public sources and sources believed to be reliable, but no independent verification has been made nor is its accuracy or completeness guaranteed.
The report and information contained herein is strictly confidential and meant solely for the selected recipient and may not be altered in any way,
transmitted to, copied or distributed, in part or in whole, to any other person or to the media or reproduced in any form, without prior written
consent of KSBL. While we would endeavor to update the information herein on a reasonable basis, KSBL is under no obligation to update or keep
the information current. Also, there may be regulatory, compliance or other reasons that may prevent KSBL from doing so. The value and return on
investment may vary because of changes in interest rates, foreign exchange rates or any other reason. This report and information herein is solely
for informational purpose and shall not be used or considered as an offer document or solicitation of offer to buy or sell or subscribe for securities
or other financial instruments. Though disseminated to all the customers simultaneously, not all customers may receive this report at the same time.
KSBL will not treat recipients as customers by virtue of their receiving this report. Nothing in this report constitutes investment, legal, accounting
and tax advice or a representation that any investment or strategy is suitable or appropriate to your specific circumstances. This material is for
personal information and we are not responsible for any loss incurred based upon it. The investments discussed or recommended in this report
may not be suitable for all investors. Investors must make their own investment decisions based on their specific investment objectives and financial
position and using such independent advice, as they believe necessary. While acting upon any information or analysis mentioned in this report,
investors may please note that neither KSBL nor any associate companies of KSBL accepts any liability arising from the use of information and
views mentioned in this report. Investors are advised to see Risk Disclosure Document to understand the risks associated before investing in the
securities markets. Past performance is not necessarily a guide to future performance. Forward-looking statements are not predictions and may be
subject to change without notice. Actual results may differ materially from those set forth in projections. Associates of KSBL might have managed
or co-managed public offering of securities for the subject company or might have been mandated by the subject company for any other assignment
in the past twelve months. Associates of KSBL might have received compensation from the subject company mentioned in the report during the
period preceding twelve months from the date of this report for investment banking or merchant banking or brokerage services from the subject
company in the past twelve months or for services rendered as Registrar and Share Transfer Agent, Commodity Broker, Currency and forex broker,
merchant banker and underwriter, Investment Advisory services, insurance repository services, consultancy and advisory services, realty services,
data processing, profiling and related services or in any other capacity. KSBL encourages independence in research report preparation and strives
to minimize conflict in preparation of research report. Compensation of KSBL’s Research Analysts is not based on any specific merchant banking,
investment banking or brokerage service transactions. KSBL generally prohibits its analysts, persons reporting to analysts and their relatives from
maintaining a financial interest in the securities or derivatives of any companies that the analysts cover. KSBL or its subsidiaries collectively or
Research Analysts do not own 1% or more of the equity securities of the Company mentioned in the report as of the last day of the month preceding
the publication of the research report. KSBL or its analysts did not receive any compensation or other benefits from the companies mentioned in
the report or third party in connection with preparation of the research report and have no financial interest in the subject company mentioned
in this report. Accordingly, neither KSBL nor Research Analysts have any material conflict of interest at the time of publication of this report. It is
confirmed that KSBL and Research Analysts primarily responsible for this report and whose name(s) is/ are mentioned therein of this report have
not received any compensation from the subject company mentioned in the report in the preceding twelve months. Since associates of KSBL are
engaged in various financial service businesses, they might have financial interests or beneficial ownership in various companies including the
subject company/companies mentioned in this report.
Karvy Stock Broking Limited
“Karvy Centre”, Avenue-4, 2nd Floor, Road No: 10, Banjara Hills, Hyderabad – 500 034. India.
Tel: 91-40-2331 2454; Fax: 91-40-2331 1968
For More updates & Stock Research, visit www.karvyonline.com
Connect & Discuss More at
research@karvy.com
Toll Free: 1800 425 8283