Schema on read is obsolete. Welcome metaprogramming..pdf
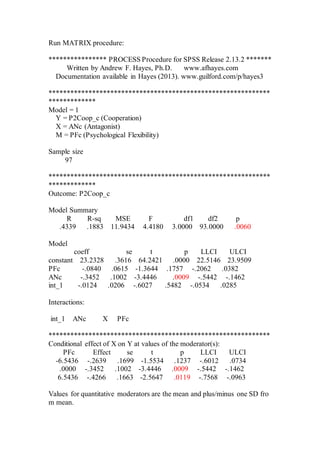
Run MATRIX procedure for SPSS Release 2.13.2
1. Run MATRIX procedure:
**************** PROCESS Procedure for SPSS Release 2.13.2 *******
Written by Andrew F. Hayes, Ph.D. www.afhayes.com
Documentation available in Hayes (2013). www.guilford.com/p/hayes3
*************************************************************
*************
Model = 1
Y = P2Coop_c (Cooperation)
X = ANc (Antagonist)
M = PFc (Psychological Flexibility)
Sample size
97
*************************************************************
*************
Outcome: P2Coop_c
Model Summary
R R-sq MSE F df1 df2 p
.4339 .1883 11.9434 4.4180 3.0000 93.0000 .0060
Model
coeff se t p LLCI ULCI
constant 23.2328 .3616 64.2421 .0000 22.5146 23.9509
PFc -.0840 .0615 -1.3644 .1757 -.2062 .0382
ANc -.3452 .1002 -3.4446 .0009 -.5442 -.1462
int_1 -.0124 .0206 -.6027 .5482 -.0534 .0285
Interactions:
int_1 ANc X PFc
*************************************************************
Conditional effect of X on Y at values of the moderator(s):
PFc Effect se t p LLCI ULCI
-6.5436 -.2639 .1699 -1.5534 .1237 -.6012 .0734
.0000 -.3452 .1002 -3.4446 .0009 -.5442 -.1462
6.5436 -.4266 .1663 -2.5647 .0119 -.7568 -.0963
Values for quantitative moderators are the mean and plus/minus one SD fro
m mean.
2. Values for dichotomous moderators are the two values of the moderator.
********************* JOHNSON
NEYMAN TECHNIQUE ************
Moderator value(s) defining Johnson-Neyman significance region(s):
Value % below % above
10.7373 94.8454 5.1546
-4.8658 24.7423 75.2577
Conditional effect of X on Y at values of the moderator (M)
PFc Effect se t p LLCI ULCI
-15.7423 -.1495 .3419 -.4374 .6629 -.8285 .5294
-14.2423 -.1682 .3125 -.5383 .5917 -.7887 .4523
-12.7423 -.1868 .2833 -.6594 .5113 -.7495 .3758
-11.2423 -.2055 .2546 -.8070 .4217 -.7111 .3002
-9.7423 -.2241 .2265 -.9895 .3250 -.6739 .2257
-8.2423 -.2428 .1992 -1.2185 .2261 -.6384 .1529
-6.7423 -.2614 .1732 -1.5093 .1346 -.6053 .0825
-5.2423 -.2801 .1490 -1.8791 .0634 -.5760 .0159
-4.8658 -.2847 .1434 -1.9858 .0500 -.5695 .0000
-3.7423 -.2987 .1278 -2.3365 .0216 -.5526 -.0448
-2.2423 -.3173 .1113 -2.8513 .0054 -.5384 -.0963
-.7423 -.3360 .1017 -3.3032 .0014 -.5380 -.1340
.7577 -.3546 .1011 -3.5082 .0007 -.5554 -.1539
2.2577 -.3733 .1096 -3.4067 .0010 -.5909 -.1557
3.7577 -.3919 .1253 -3.1272 .0024 -.6408 -.1430
5.2577 -.4106 .1460 -2.8117 .0060 -.7006 -.1206
6.7577 -.4292 .1699 -2.5269 .0132 -.7665 -.0919
8.2577 -.4479 .1957 -2.2886 .0244 -.8365 -.0592
9.7577 -.4665 .2228 -2.0935 .0390 -.9090 -.0240
10.7373 -.4787 .2411 -1.9858 .0500 -.9574 .0000
11.2577 -.4852 .2509 -1.9340 .0562 -.9833 .0130
12.7577 -.5038 .2795 -1.8026 .0747 -1.0588 .0512
14.2577 -.5224 .3086 -1.6931 .0938 -1.1352 .0903
*************************************************************
*************
Data for visualizing conditional effect of X on Y
Paste text below into a SPSS syntax window and execute to produce plot.
DATA LIST FREE/ANc PFc P2Coop_c.
BEGIN DATA.
3. -3.9662 -6.5436 24.8289
.0000 -6.5436 23.7823
3.9662 -6.5436 22.7356
-3.9662 .0000 24.6020
.0000 .0000 23.2328
3.9662 .0000 21.8636
-3.9662 6.5436 24.3751
.0000 6.5436 22.6833
3.9662 6.5436 20.9915
END DATA.
GRAPH/SCATTERPLOT=ANc WITH P2Coop_c BY PFc.
******************** ANALYSIS NOTES AND WARNINGS *******
******************
Level of confidence for all confidence intervals in output:
95.00
NOTE: The following variables were mean centered prior to analysis:
ANc PFc
NOTE: All standard errors for continuous outcome models are based on the
HC3 estimator
------ END MATRIX -----