Create a Data Visualization Dashboard with Independent Talent
•
0 likes•548 views

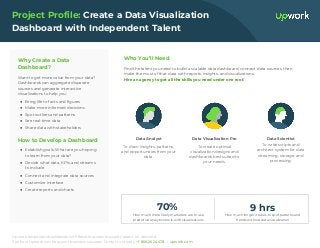
Find the talent you need to build a scalable data dashboard, connect data sources, then make the most of that data with reports, insights, and visualizations.
Recommended

Recommended
More Related Content
More from Upwork
More from Upwork (20)
Recently uploaded
Recently uploaded (18)
Create a Data Visualization Dashboard with Independent Talent
- 1. Upwork empowers businesses with flexible access to quality talent, on demand. See how Upwork can help your business succeed. Contact us today: +1 866.262.4478 | upwork.com. Project Profile: Create a Data Visualization Dashboard with Independent Talent Why Create a Data Dashboard? Want to get more value from your data? Dashboards can aggregate disparate sources and generate interactive visualizations to help you: ● Bring life to facts and figures ● Make more informed decisions ● Spot outliers and patterns ● See real-time data ● Share data with stakeholders How to Develop a Dashboard ● Establish goals. What are you hoping to learn from your data? ● Decide what data, KPIs, and streams to include ● Connect and integrate data sources ● Customize interface ● Create reports and charts Who You’ll Need Find the talent you need to build a scalable data dashboard, connect data sources, then make the most of that data with reports, insights, and visualizations. Hire an agency to get all the skills you need under one roof. How much more likely marketers are to use predictive analytics tools with visualizations 70% How much longer it takes to spot patterns and trends without data visualization 9 hrs Data Analyst To draw insights, patterns, and opportunities from your data. Data Visualization Pro To create optimal visualization designs and dashboards best suited to your needs. Data Scientist To write scripts and architect system for data streaming, storage, and processing.