2. Authors and Contributions
World Bank Team Lead
Tamer Samah Rabie, Senior Health Specialist, ECSH1, World Bank
UNICEF Team Lead
Vilma Qahoush Tyler, Nutrition Specialist, Regional Office for Central Eastern Europe
and the Commonwealth of Independent States (CEE/CIS), UNICEF
Conceptual Design
Tamer Samah Rabie, Senior Health Specialist, ECSH1, World Bank;
Abeyah Al-Omair, Public Health Specialist, ECSH1, World Bank; and
Safinaz El Hag El Tahir Ahmed, Rural Development Specialist, ECSS1, World Bank.
Timothy Schaffter, Representative, Lao PDR, UNICEF (former Representative, Kyrgyz
Republic)
Cholpon Imanalieva, Health and Nutrition Specialist, Kyrgyz Republic, UNICEF
Economic Analysis & Modeling
Zulfiqar Bhutta, Professor, Aga Khan University, with support from UNICEF
Fieldwork & Data Collection
Mark Phelan, World Bank Consultant; and
Abeyah Al-Omair, Public Health Specialist, ECSH1, World Bank.
First Draft of Report
Zulfiqar Bhutta, Professor, Aga Khan University, with support from UNICEF; and
Mark Phelan, World Bank Consultant.
Subsequent and Final Drafts
Philip Harvey, World Bank Consultant,
with contributions from:
Tamer Samah Rabie, Senior Health Specialist, ECSH1, World Bank;
Abeyah Al-Omair, Public Health Specialist, ECSH1, World Bank; and
Safinaz El Hag El Tahir, Rural Development Specialist, ECSS1, World Bank.
1
3. Table of Contents
Authors and Contributions 1
Foreword 5
Acknowledgments 6
List of Acronyms 7
Glossary 10
1. Overview 12
1.1 Report Rationale and Objective ...........................................................................................12
1.2 The Burden of Undernutrition in the Kyrgyz Republic .......................................................13
1.3 Prioritizing Nutrition Interventions in the Kyrgyz Republic................................................13
1.4 Recommended Immediate Next Steps .................................................................................15
2. Putting Nutrition in Perspective 16
2.1 Global Burden of Undernutrition .........................................................................................16
2.2 Determinants of Undernutrition ...........................................................................................17
2.3 Focusing on the ―Window of Opportunity‖ .........................................................................20
2.4 Effective Interventions Are Ready for Scaling Up ..............................................................20
2.5 Why Act Now? .....................................................................................................................21
2.6 Nutrition: A Priority for The World Bank and UNICEF .....................................................23
3. Methods 25
3.1 Assessing the Nutrition Situation and Its Context ...............................................................25
3.2 Estimating the Health and Economic Consequences of Undernutrition ..............................26
3.3 Estimating the Health and Economic Benefits of Scaling Up Nutrition Programs..............26
3.4 Analyzing Cost-Effectiveness of Nutrition Programs ..........................................................27
3.5 Summarizing Analyses and Assigning Program Priorities ..................................................27
4. Addressing Challenges and Seizing Opportunities 29
4.1 Epidemiology and Health Consequences of Undernutrition ................................................29
4.2 Economic Consequences of Undernutrition .........................................................................33
4.3 The Operational Context for Nutrition Policies and Programs ............................................34
4.4 Current Coverage and Potential Benefits of Scaled Up Nutrition Interventions .................45
4.5 Summary ..............................................................................................................................49
5. Nutrition Intervention Priorities for the Kyrgyz Republic 55
6. Putting it All Together 60
2
4. 6.1 Interpreting the Results ........................................................................................................60
6.2 Addressing the Underlying Causes of Undernutrition .........................................................61
6.3 Recommended Actions ........................................................................................................62
6.4 Moving to Action .................................................................................................................63
6.5 Immediate Next Steps ..........................................................................................................65
Annex 1. Details of Methods Used in the Analyses 67
Annex 2. Attributable Fractions, Joint Attributable Fractions, and Pathways Due to Malnutrition
for Under-Five Mortality 75
Annex 3. Causes of Death in Children and Neonates 76
Annex 4. Evidence-Based Nutrition Interventions and Target Age Groups 77
Annex 5. Effects of Newborn and Maternal Nutrition Interventions on Mortality and Nutritional
Status 89
Annex 6. Cost Effectiveness Estimates for Various Nutrition Interventions 92
Annex 7. Summary and Key Messages of The Lancet Nutrition Series 96
Annex 8. Infant and Young Child Feeding Behaviors 97
Boxes
Box 1. Impact of Food, Fuel, and Financial Crises on Food Consumption in the Kyrgyz Republic
....................................................................................................................................................... 41
Figures
Figure 1. The Causes and Consequences of Undernutrition ......................................................... 18
Figure 2. The Vicious Cycle of Poverty and Malnutrition ........................................................... 19
Figure 3. The Window of Opportunity for Addressing Undernutrition........................................ 20
Figure 4. Mechanisms by Which Agriculture Programs Might Improve Nutrition ..................... 62
Maps
Map 1. Stunting by Region in the Kyrgyz Republic, 2006 ........................................................... 30
Tables
Table 1. Impact of Undernutrition Interventions on the Millennium Development Goals .......... 16
Table 2. Estimated Benefits from Scaling Up Nutrition Interventions ......................................... 22
Table 3. Rankings of Top 10 Priorities from the Copenhagen Consensus, 2008 ......................... 22
Table 4. Nutrition Indicators in Children Under Five Years of Age, Kyrgyz Republic, 2006 ..... 29
Table 5. Burden of Disease (DALYs) Caused by Five Types of Undernutrition, Kyrgyz
Republic, 2006 .............................................................................................................................. 32
Table 6. Deaths Resulting from Undernutrition, Kyrgyz Republic, 2006 .................................... 33
Table 7. Annual NPV of Lost Workforce as a Consequence of Undernutrition, Kyrgyz Republic,
2006............................................................................................................................................... 33
3
5. Table 8. Estimated Annual Net Present Value (NPV) of Future Productivity Losses Due to
Cognitive and Physical Growth Deficits in Children Caused by Undernutrition, Kyrgyz
Republic, 2006 .............................................................................................................................. 34
Table 9. Distribution of Unified Monthly Benefit (UMB) Benefits, Kyrgyz Republic, 2008 ..... 39
Table 10. Proportion of Target Populations Covered by Selected Nutrition Interventions, Kyrgyz
Republic, 2009 .............................................................................................................................. 46
Table 11. Relative Reduction in Prevalence (%) of Undernutrition Outcomes from Maternal and
Child Interventions through Pragmatic Coverage (PC) and Universal Coverage (UC), Kyrgyz
Republic ........................................................................................................................................ 47
Table 12. Estimated Impact of Core Nutrition Interventions on Neonatal and Child Mortality,
Kyrgyz Republic ........................................................................................................................... 48
Table 13. Future Gain in Productivity by Nutrition Intervention Package at Universal Coverage,
Kyrgyz Republic, US$ .................................................................................................................. 49
Table 14. Future Gain in Workforce by Nutrition Intervention Package at Universal Coverage,
Kyrgyz Republic, US$ .................................................................................................................. 49
Table 15. Summary of Findings on the Consequences of Undernutrition, the Costs and Benefits
of Scaling Up Program, and Priorities Recommended, Kyrgyz Republic .................................... 52
4
6. Foreword
Undernutrition is a major public health problem in Kyrgyzstan, causing preventable deaths of
mothers and children and delaying the physical and cognitive development of girls and boys,
sometimes beyond repair. Despite improvements since the 1990s, 22 per cent of all deaths of
under-fives in the country are still caused by undernutrition. In 2006, some 14 percent of
children in the age group were stunted, with stunting rates in three provinces of over 20 per cent.
The burden of undernutrition on Kyrgyzstan is also substantial in economic terms: estimated to
be US$32 million annually. Deaths in the labor force from undernutrition cost the country nearly
US$5 million a year; while productivity lost to stunting and iodine deficiency loses nearly six
times more to the economy. Iodine deficiency is a key concern, accounting for almost half of the
workforce’s lost productivity.
However, this report shows that at least US$6.25 million of the country’s economic losses from
undernutrition can be prevented by improving nutrition through a combination of behavioral
changes and strengthening and scaling up of existing programs. The effects of stunting can be
treated and even reversed in children under five.
The World Bank and UNICEF are both striving to raise the global profile of nutritional issues.
The World Bank helped forge the global consensus on the Scaling Up Nutrition Framework.
Meanwhile, UNICEF is focusing on nutrition in its Medium Term Strategic Plan (2006-2013),
which includes efforts to improve young child survival and development by scaling up high-
impact, cost-effective nutrition interventions which reduce neonatal and young child deaths.
In short, direct nutrition interventions are that rare prize in development: a high-return, low-cost
investment. Delivery systems have been tested and have proved their impact in the field. They
are now ready to be scaled up nationally: all that is required from here on is political and
financial will.
Alex Kremer Jonathan Veitch
Word Bank Country Manager UNICEF Representative
Kyrgyz Republic Kyrgyz Republic
5
7. Acknowledgments
This report is a joint effort between the World Bank and UNICEF. Many individuals from both
organizations contributed to making this report a reality. We would like to express special thanks
to key contributors.
From the World Bank, we are grateful for the excellent guidance provided by Abdo S. Yazbeck
(Health Nutrition and Population, Sector Manager, ECSH1), and the support extended by Tamar
Manuelyan Atinc (VP, Human Development Network), Motoo Konishi (Country Director,
Central Asia), Mamta Murthi (Human Development, Acting Sector Director, ECSH1), and
Alexander Kremer (Country Manager, Kyrgyz Republic).
The core writing team was led by Tamer Samah Rabie (Senior Health Specialist, ECSH1), and
included Zulfiqar Bhutta (Professor, Aga Khan University, with support from UNICEF), Philip
Harvey (World Bank Consultant), and Mark Phelan (World Bank Consultant), with contributions
from Abeyah Al-Omair (Public Health Specialist, ECSH1), and Safinaz El Hag El Tahir Ahmed
(Rural Development Specialist, ECSS1). The UNICEF team was led by Vilma Tyler (Nutrition
Specialist, RO CEE/CIS, UNICEF), and included Timothy Schaffter (Representative, Lao PDR,
UNICEF—former Representative, Kyrgyz Republic), Jonathan Veitch (Representative, UNICEF
Kyrgyz Republic), Rajae Msefer Berrada (Deputy Representative, Kyrgyz Republic), Cholpon
Imanalieva (Health and Nutrition Specialist, UNICEF Kyrgyz Republic), and Arnold Timmer
(Senior Adviser Micronutrients, UNICEF, HQ).
We are grateful for the valuable comments and suggestions provided by peer reviewers,
including Meera Shekar (Lead Health Specialist, HDNHE), Luc Laviolette (Senior Nutrition
Specialist, SASHN), and Marie Chantal Messier (Senior Nutrition Specialist, LCSHH). In
addition, Timothy Schaffter (Representative, Lao PDR, UNICEF (former Representative,
Kyrgyz Republic), Arnold Timmer (Senior Adviser Micronutrients, UNICEF, HQ), and Glen
Maberly (Professor and Director, The Centre for Health Innovation and Partnership, Sydney
West Area Health Service), all provided important insights and comments further enriching this
work.
The report has also benefited from UNICEF Multiple Indicator Cluster Surveys (MICS), the
World Bank Scaling Up Nutrition framework (SUN), and The Lancet Nutrition Series.
Furthermore, the team extends its gratitude to the Ministry of Health, civil society, and the donor
community, which provided data and members of whom we interviewed for this report in the
Kyrgyz Republic.
The editing by Rosemarie M. Esber was critical to the report’s development.
Also gratefully acknowledged in the report’s preparation is the support from the World Bank
Central Contingency Fund for Scaling Up Nutrition, the Japan Trust Fund for Scaling Up
Nutrition, in addition to the UNICEF country contributions.
6
8. List of Acronyms
ACER Average cost effectiveness ratio
ADB Asian Development Bank
ANC Antenatal care
ARI Acute respiratory infection
BF Breastfeeding
BMI Body mass index
CCTs Conditional cash transfers
CDC U.S. Centers for Disease Control and Prevention
CEE/CIS Central and Eastern Europe/Commonwealth of Independent States
CI Confidence interval
DALY Disability-adjusted life year
DCPP Disease Control Priorities Project
DD Diarrheal disease
DfID Department for International Development, UK
DHS Demographic and Health Survey
EBF Exclusive breastfeeding
ECA Europe and Central Asia
ECD Early childhood development
FAO Food and Agricultural Organization
GAIN Global Alliance for Improved Nutrition
GBD Global Burden of Disease (WHO)
GDP Gross domestic product
GMI Guaranteed minimum income
GNI Gross national income
HAZ Height-for-Age Z Score
HH Household
IDD Iodine deficiency disorders
IFA Iron folic acid
IMMPaCT International Micronutrient Malnutrition Prevention and Control
IPT/ITN Intermittent preventive treatment/insecticide treated nets
IUGR Intrauterine growth retardation
IYCF Infant and young child feeding
KIHS Kyrgyz integrated household survey
LBW Low birth weight
7
9. LDF Lifetime discounting factor
MCH Maternal and child health
MDG Millennium Development Goal
MICS Multiple Indicator Cluster Survey
MMN Multiple micronutrient
MMR Maternal mortality rate
MN Malnutrition
MNP Micronutrient powders
MoH Ministry of Health
MSB Monthly Social Benefit
NGO Nongovernmental Organization
NIP National Investment Plan (Uzbekistan)
NPV Net present value
OFDA Office of U.S. Foreign Disaster Assistance
OR Odds ratio
ORT Oral rehydration therapy
PAF Population attributable fraction
PC Pragmatic coverage
PFA Programa Familias en Accion - Colombia
PHC Public health care
PM2A Preventing Malnutrition in Children Under Two Approach
RCT Randomized controlled trial
RPF Red de Proteccion Social - Nicaragua
RR Relative risk
SAM Severe acute malnutrition
SES Department of Sanitary and Epidemiology Services
SRC Swiss Red Cross
SUN Scaling Up Nutrition (World Bank framework)
SWAp Sector-wide approach
TB Tuberculosis
UC Universal coverage
UIC Urinary iodine concentration
UMB Unified Monthly Benefit
UNICEF United Nations Children's Fund
USAID United States Agency for International Development
USDA United States Department of Agriculture
USI Universal Salt Iodization
8
10. VAD Vitamin A deficiency
VAS Vitamin A supplementation
VHC Village Health Committee
WASH Water sanitation and hygiene
WAZ Weight-for-Age Z Score
WB The World Bank
WFP World Food Program
WHO World Health Organization
WHZ Weight-for-Height Z Score
WMD Weighted mean difference
YLD Years lived with disability
YLL Years of life lost
9
11. Glossary
Variable Definition
Nutrition Indicators
Percentage below minus two standard deviations (moderate)
Stunting (Height for Age)
and three standard deviations (severe) from median height for
Moderate and Severe
age of reference population
Percentage below minus two standard deviations (moderate)
Wasting (Weight for Height)
and three standard deviations (severe) from median weight for
Moderate and Severe
height of reference population
Percentage below minus two standard deviations (moderate)
Underweight
and three standard deviations (severe) from median weight for
Moderate and Severe
age of reference population
Low Birth Weight (LBW) Percentage of infants with low birth weight (< 2,500 grams)
Percentage of children 6–59 months defined as hemoglobin
Anemia
levels < 11 g/dl
Percentage of iodine deficiency measured by excretion of
Iodine Deficiency urinary iodine (< 100 ug/L in general population, 150 ug/L in
pregnant women)
Percentage vitamin A deficiency among children—level of
Vitamin A Deficiency (VAD)
serum retinol lower than 0.70 µmol/L
Maternal Risk Factors
For nonpregnant women, defined as hemoglobin levels <11.0
Anemia
g/dl
Low Body Mass Index BMI of < 18.5 (weight/height2)
(BMI)
Vitamin A Deficiency (VAD) Percentage of lactating women with a level of breast milk
retinol lower than 1.05 µmol/L
Exclusive Breastfeeding 0-3 Percentage of children who are exclusively breastfed (< 3
months months)
Exclusive Breastfeeding 0-5 Percentage of children who are exclusively breastfed (< 6
months months)
Appropriate Percentage of children who are being fed in accordance with the
Complementary Feeding (6- WHO recommendations appropriate for their age
23 months)
Mortality Indicators
Probability of dying between birth and exactly five years of age
Child Mortality Rate
expressed per 1,000 live births
Probability of dying between birth and exactly one year of age
Infant Mortality Rate
expressed per 1,000 live births
10
12. Variable Definition
UN Food and Agriculture Organization Definitions
Undernourishment The condition of people whose dietary energy consumption is
continuously below a minimum dietary energy requirement
for maintaining a healthy life and carrying out a light physical
activity with an acceptable minimum body weight for attained
height
Prevalence of Food The proportion of the population not consuming sufficient
Deprivation food to meet their energy needs
Prevalence of Food Poverty The proportion of the population below the critical level of
income (or proxy total expenditure) that represents the
monetary value of the minimum dietary energy requirement of
the population provided by a balanced energy-yielding
nutrients food basket using energy-yielding nutrient prices of
low-income population groups
Food Security The condition that exists when all people, at all times, have
access to sufficient, acceptable, safe, and nutritious food
11
13. 1. Overview
______________________________________________
1.1 Report Rationale and Objective
The World Bank and The United Nations Children’s Fund (UNICEF) jointly developed this report to
calculate the potential human and economic benefits to be gained from increasing nutrition investments in
the Kyrgyz Republic. This report provides compelling evidence of the potential to improve health and
economic outcomes through scaling up effective nutrition interventions and introducing new proven
interventions to reduce the direct causes of undernutrition in order to support the Kyrgyz government’s
commitment to the well-being and prosperous future of the Kyrgyz people.
This situational analysis examines and quantifies the scope of undernutrition in the Kyrgyz Republic by
presenting: (1) the epidemiology of undernutrition; (2) an estimate of the health consequences of
undernutrition in terms of mortality and disability adjusted life years (DALYs), and the economic losses
due to lost workforce and productivity; (3) the health, social protection, and agriculture and food
intervention systems relevant to delivering interventions for improving nutrition; (4) the current coverage
of nutrition interventions; and (5) the potential economic gains achievable by scaling up effective
nutrition interventions.
The current context is very favorable for scaling up nutrition interventions in the Kyrgyz Republic.
Investing in nutrition has increasingly proven to have excellent development and health returns. The
international development community has recognized (1) the need to scale up nutrition interventions; (2)
the potential for public-private partnerships; and, (3) a growing consensus around a common framework
for action. Reducing undernutrition worldwide is a priority for the World Bank and UNICEF, and also
critical to achieving the Millennium Development Goals (MDGs).
The authors acknowledge an imbalance between the detailed analyses undertaken on the direct causes of
undernutrition, which were available, and the more superficial analyses of the indirect or underlying
causes, such as poverty, agriculture, and education, which were less available. This imbalance results
from a lack of epidemiological evidence on the impact of interventions that affect these indirect causes of
undernutrition. Such evidence is nonetheless required to analyze the economic benefits of the various
interventions, which are essential to prioritize them, and should be the area of focus for future work.
Despite the full complement of detailed analyses, the authors strongly advocate for the recommended
multisectoral nutrition interventions – supported by best international practice – to begin. and look
forward to discussing the feasibility of the available options with national stakeholders in the next phase
of this assessment process.
The reader should be mindful of important caveats in interpreting the report’s findings. First, the best
available data were used for the analyses presented, but, despite best efforts, some key data are missing
and others are out-of-date. Second, while the models used in the epidemiological and economic analyses
have been updated since the analysis for this report was prepared, this would not dramatically alter the
presented results.
Because of these caveats, the findings, conclusions, and recommendations presented in this report are
intended as a basis for discussions with the Kyrgyz Government and local stakeholders on the best way to
proceed with investing in nutrition interventions in the immediate next steps. The key findings and
recommendations for further policy dialogue are highlighted below.
12
14. 1.2 The Burden of Undernutrition in the Kyrgyz Republic
Undernutrition in the Kyrgyz Republic remains an important public health challenge, albeit a
hidden problem. Stunting, low birth weight and deficiencies of vitamins and minerals are major barriers
to the country achieving its MDGs. In 2006, stunting rates in three Kyrgyz provinces were over 20
percent, and the proportion of low birth weight (LBW) babies was more than 5.3 percent. Further, the
persisting high prevalence of anemia continues to increase the risks of perinatal, maternal, and child
mortality, as well as impaired cognitive functioning in children. From another perspective, the long-term
effects of childhood undernutrition negatively affect the health of adults throughout their life, as well as
their potential productivity in the work force and possible economic contribution to the nation.
Undernutrition claims the lives of more than 1,500 children under five annually in the Kyrgyz
Republic. Despite some improvement in child survival, mortalities attributable to undernutrition are still
unacceptably high. Undernutrition constitutes 22 percent of all under-five deaths in the Kyrgyz Republic,
approximately 1,547 deaths annually, including neonatal deaths. Stunting and LBW constitute the major
share of mortality caused by undernutrition in children, and together, they account for 16 percent of all
under-five deaths. Severe and moderate stunting are responsible for about one-half the mortality
attributable to undernutrition while LBW is responsible for nearly a quarter.
Undernutrition accounts for approximately 17 percent of DALYs in children under five in the
Kyrgyz Republic. Some undernutrition conditions adversely affect long-term outcomes without causing
death, but cause moderate to severe disability by impairing cognitive and physical activity and/or mental
development. Among those, LBW has the biggest share, constituting about 80 percent of total
undernutrition-attributable DALYs. The share of LBW-attributable DALYs, relative to all-cause DALYs,
in children under five is as high as 13.4 percent out of total undernutrition attributable DALYs of 16.6
percent.
Undernutrition costs the Kyrgyz Republic US$32 million annually. These losses are caused by lost
productivity due to increased mortality and reduced cognitive and physical development. Workforce lost
to deaths from undernutrition costs the country US$ 4.45 million a year; productivity lost to stunting and
iodine deficiencies costs US$ 27.9 million; together they amount to approximately US$ 32 million or 0.7
percent of the Kyrgyz Gross Domestic Product. Iodine deficiency alone accounts for almost half of the
workforce’s lost productivity. The effects of undernutrition are sometimes invisible and not fully
understood over time. Therefore, the burden of undernutrition could be even greater than estimated.
1.3 Prioritizing Nutrition Interventions in the Kyrgyz Republic
About US$ 6 million could be saved annually with key nutrition interventions. Improving the
population’s nutrition through a combination of behavior changes, and strengthening and scaling up of
existing nutrition programs will recoup losses and actually improve economic performance. Effects of
stunting can be treated and even reversed in children under five. Further, direct nutrition interventions
bring very high development returns. Effective, evidence-based interventions addressing the immediate
causes of undernutrition are ready for scaling up. The estimated future economic gains in productivity and
workforce size, if nutrition intervention packages are scaled up, are US$ 6.25 million in the Kyrgyz
Republic.
The highest priority interventions will improve infant and young child feeding. These include early
initiation of breastfeeding, exclusive breastfeeding until six months of age, and timely and appropriate
complementary feeding, including micronutrient powders, together with breastfeeding from 6 to 24
months of age. Strengthening and scaling up breastfeeding promotion will save lives and help to reduce
13
15. stunting as would complementary feeding for babies six months and older. Promoting exclusive
breastfeeding for infants under six months is the most efficacious intervention to save lives, averting 9
percent of deaths from stunting-attributable under-five deaths. Kyrgyz women need to be made aware of
the benefits of breastfeeding and sound nutrition. Further, children under two should be given multiple
micronutrient powders because children require more vitamins and minerals than they can get from eating
flour. If all Kyrgyz children were to receive micronutrient powders, childhood anemia could be reduced
by approximately 20 percent.
Supplementing pregnant women with either iron folic acid or multiple micronutrients is the next
highest priority. Pregnant women require daily supplements of vitamins and minerals to meet their
substantially increased requirements. In addition to the impressive reductions in perinatal mortality as a
result of scaling up these interventions, the reductions in maternal mortality by reducing anemia are
substantial.
Expand salt iodization and flour fortification programs. Three-quarters of the country’s salt is now
iodized. Expanding iodization to all salt sold will reduce undernutrition and result in a US$ 500,000
annual benefit due to increased worker productivity. Fortifying all of the country’s flour with iron, folic
acid, and other B vitamins will reduce diet deficiencies. Ten percent of wheat is fortified. The
government’s efforts to fortify wheat flour as a public health intervention need to be further supported.
Maintain twice-annually vitamin A supplementation. The country’s program supplying vitamin A
reaches an impressive number of people and should be made permanent, as well as mechanisms
established to ensure sustained high coverage.
Expand deworming program. Expanding the current deworming program would result in an annual
future gain in productivity of US$ 450,000. Delivery costs can be lowered by combining helminth control
with other programs, such as the twice-yearly vitamin A campaign.
Zinc for the management of diarrhea. Zinc, which is not currently used to manage diarrhea, should
become part of the standard treatment. Investing in introducing this intervention and then scaling up
would result in US$ 2.28 million in economic benefits a year.
Severe acute malnutrition treatment. Treating severely malnourished children with special foods at
home or in their communities, instead of in special facilities, could avoid almost one-fifth of deaths from
wasting.
Address the underlying and basic causes of undernutrition through other sectors. While focusing on
the immediate causes of undernutrition, opportunities should also be developed and exploited through
other sectors, including social protection and agriculture. Interventions, particularly related to the
availability and affordability of food and poverty reduction strategies are important and should be further
explored. These could include smarter food subsidies, cash payments or delivery mechanisms of food to
target the very young and the very poor. Other opportunities may be found in demand-side interventions
and enhanced/innovative delivery mechanisms.
Promoting handwashing and hygiene. This approach is critical to decreasing diarrhea and other
intestinal infections. Ideally, it will be included as a part of a package of preventive practices along with
messages to improve infant and young child feeding practices.
14
16. 1.4 Recommended Immediate Next Steps
To move to the next level, both the Government of the Kyrgyz Republic and the development partners
could benefit from adopting the following immediate next steps.
Development partners could:
Disseminate the report’s findings among stakeholders for review. Country stakeholders need to
review and discuss the report’s conclusions and recommendations. Their input is an important
consideration before the recommendations can be finalized. The dissemination process is an opportunity
to involve stakeholders in the development process to strengthen the political commitment and
stewardship required to scale up and sustain the priority nutrition policies and programs.
Identify and exploit every opportunity to build national and regional capacity to design and manage
nutrition policy programs.
Work closely with government to mobilize resources to scale up the highest-priority interventions.
Direct nutrition interventions that will reduce the immediate causes of undernutrition include
breastfeeding, complementary feeding, universal salt iodization, maternal supplementation with vitamins
and minerals, and other approaches to increasing vitamin and mineral intakes, such as fortification.
Whereas, the Government of the Kyrgyz Republic could:
Incorporate recommendations from the report into existing Kyrgyz nutrition strategies and plans.
In particular, strengthen the design and implementation of the monitoring and evaluation components
within each of these plans. Where possible, update the analyses presented in the report using more
rigorous program coverage data and the latest prevalence data.
Develop mechanisms to engage the social protection, agricultural, and education sectors to address
the underlying and basic causes of undernutrition. Identifying effective approaches will require
additional research, evidence-based advocacy, and the institutional capacity to coordinate the design and
implementation of multisectoral nutrition interventions in these sectors.
15
17. 2. Putting Nutrition in Perspective
______________________________________________
2.1 Global Burden of Undernutrition
Undernutrition1 is one of the world’s most serious health problems, yet, it remains among the least
addressed. Undernutrition encompasses low birth weight, low weight-for-age (underweight), low height-
for-age (stunting), low weight-for-height (wasting), and inadequate intakes of key vitamins and minerals
(micronutrient deficiencies). In developing countries, nearly one-third of children are underweight or
stunted (Black and others 2008). Globally, undernutrition interacts with repeated bouts of infectious
disease to cause an estimated 3.5 million preventable maternal and child deaths annually. An estimated 35
percent of child deaths are attributable to undernutrition (Black and others 2008). The economic costs of
undernutrition, in terms of lost national productivity and economic growth, are huge, and these costs fall
hardest on the very poor.
Nutrition interventions are critical to achieving the Millennium Development Goals (MDGs) (World
Bank 2006). A United Kingdom consultation nutrition paper emphatically made this point. It underscored
the ―clear evidence of the critical importance of nutrition to the achievement of all MDGs and in
maximizing the effectiveness of all development interventions‖ (DFID 2008). Table 1 illustrates the
impact of a set of selected nutrition interventions on the MDGs.
Table 1. Impact of Undernutrition Interventions on the Millennium Development Goals
MDG 1. Eradicate extreme Reducing ―prevalence of underweight children under five years of age‖ is an
poverty and hunger agreed target.
MDG 2. Achieve universal Reducing undernutrition increases cognitive development and contributes to
primary education learning and school completion rates.
Maternal education and empowerment lead to better nutrition and health
MDG 3. Promote gender equality
practices. Reduces discrimination against girls in family feeding practices.
MDG 4. Reduce child mortality Enormous impact of improved nutrition in decreasing child mortality
MDG 5. Improve maternal Improved maternal nutrition and reduced maternal mortality through
health programs of behavior change and iron and folic acid supplementation.
MDG 6. Combat HIV/AIDS, Reduces maternal and child mortality due to negative interaction of
malaria, and other diseases undernutrition with HIV/AIDS and other infectious diseases.
MDG 7. Ensure environment Improving food and nutrition security reduces households’ need to adopt
sustainability environmentally unfavorable practices.
MDG 8. Global partnership for Coalescing around the need to increase awareness of world hunger and
development malnutrition.
A major reason the MDGs are not on track in many countries is that nutrition has been neglected for far
too long. The recent and startling awareness that achievement of the MDGs is vitally linked to improved
nutrition has invigorated donors and governments. They are collectively considering the potential of
renewing and broadening their focus on nutrition through synergistic multisectoral actions aimed at
prevention and intensifying proven traditional nutrition interventions.
Nutrition problems are often ―hidden‖. For example, while most micronutrient deficiencies have no
visible or clinical signs, they can be deadly, e.g., by reducing immunity. Stunting is another unnoticed
1
The term malnutrition includes both undernutrition and overnutrition or obesity. This report focuses exclusively on
undernutrition. Country nutrition strategies will normally address obesity as well.
16
18. malady with long-term damaging health and economic effects. Stunting can become normalized when
most children in a community suffer from it. Because the situation is perceived as ―normal,‖ actions are
not undertaken to resolve the problem. Those most in need of life-saving nutrition interventions—the
fetus, young children, and pregnant women—are the weakest members of society with the smallest voices
or none at all. They need concerned voices to speak and act on their behalf.
This joint World Bank/UNICEF report is an initial effort to provide compelling evidence of the potential
to improve the health and economic consequences of the Kyrgyz people through effective nutrition
interventions and to support policy makers in their commitment to the future well-being of their country.
2.2 Determinants of Undernutrition
The determinants of undernutrition must be understood to identify their causes and the range of feasible
interventions that are likely to have an impact on them. UNICEF developed the most widely used
conceptual framework to describe the causes of undernutrition (see figure 1) (UNICEF 1990). This food-
care-health framework describes three levels of undernutrition causes: immediate, underlying, and basic.
The causes at each level influence the other levels. The immediate causes of undernutrition are inadequate
dietary intake and disease. These immediate causes are impacted directly by inadequate access to food,
inadequate care provided to children, and insufficient health and environmental services. Underlying the
immediate causes of undernutrition is income poverty. Directly impacting poverty are employment
opportunities and access to productive agricultural land and technologies. Other basic determinants of
undernutrition are gender equality, girls’ education, and general governance issues, including
rural/urban/other biases in government resource allocations that do not favor the poor.
17
19. Figure 1. The Causes and Consequences of Undernutrition2
Short-term consequences: Long-term consequences:
mortality, morbidity, disability adult size, intellectual ability,
economic productivity,
reproductive performance,
metabolic and cardiovascular
disease
Maternal and child
undernutrition
Immediate
Inadequate dietary intake Disease causes
Household food Inadequate care Unhealthy household
insecurity environment and lack of
health services
Income poverty:
Underlying
Employment, self-employment,
causes
dwelling, assets, remittances,
pensions, transfers, etc.
Lack of capital: financial,
human, physical, social and
natural Basic
causes
Social, economic, and political
context
Provision of treatment and preventive health services, including hygiene and sanitation, are major
determinants of undernutrition. Measures that reduce infections reduce nutritional losses associated with
the infections, thus reducing ―child frailty‖ and improving nutritional status and survival. Pneumonia and
diarrhea remain the leading causes of death in children, and many children experience multiple episodes
each year. Infections during pregnancy dramatically increase health risks for mother and child, and
contribute to poor food absorption and utilization. Basic hygiene reduces the risk of infection, thereby
reducing nutritional losses incurred by infection. Handwashing in older infants reduces infection risk and
2
Black and others (2008) are cited as being derived from the UNICEF framework, 1990.
18
20. improves nutritional status as effectively as it does with their mothers. Available water for handwashing is
critically important to promoting these behaviors.
Figure 2 illustrates the vicious cycle of income poverty and undernutrition. Undernutrition is both a cause
and a consequence of income poverty. Undernutrition causes productivity losses in three ways: directly
through restricted physical growth; indirectly through restricted cognitive development and hence lower
learning through schooling; and by costs incurred through increased health care expenses. Undernutrition
hampers both the physical capacity to perform work and earning ability. A recent longitudinal study in
Guatemala of male children who received fortified complementary food during their first three years
found that their wages as adults were 46 percent higher than the adults who had been the control children
(Hoddinott and others 2008).
Figure 2. The Vicious Cycle of Poverty and Malnutrition
Income poverty
Hard
Low food Frequent physical Frequent Large
intake infections pregnancies families
labor
Malnutrition
Direct loss in Indirect loss in Loss in resources
productivity from poor productivity from from increased health
physical status poor cognitive care costs of ill
development and health
schooling
Access to productive agricultural land and technologies is another key determinant of food and nutrition
security. The pathways linking agricultural and nutrition are complex and changing. The two most direct
pathways are subsistence-oriented production and income-oriented production, and these depend upon
access to arable land and the technologies developed over the last few decades. Access to land remains a
major obstacle to the very poor who would benefit most from agricultural interventions harnessed to
reduce undernutrition.
The empowerment of women is particularly important to improve household nutrition outcomes,
especially for children’s nutrition. Women are consistently more likely than men to invest in their
children’s well-being. The income and resources that women control have disproportionately strong
positive effects on the health and nutrition of their children (Hawkes and others 2008). Access to
19
21. education, particularly for girls and women, is a further critical determinant of undernutrition. For
example, school curricula should include basic knowledge of good nutrition, including family nutrition
practices. The significance of women’s education to the health and nutrition of their children is an
established axiom of development planning.
The scope of the current assessment includes brief discussions of the health, social protection, and
agriculture sectors as they relate to nutrition. These descriptions are intended as a basis for future
discussions about future potential interventions with local stakeholders, rather than a thorough
examination of the linkages.
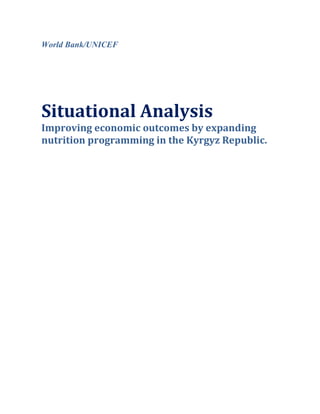
2.3 Focusing on the “Window of Opportunity”
The consensus of scientists and leading policy makers in nutrition—noted in The World Bank’s
―Repositioning Nutrition‖ (World Bank 2006), and a central conclusion of The Lancet series on
undernutrition—is that the damage to physical growth, brain development, and human capital formation
that occurs in the period before pregnancy to 24 months of age is extensive and largely irreversible.
Figure 3 shows the impact of undernutrition on regional growth patterns. The growth pattern for Central
Asian babies likely lies between those of Asia and Africa. At birth (identified in the figure by the small
oval shape), the babies of Asia are on average well below the expected weight of babies born in Africa,
Latin America, or in richer countries. This discrepancy is due to poor maternal nutrition and health, and
can only be corrected through interventions addressing these maternal issues. The larger oval shape in the
figure highlights the dramatic falloff in growth during the critical first two years of life.
The window of opportunity is very brief—only about 1,000 days. To be effective in preventing
irreversible damage, nutrition interventions must focus on this critical period of life. Investments after this
period are much less likely to improve the child’s health or nutrition.
Figure 3. The Window of Opportunity for Addressing Undernutrition
0.50
0.25
Latin America and Caribb
Weight for age Z score (NCHS)
0.00
Africa
-0.25 Asia
-0.50
-0.75
Source: World Bank 2006.
Small oval:-1.00 weight indicating maternal undernutrition and poor health.
Low birth
Large oval: Critical period for addressing growth faltering, brain development, and human capital formation.
-1.25
2.4 Effective Interventions Are Ready for Scaling Up
-1.50
The options and rationale for investing in nutrition today differ greatly from those of several decades ago.
-1.75
In January 2008, The Lancet—one of the world’s most respected medical journals—issued a special five-
part series on nutrition. This series filled a long-standing knowledge gap by marshalling systematic
-2.00
0 3 6 9 12 15 18 21 24 27 30 33 36 39 42 45 48 5
20
Age (months)
22. evidence of the impact of undernutrition on infant and child mortality and its largely irreversible long-
term effects on health and on cognitive and physical development. The authors also demonstrated the
availability of proven interventions that could address these problems and save millions of lives. The
identified set of interventions in the series focused on the ―window of opportunity‖ from minus 9 to 24
months (i.e., from pregnancy to two years old) for high-impact interventions to reduce death and disease
and avoid irreversible harm to the child. The authors estimated that universal nutrition coverage with a
full package of proven interventions (at the currently observed levels of program effectiveness) would
prevent about one-quarter of child deaths under 36 months of age, reduce the prevalence of stunting at 36
months by about one-third, and avert 60 million DALYs in the 36 worst-affected countries (Bhutta and
others 2008). Other studies drawing on a similar set of interventions have demonstrated very high cost-
effectiveness with high returns to cognitive development, individual earnings, and economic growth.
Using the evidence presented in The Lancet series as a foundation, a broad group of nutrition community
leaders came together to build consensus around a framework for scaling up actions to address nutrition.
This resulted in the Framework for Action to Scale Up Nutrition, or SUN (UN 2010). The SUN
Framework calls for two complementary approaches to reducing undernutrition. One is direct nutrition-
specific interventions, focusing on pregnant women and children aged less than two years, with short-
term public health interventions that are known to be effective, such as promoting good nutritional
practices, increasing intake of vitamins and minerals, and complementary feeding to prevent and treat
severe undernutrition. The second is a broader multisectoral nutrition-sensitive approach to development.
This approach acts to counter the determinants of undernutrition by specifically promoting agriculture and
food interventions to improve the availability, access to, and consumption of nutritious foods by
improving social protection (including emergency relief), and by ensuring access to health care (including
maternal and child health care, water and sanitation, immunization, and family planning).
2.5 Why Act Now?
There are several reasons for a major effort to address undernutrition in the Kyrgyz Republic. Partners
working toward consensus on how to reduce undernutrition most effectively in the global context
articulated these most recently (UN 2010).
1. Undernutrition is largely preventable, and the evidence of exceptionally high development returns
for a number of direct nutrition interventions is conclusive. A recent study by the World Bank
estimated the costs and the potential benefits of scaling up selected nutrition interventions at a
global level (Horton and others 2010) (see table 2). Costs per DALY saved were as low as US$ 3
(vitamin A supplementation), and benefit-cost ratios were as high as 30:1 (salt iodization). The
Copenhagen Consensus 2008 brought together world-renowned economists to consider 30
interventions as the ―best buys‖ for addressing the 10 great challenges facing global
development.3 Five of the top 10 priority interventions identified were nutrition programs. For
example, supplementation with vitamin A and zinc were recognized as the first priorities, and
iron fortification and salt iodization as the third priority (see table 3).
2. Success in reducing undernutrition is essential to meeting the MDGs and equally in contributing
to achieving the human rights of health and freedom from hunger.
3. Subsequent to the publication of The Lancet (2008) series on maternal and child undernutrition, a
consensus has been growing among development partners on how to reduce undernutrition, and
acceptance is increasing of the imperative to share advocacy for collective action.
4. Relying on improvement in underlying socioeconomic determinants of undernutrition, such as
income growth, would be a serious mistake and further prolong international development’s long-
standing neglect of nutrition. Evidence shows nutrition improvement lags substantially behind
income growth (Haddad and others 2003). Further, families with ample incomes for adequate
3
Copenhagen Consensus. http://www.copenhagenconsensus.com/Default.aspx?ID=1318. Accessed June 3, 2010.
21
23. food intake suffer from surprisingly high rates of undernutrition (Ergo, Gwatkin, and Shekar
2009).
5. The private sector has become more actively engaged in finding solutions to undernutrition,
particularly in relation to fortifying foods with micronutrients. The private sector can also help by
applying its marketing skills to ―social marketing‖ of positive nutrition messages.
6. New initiatives in the closely related areas of food security, social protection, and health systems
offer opportunities to raise the profile of nutrition in these areas, as well as to obtain financing for
nutrition through them.
In sum, today’s context for scaling up nutrition in the Kyrgyz Republic is a new and far more favorable
one than in the past. It is characterized by demonstrable and increasing proof of interventions with high
development and health returns, increased recognition of the need to scale up such interventions,
increased potential for public-private partnerships, and increased will by the international nutrition
community to agree on a common framework for action.
Table 2. Estimated Benefits from Scaling Up Nutrition Interventions
Estimated benefit: cost savings or cost
Intervention Source
effectiveness
Behavior change (through
US$53-153 per disability-adjusted life-year Ho (1985: Tamil Nadu)
community nutrition programs
saved Waters et al. (2006: Peru)
for behavior change
US$3-16 per disability-adjusted life-year Ching et al. (2000); Fiedler (2000);
Vitamin A supplements
saved Horton and Ross (2003)
US$73 per disability-adjusted life-year Robberstad et al. (2004)
Therapeutic zinc supplements
saved (zinc)
US$12.20 per disability-adjusted life-year
Sharieff et al. (2006)
Micronutrient powders saved (zinc)
37:1 benefit:cost ratio
Deworming 6:1 benefit:cost ratio Horton et al. (2008)
US$66-115 per disability-adjusted life-year
Iron-folic acid supplements saved (iron; no estimates known for folic Baltussen et al. (2004)
acid)
Iron fortification of staples 8:1 benefit:cost ratio Horton and Ross (2003, 2006)
Salt iodization 30:1 benefit:cost ratio Horton et al. (2008)
US$500-1,000 per disability-adjusted life-
Complementary foods Authors’ rough estimates a
year saved
Community-based management US$41 per disability-adjusted life-year
Bachmann (2009)
of acute malnutrition saved
Source: Horton and others 2010.
a.
Based on Caulfield et al’s (1999) estimate that increased intake of 71-164 kcal per day for children younger than one year of
age, as a result of complementary feeding, could decrease deaths due to malnutrition by 2-13 percent, depending on underlying
presence of malnutrition in the community.
Table 3. Rankings of Top 10 Priorities from the Copenhagen Consensus, 2008
Solution Challenge
1 Micronutrient supplements for children (vitamin A and zinc) Malnutrition
2 The Doha development agenda Trade
3 Micronutrient fortification (iron and salt iodization) Malnutrition
4 Expanded immunization coverage for children Diseases
5 Biofortification Malnutrition
6 Deworming and other nutrition programs at school Malnutrition & Education
7 Lowering the price of schooling Education
22
24. 8 Increase and improve girls’ schooling Women
9 Community-based nutrition promotion Malnutrition
10 Provide support for women’s reproductive role Women
Source: Copenhagen Consensus. http://www.copenhagenconsensus.com/Default.aspx?ID=1318. Accessed June 3, 2010.
2.6 Nutrition: A Priority for The World Bank and UNICEF
Nutrition is a priority for both the World Bank and UNICEF. Each institution is committed to working
collaboratively with other donors to support governments’ efforts to reduce undernutrition and achieve
the MDGs. The World Bank is striving to position nutrition in the mainstream of development initiatives,
and the Bank was instrumental in bringing global partners together to build the consensus that enabled the
SUN Framework to be developed.
UNICEF’s Medium-Term Strategic Plan’s (2006–2013) focus area of ―Young Child Survival and
Development‖ includes scaling up high-impact, cost-effective nutrition interventions to reduce the
number of neonatal and young child deaths. UNICEF’s nutrition programs in Central and Eastern Europe
and Central Asia have resulted in some major achievements, including increasing household use of
adequately iodized salt from 18 percent in 1990 to 56 percent in 2007. This has substantially improved
iodine nutrition, which directly benefits improved growth and cognitive development of children, and
hence efficiency of schooling and economic productivity. UNICEF’s long-term support of the Multiple
Indicator Cluster Surveys (MICS) has enabled countries throughout the world to continually monitor the
status of nutrition, particularly among vulnerable groups, ―through statistically sound, internationally
comparable estimates of socioeconomic and health indicators.‖
This report describes the joint effort of the World Bank and UNICEF’s situational analysis for the Kyrgyz
Republic. This information is intended to inform the further development and scaling up of policies and
programs. The report describes (1) the epidemiology of undernutrition; (2) the health consequences of
undernutrition in terms of mortality and DALYs, and the economic losses due to lost workforce and lost
productivity; (3) the health, social protection, and agriculture and food intervention systems relevant to
delivering interventions for improving nutrition; (4) the current coverage of nutrition interventions; and
finally, (5) the potential economic gains of scaling up evidence-based nutrition interventions, and the
appropriate and effective nutrition interventions to scale up.
The results makes a strong case for immediately scaling up proven interventions to reduce the direct
causes of undernutrition, and, where opportunities exist, initiate multisectoral interventions that address
the underlying and basic causes of undernutrition.
References
Black, R. E., L. H. Allen, Z. A. Bhutta, L. E. Caulfield, and others. 2008. ―Maternal and Child
Undernutrition: Global and Regional Exposures and Health Consequences.‖ The Lancet 371: 243–60.
Bhutta, Z. A., and others. 2008. ―What Works? Interventions for Maternal and Child Undernutrition and
Survival.‖ The Lancet. Published online January 17.
http://www.who.int/nutrition/topics/Lancetseries_Undernutrition3.pdf.
DFID (Department for International Development, UK). 2008. DFID and Nutrition: An Action Plan,
London: DFID, 6.
23
25. Ergo, A., D. R. Gwatkin, and M. Shekar. 2009. ―What Difference Do the New WHO Growth Standards
Make for the Prevalence and Socioeconomic Distribution of Malnutrition?‖ Food Nutrition Bulletin 30
(1): 3–15.
Haddad, Lawrence, Harold Alderman, Simon Appleton, Lina Song, and Yisehac Yohannes. 2003.
―Reducing Child Malnutrition: How Far Does Income Growth Take Us?‖ The World Bank Economic
Review 17 (1): 107–31.
Hawkes, C., and others. 2008. From Agriculture to Nutrition: Pathways, Synergies and Outcomes.
Washington, DC: World Bank.
http://web.worldbank.org/WBSITE/EXTERNAL/TOPICS/EXTARD/0,,contentMDK:21608903~pagePK
:148956~piPK:216618~theSitePK:336682,00.htm (accessed February 14, 2010).
Hoddinott, J., and others. 2008. ―Effect of Nutrition Interventions During Early Childhood on Economic
Productivity in Guatemalan Adults.‖ The Lancet 371: 411–16.
Horton, S., and others, 2010, Scaling Up Nutrition: What Will It Cost? Washington, DC: World Bank.
The Lancet, 2008, ―Maternal and Child Undernutrition,‖ Special Series, January.
United Nations. 2010. ―Scaling Up Nutrition: A Framework for Action.‖ Policy Brief. April.
http://siteresources.worldbank.org/NUTRITION/Resources/281846-
1131636806329/PolicyBriefNutrition.pdf.
UNICEF. 1990. Strategy for Improved Nutrition of Children and Women in Developing Countries,
UNICEF.
World Bank. 2006. Repositioning Nutrition as Central to Development: A Strategy for Large-Scale
Action. Washington, DC: World Bank.
24
26. 3. Methods
______________________________________________
3.1 Assessing the Nutrition Situation and Its Context
The structure we use to describe the nutrition situation and context in the Kyrgyz Republic follows the
structure proposed by Menon and others (2011). Our structure builds on the UNICEF conceptual
framework explaining the three levels of causes of undernutrition, and includes the influence of factors in
the policy context, as well as factors at the community, household, and child levels. Menon’s structure
was developed based on the experiences of scaling up nutrition interventions in several countries, which
participated in the World Bank-funded Mainstreaming Nutrition Initiative from 2006 to 2009. This report
uses the following three domains in our assessment structure:
1) Epidemiological, pertaining to the current nutritional situation in the country (e.g., prevalence and
causes of key nutrition problems), and the current body of evidence about the efficacy and
effectiveness of nutrition interventions;
2) Operational, pertaining to coverage, quality, and utilization of nutrition-related interventions and
programs, as well as the capacities, opportunities, and constraints to improving these; and
3) Economic and sociopolitical, pertaining to economic and sociopolitical factors, from community
to national and international levels, that may enhance or inhibit efforts to create positive changes
in policies and programs.
This assessment describes the first domain comprehensively and components of the second and third
domains. Detailed information about the quality of program delivery or capacities of institutions to scale
up programs, although critical to the second operational domain, was unavailable to assess. Detailed
information is presented on the third domain, the economic burden of undernutrition and the benefits of
implementing programs. We briefly describe aspects of the health, social protection, and agricultural
sectors that will be key to delivering interventions. Key sociopolitical issues, pivotal to building the
political commitment required to mobilize the resources essential to scale up nutrition interventions, need
to be examined. These issues include how resources are allocated to curative or preventive health
programs, the relative priorities assigned to programs designed to build human capital, and the extent to
which donors are aligned in direction and process to promote favored development objectives.
Understanding these sociopolitical issues is critical to realize the full potential that improving nutrition
will contribute to achieving the MDGs in the Kyrgyz Republic. To understand the issues in-depth,
interviews and discussions are required with key policy makers and program managers. These discussions
should take place as an immediate next step to further develop the recommendations made in this report.
The primary source of data for this assessment was the most recent MICS. Additional sources are
indicated where they were used. They include Demographic and Health Surveys (DHSs); Nutrition
Landscape Information System of the World Health Organization (WHO);4 country-specific national or
subnational surveys of the food security, nutrition, and micronutrient situation; routine Ministry of Health
(MoH) data; and information from national nutrition plans and programs. Published and unpublished
reports were collected from the country offices of UNICEF, the World Bank (WB), WHO,
4
WHO. Nutrition Landscape Information System. http://apps.who.int/nutrition/landscape/report.aspx. Accessed
February 15, 2010.
25
27. nongovernmental organizations (NGOs), and government ministries. Documentation available on
websites was also used.
3.2 Estimating the Health and Economic Consequences of Undernutrition
The consequences of undernutrition in terms of DALYs and mortality in children less than five years of
age were estimated with the methods used in the WHO Global Burden of Disease, 2004 (Murray and
others 2001) and in The Lancet series on Maternal and Child Undernutrition, 2008. A DALY is a health
gap measure and provides a comprehensive summation of information that includes the impact of
premature death, disability, and other non-fatal health outcomes. This indicator was used to count the
nonfatal but important adverse consequences of iron and iodine deficiencies, for example. One DALY can
be thought of as one lost year of healthy life. It measures the gap between the current health status of the
target population and an ideal situation where everyone lives into old age free of disease and disability.
Mortality resulting from undernutrition was calculated with measures of attributable mortality and relative
risk (These epidemiological concepts are explained in annex 1.). Based on these risk coefficients, as well
as the UNICEF statistics for prevalence of undernutrition and demographic and mortality statistics, we
calculated the number of annual deaths attributable to malnutrition. Using standard statistical methods,
joint attributable fractions were calculated to avoid the double counting of deaths that occurs when cause-
specific mortality attributed to individual risk factors is simply added up. Methods and formulas used are
described in annex 1.
Economic productivity is lost through both mortality and the reduced cognitive and physical development
caused by undernutrition. The Kyrgyz Republic’s net economic deficits as a consequence of
undernutrition, including micronutrient deficiencies, was assessed by measuring workforce losses (based
on premature mortality attributable to undernutrition) and future productivity losses among survivors
(based on deficits in education and lower labor productivity). We applied similar methods to those used in
the calculations made for The Lancet (2008) series on undernutrition and in the Uzbekistan National
Investment Plan (NIP).5 Economic losses due to six types of undernutrition that are widely prevalent were
calculated. These were LBW, stunting, severe wasting, anemia, vitamin A deficiency, and iodine
deficiency in children under five years of age. The net present values of losses from undernutrition due to
lost workforce (mortality) and child productivity (reduced cognitive and physical development) were
calculated using the algorithms developed for the Uzbekistan NIP, which are also applicable to the
Kyrgyz Republic.
3.3 Estimating the Health and Economic Benefits of Scaling Up Nutrition Programs
Information on existing nutrition interventions and their coverage levels were used to investigate potential
options to reduce undernutrition. The goal of this exercise was to determine the efficacy of selected
maternal and child interventions in reducing undernutrition, using as a reference the recent Lancet
undernutrition and primary care series.
Field site visits to the Kyrgyz Republic were carried out in April–May 2009 and included a number of
meetings with stakeholders to discuss and gather information on the epidemiology of nutrition and
5
The Uzbekistan Nutrition Investment Plan (NIP) was a multisectoral consultation conducted in 2007 and involved
key stakeholders from government and private sectors. The NIP process included participation of experts from the
Ministry of Health, Ministry of Public Education, Ministry of Economy, Ministry of Finance, and Tax Committee as
well as representation from food industries, national media, and NGOs. Representatives of UNICEF, the World
Bank, and the WHO participated and provided technical assistance.
26
28. operational details of programs, including activities, beneficiaries, durations, coverage rates, and where
possible, budgets.
Based upon evidence on efficacy and effectiveness presented in The Lancet series, nutrition interventions
were categorized as Universal Interventions that have sufficient evidence to warrant implementation,
Situational Interventions that have evidence supporting their implementation in specific situational
contexts, and Other Supportive Strategies for which the current evidence is insufficient or the
effectiveness varies.
The impact of The Lancet-recommended nutrition interventions on reducing mortality and improving
nutrition outcomes for women, newborns, and children was assessed by using a previously described and
validated sequential model (Bhutta and others 2008). The expected reductions were estimated in
prevalence of undernutrition and mortality from each intervention that would result from increasing
coverage by 20 percent, a ―pragmatic‖ increase, and universal coverage (100 percent).
Cumulative economic gains—achieved by investing in particular nutrition interventions—were calculated
by comparing the national economy’s annual loss due to undernutrition with the effectiveness of existing
nutrition interventions. The gains obtained after addition of new interventions and scaling up existing
interventions are reflected as a percentage of the losses offset by the interventions.
3.4 Analyzing Cost-Effectiveness of Nutrition Programs
The analysis of the cost-effectiveness of current nutritional interventions in the Kyrgyz Republic is based
upon data from the Copenhagen Consensus,6 the Disease Control Priority Project,7 and The Lancet (2008)
nutrition series.
These calculations are complex and were carried out by the team that developed the methods and
undertook many of the calculations for The Lancet series on undernutrition. Details of the estimates of
cost effectiveness from the literature are presented in annex 6.
3.5 Summarizing Analyses and Assigning Program Priorities
Rankings for interventions were developed by considering three criteria: (1) expected impact on
mortality, (2) expected economic returns on investments (benefits/cost effectiveness), and (3) feasibility
of implementation at scale. Two ranking systems were developed: numbers suggesting operational
priority and letters ―grading‖ evidence for interventions. Both rankings took into account the first two of
the three criteria, and the number ranking assigned more weight to operational feasibility. The letter
ranking assigned greater weight to the ―evidence base‖ as set out in The Lancet series, and placed less
emphasis on pragmatic operational details. Importantly, the two sets of rankings are intended as a basis
for discussion with local stakeholders who can provide a clearer understanding of the operational contexts
of the interventions, and whose buy-in to the priorities set of interventions will ultimately determine the
success and sustainability of their implementation.
6
Copenhagen Consensus. http://www.copenhagenconsensus.com/Home.aspx. Accessed November 10, 2009.
7
WHO-Choice: Choosing Interventions That Are Cost-Effective. http://www.who.int/choice/en/. Accessed April 1,
2010.
27
29. References
Bhutta, Z. A., S. Ali, S. Cousens, T. M. Ali, B. A. Haider, A. Rizvi, P. Okong, S. Z. Bhutta, and R. E.
Black. 2008. Alma-Ata: Rebirth and Revision 6 Interventions to Address Maternal, Newborn, and Child
Survival: What Difference Can Integrated Primary Health Care Strategies Make?‖ The Lancet 372 (Sep
13): 972–89.
The Lancet, 2008, ―Maternal and Child Undernutrition,‖ Special Series, January.
Menon P, Pelletier DL, Frongillo EA, Stoltzfus RJ, Ahmed AMS, Ahmed T. 2011. ―Assessment of
epidemiologic, operational, and sociopolitical domains for mainstreaming nutrition.‖ Food and Nutrition
Bulletin 32 (2 Suppl):S105-S114.
Murray, C. J. L., A. D. Lopez, C. D. Mathers, and C. Stein. 2001. ―The Global Burden of Disease 2000
Project: Aims, Methods and Data Sources.‖ Global Program on Evidence for Health Policy Discussion
Paper No. 36. World Health Organization.
28
30. 4. Addressing Challenges and Seizing Opportunities
______________________________________________
This chapter describes the Kyrgyz Republic’s nutrition context, including the biological, epidemiological,
and operational aspects of sectors, through which interventions could be delivered. It also discusses the
economic burden of undernutrition and the possible estimated health and economic gains achievable by
scaling up priority interventions to address the immediate causes of undernutrition. Finally, it makes
initial suggestions for recommended actions as a basis for discussions to determine the country’s next
steps.
4.1 Epidemiology and Health Consequences of Undernutrition
Results of the 2006 MICS indicate that the nutritional status of Kyrgyz children has improved
substantially since the late 1990s. Nevertheless, stunting remains a serious problem. In 1996, almost 25
percent of children aged 0–35 months were stunted, as were 14 percent of children under five in 2006
(table 4).8 Stunting carries important negative health and economic consequences, particularly in the three
provinces with stunting rates over 20 percent—Batken, 22 percent, Issyk-Kul, 23 percent, and Talas, 27
percent (see map 1). The prevalence of stunting was higher among children in rural areas (15.7 percent)
than in urban areas (10.8 percent). Mothers with more years of schooling had children less likely to be
stunted. Children from poorer households (the first and second quintiles of the wealth index) had a higher
prevalence of stunting (18.8 percent and 14.9 percent, respectively) than children in the higher wealth
quintiles (10–12 percent). While the prevalence of wasting is only 4 percent nationwide, it is substantially
higher in Jalal-Abad (9.2 percent) and Issyk-Kul (7.8 percent) provinces. The prevalence of wasting
across other demographic variables was similar to that described for stunting.
The proportion of LBW babies being born is an indicator of undernutrition during gestation, a critical
period for growth and development. In 2006, more than 5.3 percent of infants nationwide were born with
LBW. Of particular concern was Naryn Oblast, with 10 percent LBW, almost double the national
average. That the proportion of LBW is highest in the richest quintile (see table 4) is an unexpected
finding. Although, it may be due to chance, additional investigation is warranted to rule out other possible
causes. Potential explanations to explore would include a higher survival rate of LBW babies in this
group, which presumably have better access to health services, or the use of alcohol and tobacco during
pregnancy, which are major causes of LBW in ―rich‖ countries.
Table 4. Nutrition Indicators in Children Under Five Years of Age, Kyrgyz Republic, 2006
Low birth
Stunting Wasting Underweight
weight
Batken 21.5 3.3 5.5 4
Jalal-Abad 8.3 9.2 2.5 4
Issyk-Kul 22.6 7.8 6.9 4
Naryn 13.7 1.9 9 4
Region
Osh 15.2 1 2.7 10
Talas 27.3 2 4.8 5
Chui 10.5 2.9 2.3 4
Bishkek 8.5 2.1 2.1 6
8
The prevalence of stunting would have been higher than 25 percent had children 3–5 years been included in the
1996 calculations. Therefore, the reduction in prevalence was even greater than the available numbers indicate.
29
31. Urban 10.8 2.7 3.4 6
Locality
Rural 15.7 4.1 3.4 5
None 21.7 6.4 11.8 6
Maternal Primary 14.2 3.6 3.0 5
education Secondary or
9.7 1.9 2.4 4
higher
Poorest 19 3 3 5
Second 15 3 3 4
Wealth
Middle 13 6 4 5
quintiles
Fourth 12 3 4 5
Richest 10 3 3 7
Total 13.7 4 3.4 5.3
Map 1. Stunting by Region in Kyrgyz Republic, 2006
No nationally representative data on the prevalence of micronutrient deficiencies were available for this
report. Prevalences of anemia and vitamin A deficiency were available for children aged 6–24 months and
women of reproductive age from a population-based survey carried out in Talas Oblast in 2008. Anemia
was common in both children (50.6 percent) and women (24.5 percent). About one-third (32 percent) of
children had serum retinol levels indicating vitamin A deficiency.
The prevalences of both maternal and child anemia are high. Both contribute significantly to maternal and
infant mortality and impaired cognitive development. The first national estimates of anemia prevalence
are from the 1997 DHS, which covered children under three years of age. At that time, almost 50 percent
of children and 38 percent of women of reproductive age were anemic. Preliminary results of a 2008
survey in Talas Oblast (supported by UNICEF, the Swiss Red Cross (SRC), and the U.S. Centers for
Disease Control and Prevention (CDC)) reported that just over 50 percent of children 6–24 months old
and 25 percent of mothers were anemic. This continuing high prevalence of anemia is a serious public
health problem because it increases the risks of perinatal, maternal, and child mortality, as well as
30
32. impaired cognitive functioning in children. A national micronutrient survey including estimates of anemia
prevalence was undertaken in 2009; preliminary results were expected to be available in June 2010.9
The 2006 MICS report noted that 76 percent of Kyrgyz households were consuming adequately iodized
salt (≥ 15 mg/kg iodine), and 98 percent of households were consuming salt with some iodine. The
Universal Salt Iodization (USI) program, enacted into law in 2001, was further evaluated in a national
iodine survey in 2007 (Sultanalieva and others 2009). This evaluation indicated a substantially lower
proportion of households with adequately iodized salt (39.5 percent) than was reported in 2006.
Biological assessment indicated that schoolchildren had adequate iodine nutrition—a median urinary
iodine concentration (UIC) of 114 µg/L, which is greater than the WHO cutoff, indicating adequate intake
for this age group (100 µg/L). The median UIC for pregnant women was 111 µg/L, and this is
substantially less than the WHO cutoff of 150 µg/L, indicating adequate intake for the higher
requirements of this population group.10 That pregnant women were not consuming adequate amounts of
iodine to meet their requirements was confirmed with the finding that goiter size increased during
pregnancy.
Childhood infections interact with nutritional status. Together with the quantity and quality of food
and child care practices, infections are a major cause of undernutrition. Managing and preventing them
contributes enormously to reducing undernutrition. This section describes the infections with the greatest
negative impact on nutrition.
Diarrhea is one of the leading causes of death among children under five worldwide. In the Kyrgyz
Republic, the mortality rate among children under five due to diarrhea per 100,000 people was 23.8 in
2008, 19.3 in 2009 and 15.4 in 2010, according to the MoH.11 The 2006 MICS showed that only 20
percent of the children reported as having had diarrhea in the previous two weeks received any oral
rehydration therapy (ORT), and three-quarters of that was home treatment. Furthermore, MICS indicated
that only 25 percent of cases received any increase in volume of fluids, and 75 percent received just
adequate or lower volume of fluids. Children in rural areas reported 1.5 more episodes of diarrhea
compared to children in urban areas.
The burden of soil-transmitted helminth infections in the Kyrgyz Republic is extremely high.
Epidemiologic surveys conducted by UNICEF and local governments have consistently shown parasite
burdens of 50 percent or more among the general populations, and 75 percent among school-aged
children.12 One of the leading causes of this problem in the Kyrgyz Republic is the lack of access to
improved sources of drinking water and the lack of sanitary means of excreta disposal. According to the
2006 MICS, 11.8 percent of the population did not have any access to clean drinking water. The highest
proportions of the population consuming water from springs, surface water bodies, rivers, and a network
of earth canals were reported in the Batken Oblast (24.3 percent) and Osh Oblast (21 percent).
Feeding behaviors are a major determinant of nutritional status. A common factor in child
undernutrition is poor infant and young child feeding (IYCF) practices. While part of the problem is the
lack of access to nutritious foods for children, another significant factor is that mothers lack a general
awareness of what constitutes proper nutrition for young children. The core of IYCF practices is in
breastfeeding behaviors and timely, appropriate complementary feeding. Breastfeeding can be further
9
Rafa Flores, personal communication, March 12, 2010.
10
WHO. Assessment of Iodine Deficiency Disorders and Monitoring Their Elimination: A Guide for Programme
Managers, 3rd edition. Page 32. http://www.who.int/nutrition/publications/micronutrients/iodine_deficiency
/9789241595827/en/index.html. Accessed June 27, 2010.
11
Ministry of Health, Kyrgyz Republic, official statistics 2010 .
12
http://www.unicef.org/kyrgyzstan/reallives_13803.html.
31
33. categorized as early initiation, exclusive breastfeeding for the first six months, and continued
breastfeeding from 6 to 24 months, with complementary foods. Data from MICS showed a 65 percent rate
of timely initiation of breastfeeding (mothers start breastfeeding their newborn within one hour of birth),
and nearly 90 percent initiated within one day. Slightly less than one-third (31.5 percent) of infants 0–6
months were exclusively breastfed in 2006; this is low. The proportion was lowest in Bishkek, with only
16 percent of mothers exclusively breastfeeding their infants less than six months of age. The highest rate
of exclusive breastfeeding was in Osh Oblast, 52 percent. Only 38 percent of infants 6–12 months were
fed as frequently and with a sufficiently diverse diet as the WHO recommends. Details of the variation in
IYCF behaviors across geographic and demographic factors reported from the MICS are presented in
annex 8. More detailed information about IYCF behaviors is necessary to design effective interventions.
For example, it will be important to understand the main barriers to breastfeeding and the major
determinants of the timing, frequency, and quality of complementary feeding.
Health consequences. Undernutrition causes mortality and reduces cognitive and physical development.
This section describes the consequences of undernutrition in the Kyrgyz Republic that were estimated in
terms of DALYs and mortality. Table 5 shows the burden of disease expressed in terms of DALYs. Males
and females are listed separately because the calculations of future productivity losses are calculated
separately for males and females (described in annex 2). Among children under five, LBW accounts for
more than 13 percent of all causes of DALYs in the Kyrgyz Republic, the highest proportion of all forms
of undernutrition.
Table 5. Burden of Disease (DALYs) Caused by Five Types of Undernutrition, Kyrgyz Republic, 2006
Children 0–4.9 years
Females 15–44
years
Male Female Total
All causes DALYs 171,190 145,648 316,839 186,353
Growth deficiencies
Low birth weight 23,738 18,688 42,426 (13.4%) --
Stunting 3,109 3,032 6,141 (1.9%) --
Micronutrient deficiencies
Iron-deficiency anemia 1,027 963 1,990 (0.6%) 4163 (2.2%)
Iodine deficiency 978 1,012 1,990 (0.6%) 3 (0.0%)
Vitamin A deficiency 12 12 24 (0.01%) --
21.8 percent (n = 1,547) of the total under-five deaths per year, estimated in 2004 for the Kyrgyz
Republic (N = 7,099; see annex 3), were attributable to undernutrition (table 6). Severe and moderate
stunting was the major cause of malnutrition-attributable mortality, accounting for roughly 50 percent of
deaths (768/1547, 49.6 percent). The second most common cause of malnutrition attributable deaths was
LBW (25 percent). It is notable that the milder form of LBW (2,000–2,499 g) contributes more to the
burden of undernutrition than the more severe form (< 2,000 g).
32
34. Table 6. Deaths Resulting from Undernutrition, Kyrgyz Republic, 2006
Estimated
Form of undernutrition Prevalence Relative risk
annual deaths
Low birth weight
1,500–1,999 g 0.6 8.1 139
2,000–2,499 g 4.4 2.8 249
Vitamin A deficiency
< 5 months 18.0 1.25 146
6–59 months 32.0 1.47 (DD) & 1.35 (ARI) 105
Stunting
<-3 SD 3.7 4.1 442
<-2 SD 13.7 1.6 326
Wasting
<-3 SD 0.4 9.4 140
Total 1,547
Note: DD = diarrheal disease; ARI = acute respiratory infection.
4.2 Economic Consequences of Undernutrition
The economic costs of undernutrition result from both the workforce losses because of nutrition-related
mortality and the productivity losses from reduced cognitive and physical capacities of the surviving
workforce.
Cost of lost workforce due to mortality from undernutrition. The economic costs of undernutrition
caused by deaths attributable to undernutrition and the value of the subsequent lost workforce are shown
in table 7. The models used were based on the Uzbekistan NIP. A detailed description of the methods
used can be found in annex 1. Net present values (NPVs) estimate, in today’s economic terms, the value
of future losses caused by undernutrition. All calculations are NPVs expressed in millions of U.S. dollars.
Table 7. Annual NPV of Lost Workforce as a Consequence of Undernutrition, Kyrgyz Republic, 2006
Number of Lifetime discounting Value
Form of malnutrition
deaths factor (LDF) (US$ millions)
Low birth weight 388 From birth: 14.9 1.28
Vitamin A deficiency 251 From 5 years: 17.42 0.97
Stunting 768 From 5 years: 16.9 1.86
Wasting 140 From 5 years: 16.9 0.34
Total 1,547 4.45
Cost of future workforce productivity losses due to undernutrition. Table 8 shows the economic costs
of future productivity losses among survivors. These losses are due to childhood undernutrition and
deficiencies which caused deficits in educational abilities and therefore lost labor productivity. Annual
productivity losses were estimated at both a 3 percent and 10 percent discount rate (two values commonly
employed in health project analysis). Iodine deficiency disorders contribute more than half of these
losses; childhood anemia and stunting are also major contributors.
33