
Recommended
More Related Content
Viewers also liked
Viewers also liked (16)
Q4 2011 Industrial
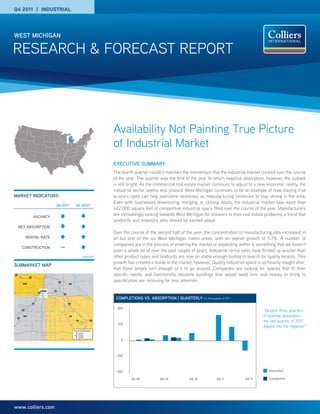
- 1. Q4 2011 | INDUSTRIAL WEST MICHIGAN RESEARCH & FORECAST REPORT Availability Not Painting True Picture of Industrial Market EXECUTIVE SUMMARY The fourth quarter couldn’t maintain the momentum that the industrial market created over the course of the year. The quarter was the first of the year to return negative absorption; however, the outlook is still bright. As the commercial real estate market continues to adjust to a new economic reality, the industrial sector seems less phased. West Michigan continues to be an example of how staying true MARKET INDICATORS to one’s roots can help overcome obstacles, as manufacturing continues to stay strong in the area. Even with businesses downsizing, merging, or closing doors, the industrial market saw more than Q4 2011 Q1 2012* 422,000 square feet of competitive industrial space filled over the course of the year. Manufacturers VACANCY are increasingly looking towards West Michigan for answers to their real estate problems, a trend that landlords and investors alike should be excited about. NET ABSORPTION Over the course of the second half of the year, the concentration of manufacturing jobs increased in RENTAL RATE all but one of the six West Michigan metro areas, with an overall growth of 5.7%. A number of companies are in the process of entering the market or expanding within it, something that we haven’t CONSTRUCTION — seen a whole lot of over the past couple of years. Industrial rental rates have firmed up quicker than *projected other product types and landlords are now on stable enough footing to search for quality tenants. This growth has created a divide in the market, however. Quality industrial space is so heavily sought after, SUBMARKET MAP that there simply isn’t enough of it to go around. Companies are looking for spaces that fit their 96 4 Mile Rd NW 4 Mile Rd NE specific needs, and functionally obsolete buildings that would need time and money to bring to specification are receiving far less attention. 96 Knapp St NE 44 96 NW 131 Knapp St NE NE Pe ttis Leonard St NE Leonard St NE Av eN E DTWN 196 45 45 196 96 E Fulton St E Fulton St COMPLETIONS VS. ABSORPTION | QUARTERLY (in thousands of SF) 21 Hall St SE Ca sca 196 96 de Rd 11 44 SE Dr SW 500 “Despite three quarters go 196 ica Ch Clyde Park Ave SW 28th St SW 28th St SE 28th St SE 11 11 Baldwin St SW SE of positive absorption, Breton Rd SE 36th St SE 196 Kalamazoo Ave SE S Division Ave Eastern Ave SE 44th St SW 131 44th St SE Gerald R. Ford 96 the last quarter of 2011 250 Byron Center Ave SW International dipped into the negative” Airport 52nd St SW 37 196 6 Industrial Submarkets 6 6 6 NW Northwest 68th St SE NE Northeast DTWN Downtown SW Southwest SE Southeast 76th St SE 0 -250 -500 Absorbed 4Q 09 2Q 10 4Q 10 2Q 11 4Q 11 Completed www.colliers.com
- 2. RESEARCH & FORECAST REPORT | Q4 2011 | INDUSTRIAL | WEST MICHIGAN Simply put, market perception continues to trail 37% decrease. We feel this statistic is an VACANCY RATE market reality. There are a number of vacant important one that helps reveal how the market Quarterly spaces and many of them are becoming less and is reacting to current conditions. 10% less competitive. The Northwest submarket of Grand Rapids saw its vacancy rate rise by 40 Another useful measurement is average asking basis points, while the Southeast submarket sale and lease prices. Industrial sale prices have 9% lowered its vacancy by 20 basis points, a sign increased more than 17% since the start of the that the market is reacting differently based on year and nearly 22% since the end of the first the quality of product available. quarter, bringing capitalization rates down as 8% well. Average asked lease rates have remained 4Q 09 2Q 10 4Q 10 2Q 11 4Q 11 CURRENT CONDITIONS relatively stable through much of the year, but have clearly bottomed out and are looking to Vacancy rose in the fourth quarter to 8.8%, trend back upwards. It is important to remember, although it is down for the year from its 9.2% though, that these averages paint the market ASKING RENTAL RATES starting place. Despite seeing an increase in picture with a single brush stroke, despite Quarterly ($/SF/Yr. Triple Net) vacancy, overall activity picked up from last different segments of the market and different $5 quarter. There were 31 sales in the marketplace industrial building types behaving very differently. compared to 28 a quarter ago. Leasing velocity True market knowledge is as important as ever. $4 picked up as well, growing from 42 leases last Creative solutions to real estate needs continue quarter to 52 in the fourth quarter. Again, despite to push deals through the sludge of the economy. $3 the perception of an abundance of empty In the fourth quarter, we saw Lumbermen’s, buildings, good quality space that is flexible is Inc.’s needs filled by finalizing a deal to put them $2 being transacted at an increased rate. into 200,000 square feet at 8715 Byron 4Q 09 2Q 10 4Q 10 2Q 11 4Q 11 Commerce Drive. To make this move happen, R&D/Flex General Warehouse/ A useful metric for measuring the market is however, two existing tenants needed to be Industrial Distribution average time a building or space is listed before relocated. Colliers then negotiated deals to move being transacted. In 2009, this number was R.E.D. Stamp, Inc. into 46,000 square feet at approximately 216 days. By the end of 2010, the 3800 Patterson and R.L. Plastic Inc. into 100,000 number had climbed to nearly 345 days; square feet at 7377 Expressway Drive. In total, however, 2011 brought a reversal of this trend. nearly 350,000 square feet of industrial space Spaces are being transacted at a quicker rate, was transacted, a deal with a lot of moving parts, and thus the average time on market has since but one that was orchestrated using creativity fallen back down to roughly 219 days, a nearly and market knowledge. RECENT TRANSACTIONS SALES ACTIVITY PROPERTY ADDRESS SIZE SF SALE PRICE PURCHASER SUBMARKET CITY 3403 Lousma Dr. SE 12,080 $235,000 Fisk Reeds Re, LLC Southeast Wyoming 5633 52nd St. SE 56,990 $650,000 SSBB, Inc Southeast Grand Rapids 879 Productions Pl. 24,600 $587,500 LH Partners, LLC Holland - South Holland 11007 Chicago Dr. 39,200 $289,000 Square Foot Leasing, LLC Holland - South Holland 4909 Wayne Rd. 216,390 $850,000 Behnke Logistics, LLC Battle Creek FCIP/Airport Battle Creek 13401 New Holland St. 57,000 $325,000 NH Building IOT, LLC Holland - North Holland 5670 West River Dr. NE 44,264 $900,000 Rodriguez Investments, LLC Northeast Belmont LEASING ACTIVITY PROPERTY ADDRESS SIZE SF LEASE TYPE TENANT SUBMARKET CITY 5079 33rd St. SE 85,595 Relocation ATEK Medical, LLC Southeast Grand Rapids 11373 E. Lakewood Blvd. 13,692 Relocation Xact Industries, Inc Holland - North Holland 101 E. Roosevelt 15,000 Renewal - Expansion Outsource One, Inc Lakeshore - Zeeland Zeeland 4140 East Paris Ave. SE 152,700 Renewal X-Pedx (International Paper) Southeast Kentwood 1525 Gezon Pkwy. SW 12,000 New Deal United Logic, Inc Southwest Wyoming 12688 New Holland St. 50,053 New Deal J.R. Automation Technologies, LLC Holland - North Holland 5801 Weller Ct. SW 9,600 New Deal Honeywell International Southwest Wyoming P. 2 | COLLIERS INTERNATIONAL
- 3. RESEARCH & FORECAST REPORT | Q4 2011 | INDUSTRIAL | WEST MICHIGAN NET AVG. TOTAL TOTAL VACANCY RATE ABSORPTION ASKING SUBMARKET BLDG TOTAL SF VACANT SF VACANCY RATE PRIOR QTR CURRENT QTR RENT DOWNTOWN General 237 10,704,364 328,112 3.1% 3.1% - $2.49 Incubator 5 74,307 - 0.0% 0.0% - $- R&D/Flex 1 95,000 - 0.0% 0.0% - $- Warehouse/Storage 8 1,273,941 25,000 2.0% 2.0% - $2.63 TOTAL 251 12,147,612 353,112 2.9% - $2.47 NORTHEAST General 132 5,648,814 355,621 6.3% 6.5% 9,810 $4.35 Incubator 0 - - 0.0% 0.0% - $- R&D/Flex 6 75,511 15,509 20.5% 20.5% - $6.38 Warehouse/Storage 1 12,000 - 0.0% 0.0% - $- TOTAL 139 5,736,325 371,130 6.5% 9,810 $4.37 NORTHWEST General 249 11,219,878 1,120,187 10.0% 9.9% (10,700) $3.15 Incubator 6 116,772 5,500 4.7% 4.7% - $3.75 R&D/Flex 3 61,844 7,844 12.7% 12.7% - $3.80 Warehouse/Storage 26 4,562,916 1,003,570 22.0% 20.9% (50,750) $2.88 TOTAL 284 15,961,410 2,137,101 13.4% 13.0% (61,450) $3.08 SOUTHEAST General 602 38,064,739 3,491,013 9.2% 9.4% 95,470 $2.99 Incubator 2 17,572 5,000 28.5% 28.5% - $7.50 R&D/Flex 63 2,019,721 348,304 17.2% 17.2% - $4.50 Warehouse/Storage 48 8,609,933 1,038,843 12.1% 12.1% - $3.15 TOTAL 715 48,711,965 4,883,160 10.0% 95,470 $3.08 SOUTHWEST General 451 21,581,037 1,541,338 7.1% 6.4% (102,382) $3.50 Incubator 5 108,003 5,500 5.1% 5.1% - $2.85 R&D/Flex 27 943,023 186,157 19.7% 15.7% (38,484) $4.90 Warehouse/Storage 39 7,026,321 452,633 6.4% 6.0% (30,000) $3.18 TOTAL 522 29,658,384 2,185,628 7.4% 6.6% (170,866) $3.47 MARKET TOTAL General 1671 87,218,832 6,836,271 7.8% 7.7% (7,802) $3.16 Incubator 18 316,654 16,000 5.1% 5.1% - $2.77 R&D/Flex 100 3,195,099 557,814 17.5% 16.3% (38,484) $4.52 Warehouse/Storage 122 21,485,111 2,520,046 11.7% 11.4% (80,750) $3.07 TOTAL 1,911 112,215,696 9,930,131 8.8% 8.7% (127,036) $3.18 NET AVG. TOTAL TOTAL VACANCY RATE ABSORPTION ASKING BLDG TOTAL SF VACANT SF VACANCY RATE PRIOR QTR CURRENT QTR RENT QUARTERLY COMPARISON AND TOTALS Q4-11 1,911 112,215,696 9,930,131 8.8% 8.7% (127,036) $3.18 Q3-11 1,912 112,297,636 9,718,325 8.7% 8.9% 190,635 $3.11 Q2-11 1,912 112,555,180 9,978,160 8.9% 9.2% 357,943 $3.10 COLLIERS INTERNATIONAL | P. 3
- 4. RESEARCH & FORECAST REPORT | Q4 2011 | INDUSTRIAL | WEST MICHIGAN Current and planned construction has remained A LOOK AHEAD minimal but not non-existent. Meijer Inc. is investing $7.6 million into an existing site in • As manufacturing inventory continues to dwindle, look for users to consider warehouse 512 offices in Grandville to turn it into a processing, packaging, and distribution center. The plan includes adding space. 61 countries on 25-30 employees. Continental Dairy is opening a • General Motors will finish the tear-down of its site on 36th street, and re-development 6 continents new plant in Coopersville, which will add 70 to 100 employees, while Johnson Controls is plans will be put into place. United States: 125 expanding their Norton Shores facility and will • Amway will move out of their 685,000 Canada: 38 Latin America: 18 add around 40 jobs. square feet facility in Ada which sits on more Asia Pacific: 214 than 106 acres of land. However, the EMEA: 117 The West Michigan economy saw its company intends to stay committed to the area. • $1.6 billion in annual revenue unemployment rate drop to 7.1%, down more than 2.0% from a year ago. The state as a whole • Lease rates will trend upwards as the supply • 978.6million square feet under and demand equilibrium becomes a little management still trails the national average of 8.5%, however the Greater Grand Rapids area is now well below clearer. • Over 12,000 professionals that average. Manufacturing jobs make up • Look for companies to lock in spaces with roughly 15.3% of the West Michigan workforce, longer term leases than recently seen. Colliers International | West Michigan and are expected to increase according to the • Some quality buildings will transfer employment services company, ManpowerGroup. 300 Ottawa Avenue NW, Suite 400 ownership due to increased interest from The firm’s Employment Outlook Report states Grand Rapids, MI 49503 investors. +1 616 774 3500 that the region should expect strong hiring • Expect to see the start of some build-to-suit progress in the area, with manufacturing leading 44 E. 8th Street, Suite 510 and speculation construction as quality space the way. With four of the top ten employers by Holland, MI 49423 is less and less available. size in the area being manufacturing companies, +1 616 394 4500 the outlook for industrial growth is promising. 125 S. Kalamazoo Mall, Suite 203 Kalamazoo, MI 49007 +1 269 978 0245 WEST MICHIGAN OFFICE TEAM Matt Abraham Jason DeWitt John Kuiper SIOR, CCIM Steve Marcusse SIOR, CCIM RESEARCHER: Associate Associate | Holland Principal Principal MOB 616 560 4543 MOB 616 836 2856 MOB 616 901 3500 MOB 616 450 1669 Jeffery Hainer matt.abraham@colliers.com jason.dewitt@colliers.com john.kuiper@colliers.com steve.marcusse@colliers.com Research Analysis DIR +1 616 242 0611 jeffery.hainer@colliers.com Copyright © 2011 Colliers International. Thomas Postma SIOR David Rapp Duke Suwyn SIOR, CCIM Karen Vandenboss The information contained herein has been obtained from sources deemed reliable. While every reasonable effort has been made to Principal | Holland Associate President & CEO Associate | Kalamazoo ensure its accuracy, we cannot guarantee it. No responsibility is MOB 616 283 2411 MOB 616 325 9235 MOB 616 581 7777 DIR 269 385 5505 assumed for any inaccuracies. Readers are encouraged to consult their professional advisors prior to acting on any of the material tom.postma@colliers.com david.rapp@colliers.com duke.suwyn@colliers.com karen.vandenboss@colliers.com contained in this report. Cheryl Lindgren Paula Nichols Ben Sietsma Executive Assistant Executive Assistant Sales Associate DIR 616 988 5818 DIR 616 988 5801 DIR 616 2420674 Accelerating success. cheryl.lindgren@colliers.com paula.nichols@colliers.com benjamin.sietsema@colliers.com www.colliers.com/marketname