2nd Solid Symposium: Solid Pods vs Personal Knowledge Graphs
soil strngth parameter.pdf
1. September 3, 2020 17:14 Soil Mechanics - 9in x 6in b3878-ch01 page 1
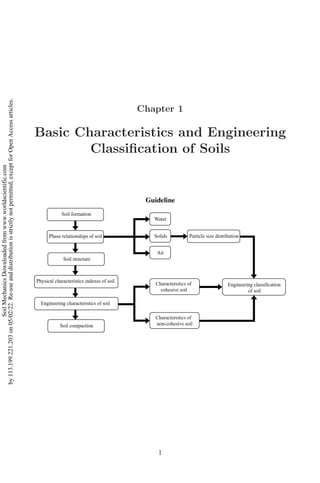
Chapter 1
Basic Characteristics and Engineering
Classification of Soils
1
Soil
Mechanics
Downloaded
from
www.worldscientific.com
by
113.199.221.203
on
05/02/22.
Re-use
and
distribution
is
strictly
not
permitted,
except
for
Open
Access
articles.
2. September 3, 2020 17:14 Soil Mechanics - 9in x 6in b3878-ch01 page 2
2 Soil Mechanics
1.1 Introduction
Soil mechanics may be defined as the study of the engineering
behaviors of soils that are related to the design of civil engineering
structures made from or in the earth. Nearly all of the civil
engineering structures, such as buildings, bridges, highways, tunnels,
earth retaining walls, embankments, basements, sub-surface waste
repositories, towers, canals, and dams, are constructed in or on the
surface of the earth. To perform satisfactorily, each structure must
have a proper foundation.
The four basic types of geotechnical structures are illustrated in
Fig. 1.1, and most of the other cases are variations or combinations of
these. Foundations (Fig. 1.1(a)) transmit loads to the ground and the
basic criterion for design is that the settlements should be relatively
small. The variables in design of a foundation are the load F, the
size of the base B, and the depth D. Foundations may support loads
that are relatively small, such as car wheels, or relatively large, such
as a power station. Slopes (Fig. 1.1(b)) may be formed naturally by
erosion or built by excavation or filling. The basic variables are the
slope angle i and the depth H, and the design requirement is that
the slope should not fail by landsliding.
Fig. 1.1. Geotechnical structures. (a) Foundation, (b) slope stability, (c) retain-
ing wall, and (d) earth–fill dam.
Soil
Mechanics
Downloaded
from
www.worldscientific.com
by
113.199.221.203
on
05/02/22.
Re-use
and
distribution
is
strictly
not
permitted,
except
for
Open
Access
articles.
3. September 3, 2020 17:14 Soil Mechanics - 9in x 6in b3878-ch01 page 3
Basic Characteristics and Engineering Classification of Soils 3
Stand slopes that are deep and steep can be supported by
a retaining wall (Fig. 1.1(c)). The basic variables are the height
of the wall H and its depth of burial D, together with the
strength and stiffness of the wall and the forces in any anchors
or props. The basic requirements for the design are complex and
involve overall stability, restriction of ground movements, and the
bending and shearing resistance of the wall. In any structure where
there are different levels of water, such as in a dam (Fig. 1.1(d))
or around a pumped well, there will be seepage of water. The
seepage causes leakage through a dam and governs the yield
of a well and it also governs the variation of pressure in the
groundwater.
The structures are stable, taking into consideration that the
safety of design section, the soils that have problems such as plough-
ing, flow of mineral ore, and grain from storage soil can be solved
by the theory of soil mechanics. Other problems in geotechnical
engineering include movement of contaminations from the place of
depositing the waste and techniques for ground improvement.
1.2 Soil Composition and Phase Relationships
1.2.1 Soil composition
Soil is a particulate material, which means that a soil mass consists
of an accumulation of individual particles that are bonded together
by mechanical or attractive means, though not as strongly as for
rock. To the civil engineer, soil is an uncemented or weakly cemented
accumulation of mineral particles formed by the weathering of rocks,
the void space between the particles containing water and/or air.
In nature, the void of every soil is partly or completely filled
with water. Soils can be of either two phases or three phases
composition, as illustrated in Fig. 1.2. A partially saturated soil has
three phases, being composed of solid soil particles, pore water, and
pore air. In a completely dry soil, there are two phases, namely
the solid soil particles and pore air. A fully saturated soil also
has two phases, being composed of solid soil particles and pore
water. Below the water table, the soil is assumed to be fully
saturated, although it is likely that, due to the presence of small
volumes of entrapped air, the degree of saturation will be marginally
below 100%.
Soil
Mechanics
Downloaded
from
www.worldscientific.com
by
113.199.221.203
on
05/02/22.
Re-use
and
distribution
is
strictly
not
permitted,
except
for
Open
Access
articles.
4. September 3, 2020 17:14 Soil Mechanics - 9in x 6in b3878-ch01 page 4
4 Soil Mechanics
Fig. 1.2. Three-phase composition.
Fig. 1.3. Seepage of slope.
The water filling the void space may be in a state of rest or in a
state of flow. Below the water table, the pore water may be static,
the hydrostatic pressure depending on the depth below the water
table, or may be seeping through the soil under hydraulic gradient, as
illustrated in Fig. 1.3. If the water is in a state of rest, the methods for
solving stability and deformation problems are essentially identical
with those for solving similar problems in the mechanics of solids
in general. On the other hand, if the water percolates through the
voids of the soil, the problems cannot be solved without previously
determining the state of stress in the water contained in the voids
Soil
Mechanics
Downloaded
from
www.worldscientific.com
by
113.199.221.203
on
05/02/22.
Re-use
and
distribution
is
strictly
not
permitted,
except
for
Open
Access
articles.
5. September 3, 2020 17:14 Soil Mechanics - 9in x 6in b3878-ch01 page 5
Basic Characteristics and Engineering Classification of Soils 5
of the soil. In this case, we are obliged to combine the mechanics of
solids with applied hydraulics.
Significant engineering properties of a soil deposit, such as
strength and compressibility, are directly related to or at least
affected by basic factors such as volume and weight of a bulk soil
consisting of solid particles or water or air. Information such as
soil density (weight per unit volume), water content, void ratio, and
degree of saturation are used in calculations to determine the stability
of earth slopes, foundation settlement, and the bearing capacity of
foundations. Therefore, we can determine the suitability of founda-
tion types and constructions. For this reason, an understanding of
the terminology and definitions related to soil composition is the key
to studying soil mechanics.
1.2.2 Phase relationships
The components of a soil can be represented by a phase diagram as
shown in Fig. 1.4. Bulk soil as it exists in nature is a more or less
random accumulation of soil particles, water, and air space, as shown
in Fig. 1.4(a). For purposes of study and analysis, it is convenient to
represent this soil mass by a phase or block diagram, which consists
of three parts: solid particles, water or other liquid, and air or other
gas, as shown in Fig. 1.4(b).
Fig. 1.4. Phase diagrams.
Soil
Mechanics
Downloaded
from
www.worldscientific.com
by
113.199.221.203
on
05/02/22.
Re-use
and
distribution
is
strictly
not
permitted,
except
for
Open
Access
articles.
6. September 3, 2020 17:14 Soil Mechanics - 9in x 6in b3878-ch01 page 6
6 Soil Mechanics
Fig. 1.5. Phase relationships.
The phase relationships as shown in Fig. 1.5 illustrate the mass
and volume of components of soil system. The relationships are
summarized in Fig. 1.5. The total mass m of the soil volume is taken
as the sum of the mass of solids ms and water mw. The mass of
air (in the voids) measured in air (the earth’s atmosphere) is zero.
The air or other gases may have a measurable weight, but it would
normally be very small compared to the total mass of soil plus water
and therefore can be neglected without causing serious error.
The total volume V of the soil bulk includes the volume occupied
by solids Vs plus water Vw (or liquid) plus air Va (or other gas). The
total space occupied by water and air may collectively be indicated
as the volume of voids.
m = ms + mw
V = Vs + Vw + Va.
(1.1)
The following relationships are defined according to Fig. 1.5.
(1) The water content (w), or moisture content, is the ratio of the
mass of water to the mass of solids in the soil. It is expressed as
a percentage, i.e.
w =
mw
ms
× 100%. (1.2)
The water content must be determined by test (drying method).
It is determined by weighing a sample of the soil and then
Soil
Mechanics
Downloaded
from
www.worldscientific.com
by
113.199.221.203
on
05/02/22.
Re-use
and
distribution
is
strictly
not
permitted,
except
for
Open
Access
articles.
7. September 3, 2020 17:14 Soil Mechanics - 9in x 6in b3878-ch01 page 7
Basic Characteristics and Engineering Classification of Soils 7
drying the sample in an oven at a temperature of 105–110◦C
and reweighing.
(2) The bulk density (ρ) of a soil is the ratio of the total mass to the
total volume, i.e.
ρ =
m
V
. (1.3)
Convenient units for density are kg/m3 or g/cm3. The density of
water ρw = 1000 kg/m3 (or 1.00 g/cm3).
For a completely dry soil (Sr = 0),
ρd =
ms
V
. (1.4)
For a fully saturated soil (Sr = 1),
ρsat =
(ms + Vvρw)
V
. (1.5)
The buoyant density (ρ) is given by
ρ
=
(ms − Vsρw)
V
. (1.6)
The unit weight (γ) of a soil is the ratio of the total weight
(a force) to the total volume, i.e.
γ =
W
V
=
mg
V
= ρg. (1.7)
Convenient units are kN/m3.
(3) The specific gravity of the soil particles (ds) is given by
ds =
ms
Vsρw
=
ρs
ρw
, (1.8)
where ρs is the particle density. If the units of ρs are g/cm3, then
ρs and ds are numerically equal.
(4) The void ratio (e) is the ratio of the volume of voids to the
volume of solids, i.e.
e =
Vv
Vs
. (1.9)
Soil
Mechanics
Downloaded
from
www.worldscientific.com
by
113.199.221.203
on
05/02/22.
Re-use
and
distribution
is
strictly
not
permitted,
except
for
Open
Access
articles.
8. September 3, 2020 17:14 Soil Mechanics - 9in x 6in b3878-ch01 page 8
8 Soil Mechanics
The porosity (n) is the ratio of the volume of voids to the total
volume of the soil, i.e.
n =
Vv
V
× 100%. (1.10)
The e and the n are inter-related as follows:
e =
n
1 − n
(1.11)
n =
e
1 + e
× 100%. (1.12)
(5) The degree of saturation (Sr) is the ratio of the volume of water
to the total volume of void space. It is also expressed as a
percentage, i.e.
Sr =
Vw
Vv
× 100%. (1.13)
The degree of saturation can range between the limits of zero for
a completely dry soil and 1 (or 100%) for a fully saturated soil.
From the definition of void ratio, if the volume of solids is 1 unit,
then the volume of voids is e units. The mass of solids is then
ds and, from the definition of water content, the mass of water
is dswρw. The volume of water is thus dsw. These volumes and
masses are represented in Fig. 1.6. The following relationships can
be obtained:
e =
ds(1 + w)ρw
ρ
− 1 (1.14)
Sr =
dsw
e
(1.15)
ρ =
ds(1 + w)ρw
1 + e
(1.16)
ρsat =
ds + e
1 + e
ρw (1.17)
ρd =
ds
1 + e
ρw. (1.18)
Table 1.1 shows the formulas of physical indexes.
Soil
Mechanics
Downloaded
from
www.worldscientific.com
by
113.199.221.203
on
05/02/22.
Re-use
and
distribution
is
strictly
not
permitted,
except
for
Open
Access
articles.
9. September 3, 2020 17:14 Soil Mechanics - 9in x 6in b3878-ch01 page 9
Basic Characteristics and Engineering Classification of Soils 9
Fig. 1.6. Relationship of volumes and masses.
Example 1.1. In its natural condition, a soil sample has a mass of
2290 g and a volume of 1.15 × 10⁻³ m3. After being completely dried
in an oven, the mass of the sample is 2035 g. The value of ds for the
soil is 2.68. Determine the water content, bulk density, unit weight,
void ratio, porosity, and degree of saturation.
Solution: According to Eqs. (1.2), (1.3), and (1.7), the water
content, bulk density, and unit weight can be calculated directly by
definition.
Water content, w =
mw
ms
=
2290 − 2035
2035
× 100% = 12.5%
Bulk density, ρ =
m
V
=
2.29
1.15 × 10−3
= 1990 kg/m3
Unit weight, γ =
mg
V
= 1990 × 9.8 = 19.5 kN/m3
.
The void ratio, porosity, and degree of saturation need to use
phase relationships, by Eqs. (1.14), (1.12), and (1.15):
Void ratio, e =
ds(1 + w)ρw
ρ
− 1 =
2.68 × 1.125 × 1000
1990
− 1 = 0.52
Soil
Mechanics
Downloaded
from
www.worldscientific.com
by
113.199.221.203
on
05/02/22.
Re-use
and
distribution
is
strictly
not
permitted,
except
for
Open
Access
articles.
10. September 3, 2020 17:14 Soil Mechanics - 9in x 6in b3878-ch01 page 10
10 Soil Mechanics
Table 1.1. Practical calculation formulas of physical indexes.
Expression or
Index and the symbol conversion formula Unit
Specific gravity, ds ds = ms
mw
= Vsρs
Vsρw
= ρs
ρw
Dimensionless
quantity
Water content, w w = mw
ms
× 100% %
Density, ρ ρ = ds(1+w)ρw
1+e
= ds+Sre
1+e
ρw g/cm3
Unit weight, γ γ = ds(1+w)γw
1+e
= ds+Sre
1+e
γw kN/m3
e = ds(1+w)ρw
ρ
− 1, e = ds(1+w)γw
γ
− 1
Void ratio, e e = dsρw
ρd
− 1, e = dsγw
γd
− 1 Dimensionless
e = dsw ( Sr = 100% ) quantity
Porosity, n n = e
1+e
× 100% %
Degree of saturation, Sr Sr = dsw
e
%
Dry density, ρd ρd = ds
1+e
ρw, ρd = ρ
1+w
g/cm3
Dry unit weight, γd γd = ds
1+e
γw, γd = γ
1+w
kN/m3
Saturated density, ρsat ρsat = ds+e
1+e
ρw g/cm3
Saturated unit weight, γsat γsat = ds+e
1+e
γw kN/m3
Buoyant density, ρ
ρ
= ds−1
1+e
ρw, ρ
= ρsat − ρw g/cm3
ρ
= (ds − 1)(1 − n)ρw
Buoyant unit weight, γ
γ
= ds−1
1+e
γw, γ
= γsat − γw kN/m3
γ
= (ds − 1)(1 − n)γw
Porosity, n =
e
1 + e
=
0.52
1.52
× 100% = 34%
Degrees of saturation, Sr =
dsw
e
=
2.68 × 12.5%
0.52
= 64.5%.
Example 1.2. A dry soil is measured with bulk density ρ = 1.69×
103 kg/m3, specific gravity ds = 2.70. After a rain, the total volume of
the soil doesn’t change and the degree of saturation Sr becomes 40%.
Soil
Mechanics
Downloaded
from
www.worldscientific.com
by
113.199.221.203
on
05/02/22.
Re-use
and
distribution
is
strictly
not
permitted,
except
for
Open
Access
articles.
11. September 3, 2020 17:14 Soil Mechanics - 9in x 6in b3878-ch01 page 11
Basic Characteristics and Engineering Classification of Soils 11
Calculate bulk density ρ and water content w of the soil after
the rain.
Solution: For a dry soil, the dry density ρd is numerically equal
to the bulk density ρ, that is ρd = 1.69 × 10³ kg/m3, then from
Eq. (1.18),
Void ratio, e =
dsρw
ρd
− 1 =
2.70 × 1000
1690
− 1 = 0.6.
Therefore,
Water content after the rain, w =
Sre
ds
=
40% × 0.6
2.7
= 8.89%
Bulk density after the rain,
ρ =
ds(1 + w)ρw
1 + e
=
2.7 × (1 + 8.89%) × 1000
1 + 0.6
= 1.84 × 10³
kg/m3
.
1.3 Soil Fabric
In the micro scale, soil fabric is formed by the certain structure of
soil particles. When it comes to soil fabric, it refers to particle size,
shape, arrangement and especially the mutual connecting condition,
which is synthetical of soil grain characteristics. Figure 1.7 shows the
three kinds of basic types of soil fabrics.
Crushed stone, gravel, sand, and some other coarse grain soil
all belong to single grain fabric, which is formed in sedimentation.
According to its arrangement situation, it can be divided into two
types — the tight and the loose, as shown in Fig. 1.7(a). The greater
the range of particle sizes present, the tighter the structure can be.
The grain of sand or gravel is big and relative surface area and
surface energy are quite small compared to its gravity. There is
only strong bound water on particle surface and almost no inter-
particle force among particles. Thus, this kind of soil is also called
cohesionless soil.
Silt belongs to honeycomb fabric, as shown in Fig. 1.7(b). In the
sedimentation process, where the fine grained soils contact the soils
which have already sunk, it will stay at the points of contact and
Soil
Mechanics
Downloaded
from
www.worldscientific.com
by
113.199.221.203
on
05/02/22.
Re-use
and
distribution
is
strictly
not
permitted,
except
for
Open
Access
articles.
12. September 3, 2020 17:14 Soil Mechanics - 9in x 6in b3878-ch01 page 12
12 Soil Mechanics
Fig. 1.7. Soil fabric. (a) Single grain fabric, (b) honeycomb fabric, and
(c) flocculent fabric.
not sink, for which the interparticle force is bigger than the gravity.
Thus, the honeycomb fabric which has big voids comes into being, as
can be seen in Fig. 1.7(b). This kind of soil is quite unsteady and will
produce great deformation under water immersion or external force.
Clay particles belong to flocculent fabric, as shown in Fig. 1.7(c).
Clay (d 0.005 mm), colloidal particles, and clay mineral particles
(d 0.002 mm) are very fine, presenting thin-bedded state, which
makes this kind of soil have a large relative surface area and be always
suspended in water. If the interparticle reaction appears to be an
attractive force, they easily combine with each other and gradually
form a little link aggregation of soil grains and make the mass bigger
and then sink. When a link touches the other, they attract each
other, and gradually a big link can be formed. The soil grain of this
kind of fabric arranges randomly and has big pore space, as a result,
it will show low strength and high compressibility, meanwhile, it is
sensitive to disturbance. But the linkage strength among soil grains is
becoming bigger and bigger for compaction and cementation, which
is the main source of cohesive force in clay.
1.4 Particle Size Analysis
The particle size analysis of a soil sample involves determining the
percentage by mass of particles within the different size ranges.
Particle sizes in soils can vary from less than 0.001 mm to over
100 mm. By the Chinese, British, and Japanese Standards, the size
ranges detailed in Fig. 1.8 are specified. The same terms are also used
to describe particular types of soil. The particle size distribution of a
coarse-grained soil can be determined by the method of sieving. The
Soil
Mechanics
Downloaded
from
www.worldscientific.com
by
113.199.221.203
on
05/02/22.
Re-use
and
distribution
is
strictly
not
permitted,
except
for
Open
Access
articles.
13. September 3, 2020 17:14 Soil Mechanics - 9in x 6in b3878-ch01 page 13
Basic Characteristics and Engineering Classification of Soils 13
Fig. 1.8. Particle size ranges.
particle size distribution of a fine-grained soil or the fine-grained
fraction of a coarse-grained soil can be determined by the method of
sedimentation.
1.4.1 Method of sieving
The soil sample is passed through a series of standard test sieves
having successively smaller mesh sizes. The mass of soil retained
in each sieve is determined and the cumulative percentage by mass
passing each sieve is calculated. The particle size distribution of a
soil is presented as a curve on a semilogarithmic plot. The ordinate
is the percentage by mass of particles smaller than the size given
by the abscissa. Examples of particle size distribution curves appear
in Fig. 1.9. The particle size corresponding to any specified value
on the “percentage smaller” scale can be read from the particle size
distribution curve.
The size in which 10% of the particles are smaller than that size is
denoted by D10. Other sizes such as D30 and D60 can be defined in a
similar way. The size D10 is defined as the effective size. The general
Soil
Mechanics
Downloaded
from
www.worldscientific.com
by
113.199.221.203
on
05/02/22.
Re-use
and
distribution
is
strictly
not
permitted,
except
for
Open
Access
articles.
14. September 3, 2020 17:14 Soil Mechanics - 9in x 6in b3878-ch01 page 14
14 Soil Mechanics
Fig. 1.9. Particle size distribution curves.
slope and shape of the distribution curve can be described by means
of the coefficient of uniformity (Cu) and the coefficient of curvature
(Cc), defined as follows:
Cu =
D60
D10
(1.19)
Cc =
D2
30
D60D10
, (1.20)
where Cu indicates the slope of the particle size distribution curve,
the higher the Cu value, the larger the range of particle sizes.
Cc indicates continuous characteristics of the slope, a well-graded
soil has 1 Cc 3 and Cu 5.
1.4.2 Method of sedimentation
This method is based on Stokes’ law which governs the velocity
at which spherical particles settle in a suspension: the larger the
particle, the greater is the settling velocity and vice versa.
1.5 Density Properties for Granular Soils
Cohesionless soils include stone, crushed stone, gravel and sand soil,
which all present single grain fabric with no cohesive force and
no cementation effect. Compactness is the main factor affecting
Soil
Mechanics
Downloaded
from
www.worldscientific.com
by
113.199.221.203
on
05/02/22.
Re-use
and
distribution
is
strictly
not
permitted,
except
for
Open
Access
articles.
15. September 3, 2020 17:14 Soil Mechanics - 9in x 6in b3878-ch01 page 15
Basic Characteristics and Engineering Classification of Soils 15
the engineering properties in terms of this kind of soil. Hence, if
the soil is more compact, the bearing capacity will be higher, the
compressibility will be smaller, and then the stability will be much
better accordingly. Since the soil particles are coarse and relative
surface area is quite small, water has little influence on engineering
properties in terms of this kind of soil. There is only strong bound
water on the surface, and no weakly bound water.
How to express the compactness of granular soils is the key
point. Besides the coefficient of uniformity Cu, there are usually some
other ways.
1.5.1 Void ratio
Figure 1.10 shows two of the many possible ways that a system of
equal-sized spheres can be packed. The dense packings represent the
densest possible state for such a system. Looser systems than the
simple cubic packing can be obtained by carefully constructing arches
Fig. 1.10. Arrangement of uniform spheres. (a) Plan and elevation view: simple
cubic packing. (b) Plan view: dense packing. Solid circles, first layer; dashed
circles, second layer; ◦, location of sphere centers in third layer; face-centered
cubic array; ×, location of sphere centers in third layer; close-packed hexagonal
array.
Source: From Deresiewicz (1958).
Soil
Mechanics
Downloaded
from
www.worldscientific.com
by
113.199.221.203
on
05/02/22.
Re-use
and
distribution
is
strictly
not
permitted,
except
for
Open
Access
articles.
16. September 3, 2020 17:14 Soil Mechanics - 9in x 6in b3878-ch01 page 16
16 Soil Mechanics
within the packing, but the simple cubic packing is the loosest of the
stable arrangements. The void ratio and porosity of these simple
packings can be computed from the geometry of the packings, and
the results are given in Table 1.2.
The smaller the range of particles sizes present (i.e. the more
nearly uniform the soil), and the more angular the particles present,
the smaller the minimum density (i.e. the greater the opportunity
for building a loose arrangement of particles). The greater the range
of particle sizes present, the greater the maximum density (i.e. the
voids among the larger particles can be filled with smaller particles).
According to the engineering experience, Table 1.3 characterizes
the density of granular soils in the basis of void ratio.
Table 1.2. Maximum and minimum densities for granular soils.
Dry unit
Void ratio Porosity weight (pcf)
Description emax emin nmax nmin γd max γd min
Uniform spheres 0.92 0.35 47.6 26.0 — —
Standard Ottawa sand 0.80 0.50 44 33 92 110
Clean uniform sand 1.0 0.40 50 29 83 118
Uniform inorganic silt 1.1 0.40 52 29 80 118
Silty sand 0.90 0.30 47 23 87 127
Fine to coarse sand 0.95 0.20 49 17 85 138
Micaceous sand 1.2 0.40 55 29 76 120
Silty sand and gravel 0.85 0.14 46 12 89 146
Source: B. K. Hough (1957), Basic Soils Engineering.
Table 1.3. Division of compactness of sandy soils in terms of void ratio.
Compactness
Soil type Dense Medium dense Less dense Loose
Gravel, coarse or e 0.6 0.60 ≤ e ≤ 0.75 0.75 e ≤ 0.85 e 0.85
medium sand
Fine sand, silt e 0.7 0.70 ≤ e ≤ 0.85 0.85 e ≤ 0.95 e 0.95
Soil
Mechanics
Downloaded
from
www.worldscientific.com
by
113.199.221.203
on
05/02/22.
Re-use
and
distribution
is
strictly
not
permitted,
except
for
Open
Access
articles.
17. September 3, 2020 17:14 Soil Mechanics - 9in x 6in b3878-ch01 page 17
Basic Characteristics and Engineering Classification of Soils 17
Values of water content for natural granular soils vary from
less than 0.1% for air-dry sands to more than 40% for saturated,
loose sand.
1.5.2 Relative density
A useful way to characterize the density of a natural granular soil is
with relative density Dr, defined as
Dr =
emax − e
emax − emin
× 100% =
γd max
γd
×
γd − γd min
γd max − γd min
× 100%,
(1.21)
where emin is the void ratio of soil in densest condition, emax is the
void ratio of soil in loosest condition, e is the in-place void ratio,
γd max is the dry unit weight of soil in densest condition, γd min is the
dry unit weight of soil in loosest condition, γd is the in-place dry unit
weight.
According to the engineering experience, divide the compactness
of sandy soils in terms of relative density Dr:
0 Dr ≤ 0.33 loose
0.33 Dr ≤ 0.67 medium dense
0.67 Dr ≤ 1.0 dense.
A variety of tests have been proposed to measure the maximum
and minimum void ratios (Kolbuszewski, 1948). The test to deter-
mine the maximum density usually involves some form of vibration.
The test to determine minimum density usually involves pouring
oven-dried soil into a container. Unfortunately, the details of these
tests have not been entirely standardized, and values of the maximum
density and minimum density for a given granular soil depend on the
procedure used to determine them. By using special measures, one
can obtain densities greater than the so-called maximum density.
Densities considerably less than the so-called minimum density can
be obtained, especially with very fine sands and silts, by slowly
sedimenting the soil into water or by fluffing the soil with just a
little moisture present.
Soil
Mechanics
Downloaded
from
www.worldscientific.com
by
113.199.221.203
on
05/02/22.
Re-use
and
distribution
is
strictly
not
permitted,
except
for
Open
Access
articles.
18. September 3, 2020 17:14 Soil Mechanics - 9in x 6in b3878-ch01 page 18
18 Soil Mechanics
Table 1.4. Standard penetration test.
Relative density Dense Medium dense Less dense Loose
Penetration resistance, N 30 N 15 N ≤ 30 10 N ≤ 15 ≤10
1.5.3 Standard penetration test
Using void ratio e and relative density Dr to express the compactness
of soils has many defects. Besides a lot of experimental influencing
factors, it is very hard to get the intact specimens of the granular
soils. Thus, many field experiments have been proposed (i.e. standard
penetration test and the cone penetration test) to get the compact-
ness of soils.
According to Code for Design of Building Foundation (GB 50007-
2011), China, Table 1.4 presents a correlation of standard penetration
resistance with relative density for sand.
The standard penetration test is a very valuable method of soil
investigation. It should, however, be used only as a guide, because
there are many reasons why the results are only approximate.
1.6 Plasticity Properties of Soils
1.6.1 Plastic behavior and consistency limits
Plasticity is a very important characteristic of fine-grained soil.
In general, depending on its water content, a soil may exist in
one of the liquid, plastic, semi-solid, and solid states. If the water
content of a soil initially in the liquid state is gradually reduced,
the state will change from liquid through plastic and semi-solid,
accompanied by gradually reducing volume, until the solid state
is reached. The water content at the division between the solid
and the semi-solid state is the shrinkage limit ws. The division
between the semi-solid and plastic state is the plastic limit wp. The
water content indicating the division between the plastic and liquid
state has been designated the liquid limit wL. The liquid limit,
plastic limit, and shrinkage limit are also called consistency limits
(see Fig. 1.11).
Soil
Mechanics
Downloaded
from
www.worldscientific.com
by
113.199.221.203
on
05/02/22.
Re-use
and
distribution
is
strictly
not
permitted,
except
for
Open
Access
articles.
19. September 3, 2020 17:14 Soil Mechanics - 9in x 6in b3878-ch01 page 19
Basic Characteristics and Engineering Classification of Soils 19
Fig. 1.11. Consistency limits.
The liquid and plastic limits of the range of water content are
defined as the plasticity index Ip, i.e.
Ip = wL − wp. (1.22)
For proper evaluation of a soil’s plasticity properties, it has been
found desirable to use both the liquid limit and plasticity index
values. The natural water content (w) of a soil relative to the liquid
and plastic limits can be represented by means of the liquidity index
(IL), i.e.
IL =
w − wp
wL − wp
. (1.23)
A very low value for the IL, or a value near zero, indicates that the
water content is near the plastic limit, where experience has shown
that the sensitivity will be low and the cohesive strength relatively
high. As the natural water content approaches the liquid limit, the
sensitivity increases.
The liquid and plastic limits are determined by means of
arbitrary test procedures.
1.6.2 Liquid and plastic limit tests
1.6.2.1 Determination of the plastic limit
There are two methods to determine the plastic limit: Rubbing
method and liquid-plastic limit combined device method.
The rubbing method is relatively simple to carry out; the
apparatus itself is simple, too. First, we need to make several
specimens. Then, take a specimen and roll it into a ball and then we
put it on a ground glass sheet to roll it evenly into a thread of soil with
our palms until the diameter of the thread reaches 3 mm (Fig. 1.12).
This procedure of rolling continues until the thread starts to crumble
or there is no shadow mark on the glass just as the diameter of
Soil
Mechanics
Downloaded
from
www.worldscientific.com
by
113.199.221.203
on
05/02/22.
Re-use
and
distribution
is
strictly
not
permitted,
except
for
Open
Access
articles.
20. September 3, 2020 17:14 Soil Mechanics - 9in x 6in b3878-ch01 page 20
20 Soil Mechanics
Fig. 1.12. Rubbing method.
3 mm is reached; at this point, the water content of the specimen is
determined. The same process is carried out in other specimens and
the average water content is stated as the plastic limit of the soil.
In spite of the seeming arbitrary nature of this test procedure, an
experienced technician can obtain a reasonable plastic limit result
for the engineering construction.
Liquid-plastic combine tester is shown in Fig. 1.13. First, we make
three kinds of specimens with different water content. Mix the three
kinds of well-prepared specimens fully and put them in the soil cup.
Then with the electromagnetic fall-cone test, the cone is released to
penetrate the soil paste for exactly 5 s and mark down its depth,
introduced in Standard for Soil Test Method (GB/T 50123-1999),
China. The penetration procedure is repeated three times on the
specimens. A log–log plot is drawn of water content/penetration
depth and three points should be in a line in this plot. So the
water content corresponding to a penetration of 2 mm is the value of
plasticity limit.
1.6.2.2 Determination of the liquid limit
There are two methods for the liquid limit test: liquid-plastic limit
combined device method and Casagrande method, namely dish-type
liquid limit device method.
Although the liquid-plastic limit combined device method is
preferred, the Casagrande method of determining liquid limit is still
widely used. The apparatus used is shown in Fig. 1.14 and consists
basically of a metal dish which may be raised by rotating a cam and
then allowed to fall through at a height of 10 mm on to a hard rubber
block.
Soil
Mechanics
Downloaded
from
www.worldscientific.com
by
113.199.221.203
on
05/02/22.
Re-use
and
distribution
is
strictly
not
permitted,
except
for
Open
Access
articles.
21. September 3, 2020 17:14 Soil Mechanics - 9in x 6in b3878-ch01 page 21
Basic Characteristics and Engineering Classification of Soils 21
Fig. 1.13. Liquid-plastic limit combined device. (1) Horizontal adjustment
screw; (2) pilot switch; (3) indicate lamp; (4) nil-line adjustment screw;
(5) retroreflector adjustment screw; (6) screen; (7) chassis; (8) objective lens
adjustment screw; (9) electromagnetic apparatus; (10) luminous source adjust-
ment screw; (11) luminous source; (12) cone apparatus; (13) elevator platform,
and (14) spirit bubble.
The soil is dried and mixed in the same way as in the previously
described method. Some of the soil paste is placed in the dish and
leveled-off parallelly with the rubber base until the depth of the
specimen is 10 mm.
The standard grooving tool is then drawn through the soil paste
to form the groove. By turning the handle (at 2 rvs/s), the cup is
raised and dropped on to the rubber base until the lower part of the
groove has closed up over a length of 13 mm. The number of blows
(number of revolutions) required for this is recorded.
The dish is then refilled with the same paste mixture and the
grove-closing procedure is repeated several times and an average
number of blows are obtained for that mixture. After this, a small
portion of the paste is taken and its water content is found. The whole
Soil
Mechanics
Downloaded
from
www.worldscientific.com
by
113.199.221.203
on
05/02/22.
Re-use
and
distribution
is
strictly
not
permitted,
except
for
Open
Access
articles.
22. September 3, 2020 17:14 Soil Mechanics - 9in x 6in b3878-ch01 page 22
22 Soil Mechanics
Fig. 1.14. Dish-type liquid limit device. (a) Vertical view and (b) front view.
Notes: A, Adjustment plate; B, screw; C, based and D, handle.
procedure is then repeated with paste mixture having different water
contents for five or six times in all.
1.6.3 Two important indexes and the engineering
application
1.6.3.1 Plasticity index, Ip
It can be seen from Fig. 1.11 that if the value of plasticity limit wL
and liquid limit wP has big difference, the range of plasticity of the
soil will be wider, the weakly bound water on the surfaces of soil
particles will be thicker, the specific surface area of the soil particles
will be bigger and the surface adsorption capability of soil particles
will be greater. Thus, plasticity index, to a large extent, indicates the
amount of clay particles, colloidal particles, and clay mineral contents
of the soil.
According to Code for Design of Building Foundation (GB
50007-2011) and Code for Rock and Soil Classification of Railway
Engineering (TB 10077-2001), China, divide the cohesive soils on
the basis of the range of plasticity index Ip.
10 Ip ≤ 17 Silty clay
17 Ip Clay.
Soil
Mechanics
Downloaded
from
www.worldscientific.com
by
113.199.221.203
on
05/02/22.
Re-use
and
distribution
is
strictly
not
permitted,
except
for
Open
Access
articles.
23. September 3, 2020 17:14 Soil Mechanics - 9in x 6in b3878-ch01 page 23
Basic Characteristics and Engineering Classification of Soils 23
Table 1.5. Division of hardness of cohesive soil into five state on the basis of IL.
Degree of
hardness Solid Stiff-plastic Malleable Soft-plastic Flowing
Liquidity IL ≤ 0 0 IL ≤ 0.25 0.25 IL ≤ 0.75 0.75 IL ≤ 1.0 1.0 IL
index
Table 1.6. Division of hardness of cohesive soil into four states on the
basis of IL.
Degree of hardness Solid Stiff-plastic Soft-plastic Flowing
Liquidity index IL ≤ 0 0 IL ≤ 0.5 0.5 IL ≤ 1.0 1.0 IL
1.6.3.2 Liquidity index, IL
From Eq. (1.23) and Fig. 1.11, it can be seen that if the natural water
content is less than the plastic limit (w ≤ wp), liquidity index will
be negative (IL ≤ 0) and the soil will be in solid state; if the natural
water content is greater than the liquid limit (w ≥ wL), liquidity
index will be equal or greater than 1.0 (IL ≥ 1.0) and the soil will
be in flow condition. Thus, liquidity index indicates the degree of
hardness of cohesive soil.
According to Code for Investigation of Geotechnical Engineering
(GB 50021-2001) and Code for Design of Building Foundation (GB
50007-2011), China, divide the cohesive soils into five states on the
basis of liquidity index, IL, shown in Table 1.5.
According to Code for Rock and Soil Classification of Railway
Engineering (TB 10077-2001), China, divide the cohesive soils into
four states on the basis of liquidity index, IL, shown in Table 1.6.
As can be seen from Tables 1.5 and 1.6, the greater the value of
liquidity index, IL, the closer the liquid state of the soil mass.
1.7 Soil Compaction
Compaction is the process of increasing the density of a soil by
packing the particles closer together with the reduction in the volume
of air: there is no significant change in the volume of water of the
Soil
Mechanics
Downloaded
from
www.worldscientific.com
by
113.199.221.203
on
05/02/22.
Re-use
and
distribution
is
strictly
not
permitted,
except
for
Open
Access
articles.
24. September 3, 2020 17:14 Soil Mechanics - 9in x 6in b3878-ch01 page 24
24 Soil Mechanics
soil. In the construction of embankments, loose soil is placed in
layers ranging from 75 mm to 450 mm in thickness, each layer being
compacted to a specified standard by means of rollers, vibrators, or
rammers. In general, the higher the degree of compaction, the higher
will the strength be and the lower the compressibility of the soil.
The degree of compaction of a soil is measured in terms of dry
density, i.e. the mass of the solid only per unit volume of soil. If the
bulk density of the soil is ρ and the water content is w, then it is
apparent that the dry density is given by
ρd =
ρ
1 + w
. (1.24)
The compaction characteristics of a soil can be assessed by
means of the standard compaction test. The soil is compacted in
a cylindrical mould using a standard compactive effort. In the test,
the volume of the mould is 947 mm3 and the soil (with all particles
larger than 5 mm removed) is compacted by a rammer consisting of
a 2.5 kg mass falling freely through 305 mm: the soil is compacted in
three equal layers, each layer receiving 25 blows with the rammer.
In the modified A.A.S.H.O test, the mould is the same as used in the
above test, but the rammer consists of a 4.5 kg mass falling though
457 mm: the soil (with all particles larger than 40 mm removed)
is compacted in five layers, each layer receiving 56 blows with the
rammer.
The effectiveness of the compaction process is dependent on
several factors:
(1) The water content of soil: The maximum dry density can’t be
obtained if there is just a little or a lot of water in the soil. If
the water content is quite low, there is basically strong bound
water in the soil and the bound water film is too thin, adding the
influence of interparticle friction and attraction, which make the
soil particles not quite easy to move, thus not easy to compact.
If the water content is quite large, there is relatively a lot of free
water in the soil, which is considered incompressible under the
engineering loads. Since the free water take up a certain space,
the soil with large water content is not easy to compact, either.
When the water content of soil is just the optimal water content,
there is some weakly bound water and no free water in the soil.
Soil
Mechanics
Downloaded
from
www.worldscientific.com
by
113.199.221.203
on
05/02/22.
Re-use
and
distribution
is
strictly
not
permitted,
except
for
Open
Access
articles.
25. September 3, 2020 17:14 Soil Mechanics - 9in x 6in b3878-ch01 page 25
Basic Characteristics and Engineering Classification of Soils 25
Weakly bound water film adheres to the soil particles and can
move together with the soil particles, during which weakly bound
water film has the lubrication effect, making soil particles easy to
move, filling the voids, and becoming compact. Thus, maximum
dry density can be obtained.
(2) The energy supplied by the compaction equipment (referred to
as the compactive effort).
(3) The nature and type of soil (i.e. sand or clay; uniform or well
graded, plastic or non-plastic).
(4) The large particles in the soil.
After compaction using one of the two standard methods, the
bulk density and water content of the soil are determined and the
dry density is calculated. For a given soil, the process is repeated
at least five times, the water content of the sample being increased
each time. Dry density is plotted against water content and a curve
of the form shown in Fig. 1.15 is obtained. This curve shows that
for a particular method of compaction (i.e. a particular compactive
effort), there is a particular value of water content, known as the
optimum water content (wop), at which a maximum value of dry
density is obtained. At low values of water content, most soils
tend to be stiff and are difficult to compact. As the water content
Fig. 1.15. Soil compaction curve.
Soil
Mechanics
Downloaded
from
www.worldscientific.com
by
113.199.221.203
on
05/02/22.
Re-use
and
distribution
is
strictly
not
permitted,
except
for
Open
Access
articles.
26. September 3, 2020 17:14 Soil Mechanics - 9in x 6in b3878-ch01 page 26
26 Soil Mechanics
increases, the soil becomes more workable, facilitating compaction
and resulting in higher dry densities, which is very beneficial for
engineering construction. At high water contents, however, the dry
density decreases with increasing water content, and an increasing
proportion of the soil volume is occupied by water. So, dry density
is quite an important quality inspection index for compaction.
1.8 Engineering Classification of Soils
The direct approach to the solution of a soil engineering problem con-
sists of first measuring the soil property needed and then employing
this measured value in some rational expression to determine the
answer to the problem.
Measuring fundamental soil properties like permeability, com-
pressibility, and strength can be difficult, time consuming, and expen-
sive. In many soil engineering problems, such as pavement design,
there are no rational expressions available for the analysis for the
solution. For these reasons, sorting soils into groups showing similar
behavior may be very helpful. Such sorting is soil classification.
In China, several kinds of classification standards apply: Standard
for Engineering Classification of Soil (GB/T 50145-2007); Code for
Design of Building Foundation (GB 50007-2011); Test Methods of
Soils for Highway Engineering (JTG E40-2007); Specification of Soil
Test (SL 237-1999).
1.8.1 Crushed stones, gravels
It refers to the soils in which the particles (size 2 mm) take up more
than 50% of the whole mass weight. The particle size and gradation
of this kind of soil have great impact on engineering construction.
Thus, according to particle size and gradation, classification of this
kind of soil is shown in Table 1.7.
1.8.2 Sand
It refers to the soils of which the particles from size 2 mm take up
less than 50% of the whole mass weight to size 0.075 mm which
take up more than 50% of the whole mass weight.
Soil
Mechanics
Downloaded
from
www.worldscientific.com
by
113.199.221.203
on
05/02/22.
Re-use
and
distribution
is
strictly
not
permitted,
except
for
Open
Access
articles.
27. September 3, 2020 17:14 Soil Mechanics - 9in x 6in b3878-ch01 page 27
Basic Characteristics and Engineering Classification of Soils 27
Table 1.7. Classification of crushed stones and gravels.
Soil type Soil particle shape Gradation
Boulder Round forms
dominant
Particles (size 200 mm) take up
more than 50% of the whole mass
weight.
Block stone Angular forms
dominant
Cobble Round forms
dominant
Particles (size 20 mm) take up more
than 50% of the whole mass weight.
Crushed stone Angular forms
dominant
Round gravel Round forms
dominant
Particles (size 2 mm) take up more
than 50% of the whole mass weight.
Angular gravel Angular forms
dominant
Table 1.8. Classification of sand in the basis of gradation.
Soil type Gradation
Gravelly sand Particles (size 2 mm) take up 25–50% of the whole mass
weight.
Coarse sand Particles (size 0.5 mm) take up 50% of the whole mass
weight.
Medium sand Particles (size 0.25 mm) take up 50% of the whole mass
weight.
Fine sand Particles (size 0.075 mm) take up 85% of the whole mass
weight.
Silty sand Particles (size 0.075 mm) take up 50% of the whole mass
weight.
For this kind of soil, the classification code is similar to the
crushed stones and gravels, as shown in Table 1.8.
According to the void ratio, relative density, and standard
penetration test, this kind of soil can also be classified, as shown
in Section 1.5.
Soil
Mechanics
Downloaded
from
www.worldscientific.com
by
113.199.221.203
on
05/02/22.
Re-use
and
distribution
is
strictly
not
permitted,
except
for
Open
Access
articles.
28. September 3, 2020 17:14 Soil Mechanics - 9in x 6in b3878-ch01 page 28
28 Soil Mechanics
1.8.3 Silty soil
It refers to the soils in which particles (size 0.075 mm) take up less
than 50% of the whole mass weight and the plasticity index Ip ≤ 10.
1.8.4 Clay
In the basis of plasticity index Ip, clay can be divided as shown in
Section 1.6.3.
According to the degree of hardness, clay can be divided as shown
in Tables 1.5 and 1.6.
Exercises
1.1 Explain the concept of plasticity index and liquidity index and
its application in engineering.
1.2 What is particle size distribution curve and how to use it in
engineering?
1.3 How to appraise the compactness of granular soils?
1.4 What are maximum dry density and optimum water content of
soil?
1.5 A saturated clay specimen has the water content of 36.0%, and
particle specific gravity of 2.70. Determine the void ratio and dry
density.
1.6 The volume of a soil specimen is 60 cm3, and its mass is 108 g.
After being dried, the mass of the sample is 96.43 g. The value
of ds is 2.7. Calculate wet density, dry density, water content,
porosity, and the degree of saturation.
1.7 A soil specimen has a water content w1 of 12% and unit weight
γ1 of 19.0 kN/m3. Keep void ratio constant and increase water
content to w2 = 22%. How much water will be infused into 1 m3
soil?
1.8 There is a sample which is got from a certain natural sand
column. The water content measured by experiment is 11%, bulk
density ρ = 1.70 g/cm3, the minimum dry density is 1.41 g/cm3,
the maximum dry density is 1.75 g/cm3. Determine the sandy
soil’s dense degree.
1.9 Calculate the dry unit weight, the saturated unit weight, and
the buoyant unit weight of a soil having a void ratio of 0.70 and
a value of ds of 2.72. Calculate also the unit weight and water
content at a degree of saturation of 75%.
Soil
Mechanics
Downloaded
from
www.worldscientific.com
by
113.199.221.203
on
05/02/22.
Re-use
and
distribution
is
strictly
not
permitted,
except
for
Open
Access
articles.
29. September 3, 2020 17:14 Soil Mechanics - 9in x 6in b3878-ch01 page 29
Basic Characteristics and Engineering Classification of Soils 29
Bibliography
J. Atkinson (1993). An Introduction to the Mechanics of Soils and Foundations.
McGraw-Hill, England.
R. F. Craig (1998). Soil Mechanics. E and FN Spon, London and New York.
H. Deresciewice (1958). Mechanics of Granular Matter. Advances in Applied
Mechanics, Vol. 5. Academic Press, New York.
B. K. Hough (1957). Basic Soils Engineering. The Ronald Press Company, New
York.
J. J. Kolbuszewski (1948). An Experimental Study of the Maximum and
Minimum Porosities of Sands, Proc. 2nd Inter. Conf. Soil Mech. Found. Eng.
(Rotterdam), Vol. I, p. 158.
H. Liao (2018). Soil Mechanics (Third Edition). Higher Education Press, Beijing.
Ministry of Housing and Urban-Rural Construction of the People’s Republic
of China, GB 50007-2011 (2012). Code for Design of Building Foundation.
China Building Industry Press, Beijing.
Ministry of Water Resources of the People’s Republic of China, GB/T 50123-1999
(2000). Standard for Soil Test Method. China Planning Press, Beijing.
Ministry of Construction of the People’s Republic of China, GB 50021-2001
(2009). Code for Investigation of Geotechnical Engineering (The 2009
Revised Edition). China Building Industry Press, Beijing.
Ministry of Railways of the People’s Republic of China, TB 10077-2001 (2001).
Code for Rock and Soil Classification of Railway Engineering. China Railway
Press, Beijing.
Ministry of Water Resources of the People’s Republic of China, GB/T 50145-
2007 (2008). Standard for Engineering Classification of Soil. China Planning
Press, Beijing.
Ministry of Communications of the People’s Republic of China, JTG E40-2007
(2007). Test Methods of Soils for Highway Engineering. China Communica-
tions Press, Beijing.
Ministry of Water Resources of the People’s Republic of China, SL 237-1999
(2003). Specification of Soil Test. China Standards Press, Beijing.
Soil Mechanics Work Team at Hohai University (2004). Soil Mechanics. China
Communication Press, Beijing.
K. von Terzaghi (1943). Theoretical Soil Mechanics. John Wiley and Sons,
New York.
T. William Lambe and Robert V. Whitman (1969). Soil Mechanics. John Wiley
and Sons, New York.
S. Zhao and H. Liao (2009). Civil Engineering Geology. Science Press, Beijing.
Soil
Mechanics
Downloaded
from
www.worldscientific.com
by
113.199.221.203
on
05/02/22.
Re-use
and
distribution
is
strictly
not
permitted,
except
for
Open
Access
articles.