Plymouth Michigan Real Estate Statistics | March 2010
•
1 like•284 views

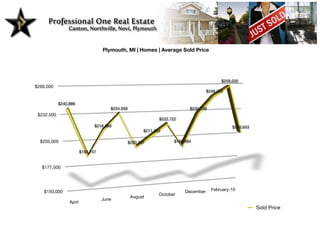
The documents show housing data for Plymouth, MI from April 2019 to February 2020. The average sold home price peaked at $259,035 in October 2019 and steadily declined to $210,653 by February 2020. Homes typically sold for over 90% of their listing price, highest being 94.27% in June 2019. On average, homes spent around 100 days on the market with the lowest being 87 days in December 2019. The average sales price per square foot was highest at $113 in October 2019 and lowest at $99 in April 2019.

Recommended
Recommended
More Related Content
What's hot
What's hot (18)
Similar to Plymouth Michigan Real Estate Statistics | March 2010
Similar to Plymouth Michigan Real Estate Statistics | March 2010 (14)
More from Berkshire Hathaway HomeServices, Snyder & Company, Realtors
More from Berkshire Hathaway HomeServices, Snyder & Company, Realtors (12)
Plymouth Michigan Real Estate Statistics | March 2010
- 1. Plymouth, MI | Homes | Average Sold Price $259,035 $260,000 $249,220 $240,886 $234,939 $232,158 $232,500 $222,722 $218,689 $210,653 $211,352 $205,000 $200,197 $198,684 $193,747 $177,500 $150,000 December February-10 October August June April Sold Price
- 2. Plymouth MI | Homes | Sales Price as % of List Price 95.00% 94.27% 93.42% 93.59% 93.07% 92.62% 92.61% 92.28% 90.00% 91.55% 91.32% 91.11% 90.50% 85.00% 84.64% 80.00% 75.00% February-10 October December June August April SP/LP
- 3. Plymouth MI | Homes | Average Days on Market 200 198 183 156 150 122 117 133 113 109 91 90 98 87 100 50 February-10 December 0 October August June April Days on Market
- 4. Plymouth MI | Homes | Avg Sales Price per Square Foot $120 $113 $108 $107 $106 $106 $105 $106 $104 $102 $102 $99 $100 $99 $93 $79 $65 February-10 October December June August April SP per SqFt