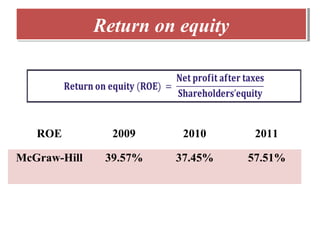
2. Return on equityReturn on equity
Has gone downHas gone down
The rise of stockholders’equity > The rise of Net incomeThe rise of stockholders’equity > The rise of Net incomeROE decreased 2.12 %ROE decreased 2.12 %
36.00%
36.50%
37.00%
37.50%
38.00%
38.50%
39.00%
39.50%
40.00%
2009 2010
3. Return on equityReturn on equity
Significant riseSignificant rise
Net income rised (828,000 to 911,000) &
stockholders’equity decreased (2,211,000 to 1,508,000)
Net income rised (828,000 to 911,000) &
stockholders’equity decreased (2,211,000 to 1,508,000)
ROE increased 22.06 %ROE increased 22.06 %
0.00%
10.00%
20.00%
30.00%
40.00%
50.00%
60.00%
70.00%
2010 2011
5. Return on equityReturn on equity
2009
0.00%
20.00%
40.00%
McGraw-
Hill
39.57%
Pearson 9%
2009
The using of McGraw-Hill’s stockholders’equity
was better than Pearson
The using of McGraw-Hill’s stockholders’equity
was better than Pearson
6. Return on equityReturn on equity
2010
0.00%
10.00%
20.00%
30.00%
40.00%
McGraw-Hill 37.45%
Pearson 23.14%
2010
The use of stockholders’equity and the debt of
McGraw-Hill were more effective
The use of stockholders’equity and the debt of
McGraw-Hill were more effective
2011
0.00%
20.00%
40.00%
60.00%
McGraw-Hill 57.51%
Pearson 16.05%
2011
7. Return on equityReturn on equity
2011
0.00%
20.00%
40.00%
60.00%
McGraw-Hill 57.51%
Industry
Average
16%
2011
More apply rewarded
than other shareholders
in the industry.
More apply rewarded
than other shareholders
in the industry.
10. Account Receivable TurnoverAccount Receivable Turnover
1
3
5
7
9
2009 2010
It increased 0.19 timesIt increased 0.19 timesGood policy in collecting money and
effectively process credit
Good policy in collecting money and
effectively process credit
11. Account Receivable TurnoverAccount Receivable Turnover
1.00
3.00
5.00
7.00
9.00
2010 2011
The average collection period increased 2
days in 2011 ( 58 days 60 days )
The average collection period increased 2
days in 2011 ( 58 days 60 days )
It decreased 0.26 timesIt decreased 0.26 times
12. Account Receivable TurnoverAccount Receivable Turnover
1.00
3.00
5.00
7.00
9.00
Pearson 4.00 4.24 4.23
McGraw-Hill 6.05 6.24 5.98
2009 2010 2011
In general, McGraw-Hill’s receivables turnover
is larger than Pearson through 3 years.
In general, McGraw-Hill’s receivables turnover
is larger than Pearson through 3 years.
The higher receivables turnover showed the more
efficient business operation and tight credit policies.
The higher receivables turnover showed the more
efficient business operation and tight credit policies.
13. Account Receivable TurnoverAccount Receivable Turnover
Receivables
Turnover 2009 2010 2011
McGraw-Hill 6.05 times 6.24 times 5.98 times
Pearson 4 times 4.24 times 4.23 times
2.05 times 2 times 1.75 times
McGraw-Hill’s policy to collect receivable was more
effective than competitor.
McGraw-Hill’s policy to collect receivable was more
effective than competitor.
14. Account Receivable TurnoverAccount Receivable Turnover
2011 McGraw-
Hill
Industry
Receivables
Turnover 5.98 times 8 times
McGraw-Hill was collected its receivable less
effective than industry.
McGraw-Hill was collected its receivable less
effective than industry.
2011: McGraw-Hill < Industry ( 2.02 times)2011: McGraw-Hill < Industry ( 2.02 times)