Financial Ratio Analysis Tutorial Exercise 1
•Download as DOC, PDF•
3 likes•3,591 views

Basic Accounting Topic 5

Recommended
Recommended
More Related Content
What's hot
What's hot (20)
Viewers also liked
Similar to Financial Ratio Analysis Tutorial Exercise 1
Similar to Financial Ratio Analysis Tutorial Exercise 1 (20)
More from Pang Shuen
More from Pang Shuen (20)
Recently uploaded
Recently uploaded (20)
Financial Ratio Analysis Tutorial Exercise 1
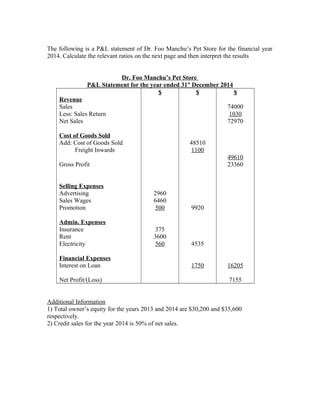
- 1. The following is a P&L statement of Dr. Foo Manchu’s Pet Store for the financial year 2014. Calculate the relevant ratios on the next page and then interpret the results Dr. Foo Manchu’s Pet Store P&L Statement for the year ended 31st December 2014 Revenue Sales Less: Sales Return Net Sales Cost of Goods Sold Add: Cost of Goods Sold Freight Inwards Gross Profit Selling Expenses Advertising Sales Wages Promotion Admin. Expenses Insurance Rent Electricity Financial Expenses Interest on Loan Net Profit/(Loss) $ 2960 6460 500 375 3600 560 $ 48510 1100 9920 4535 1750 $ 74000 1030 72970 49610 23360 16205 7155 Additional Information 1) Total owner’s equity for the years 2013 and 2014 are $30,200 and $35,600 respectively. 2) Credit sales for the year 2014 is 50% of net sales.
- 2. Complete the following calculations and interpret the trends from the 2013-2014 periods. (Tip: Put a next to ratio experiencing an increase and a next to a decreasing ratio. This is to avoid confusion while interpreting the ratio.) Profitability Ratios 2013 2014 Interpretation Return on Equity (ROE) 18.5% Net Profit Margin (NPM) 6.7% Gross Profit Margin (GPM) 34% Selling Exp. Ratio (SER) 16.5% General Exp. Ratio (GER) 8.8% Financial Exp. Ratio (FER) 2%
- 3. The following is a Balance Sheet of Dr. Foo Manchu’s Pet Store during the same financial period. Calculate the relevant ratios on the next page and then interpret the results. Dr. Foo Manchu’s Pet Store Balance Sheet as at 31st December 2014 Owner’s Equity Capital Add: Net Profit Less: Drawings Total O/E Represented by: Current Assets Debtors Inventory Prepaid Insurance Accrued Dividend Non – Current Assets Land & Office Buildings Long-Term Govt. Bonds Total Assets Current Liabilities Bank Overdraft Creditors Prepaid Commission Accrued Rent Deferred Liabilities Mortgage Total Liabilities Net Assets $ 4760 3440 525 150 62000 23145 1870 7050 900 600 $ 8875 85145 10420 48000 $ 30200 7155 1755 35600 94020 58420 35600 Additional Information 1) Debtors balance for 2013: 5490; inventory balance for 2013: 3755.
- 4. Complete the following calculations. (Tip: Put a next to ratio experiencing an increase and a next to a decreasing ratio. This is to avoid confusion while interpreting the ratio.) Stability Ratios 2013 2014 Interpretation Working Capital 1.03: 1 Total Debt 80.2% Stock Turnover 29.2 days Debtor Turnover 24.8 days Interest Coverage 2.5 times