More Related Content
Similar to Bản sao của L1 - PRACTICE PROBLEM.pdf
Similar to Bản sao của L1 - PRACTICE PROBLEM.pdf (20)
Bản sao của L1 - PRACTICE PROBLEM.pdf
- 1. Learning Module 1 The Time Value of Money
40
PRACTICE PROBLEMS
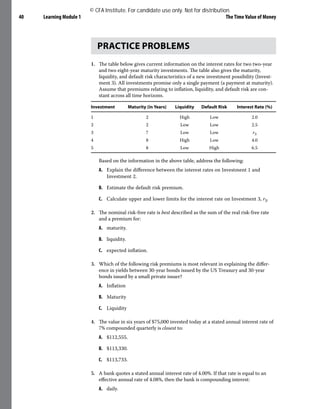
1. The table below gives current information on the interest rates for two two-year
and two eight-year maturity investments. The table also gives the maturity,
liquidity, and default risk characteristics of a new investment possibility (Invest-
ment 3). All investments promise only a single payment (a payment at maturity).
Assume that premiums relating to inflation, liquidity, and default risk are con-
stant across all time horizons.
Investment Maturity (in Years) Liquidity Default Risk Interest Rate (%)
1 2 High Low 2.0
2 2 Low Low 2.5
3 7 Low Low r3
4 8 High Low 4.0
5 8 Low High 6.5
Based on the information in the above table, address the following:
A. Explain the difference between the interest rates on Investment 1 and
Investment 2.
B. Estimate the default risk premium.
C. Calculate upper and lower limits for the interest rate on Investment 3, r3.
2. The nominal risk-free rate is best described as the sum of the real risk-free rate
and a premium for:
A. maturity.
B. liquidity.
C. expected inflation.
3. Which of the following risk premiums is most relevant in explaining the differ-
ence in yields between 30-year bonds issued by the US Treasury and 30-year
bonds issued by a small private issuer?
A. Inflation
B. Maturity
C. Liquidity
4. The value in six years of $75,000 invested today at a stated annual interest rate of
7% compounded quarterly is closest to:
A. $112,555.
B. $113,330.
C. $113,733.
5. A bank quotes a stated annual interest rate of 4.00%. If that rate is equal to an
effective annual rate of 4.08%, then the bank is compounding interest:
A. daily.
© CFA Institute. For candidate use only. Not for distribution.
- 2. Practice Problems 41
B. quarterly.
C. semiannually.
6. Given a €1,000,000 investment for four years with a stated annual rate of 3% com-
pounded continuously, the difference in its interest earnings compared with the
same investment compounded daily is closest to:
A. €1.
B. €6.
C. €455.
7. A couple plans to set aside $20,000 per year in a conservative portfolio projected
to earn 7 percent a year. If they make their first savings contribution one year
from now, how much will they have at the end of 20 years?
8. Two years from now, a client will receive the first of three annual payments of
$20,000 from a small business project. If she can earn 9 percent annually on her
investments and plans to retire in six years, how much will the three business
project payments be worth at the time of her retirement?
9. A saver deposits the following amounts in an account paying a stated annual rate
of 4%, compounded semiannually:
Year End of Year Deposits ($)
1 4,000
2 8,000
3 7,000
4 10,000
At the end of Year 4, the value of the account is closest to:
A. $30,432
B. $30,447
C. $31,677
10. To cover the first year’s total college tuition payments for his two children, a
father will make a $75,000 payment five years from now. How much will he need
to invest today to meet his first tuition goal if the investment earns 6 percent
annually?
11. Given the following timeline and a discount rate of 4% a year compounded
annually, the present value (PV), as of the end of Year 5 (PV5 ), of the cash flow
received at the end of Year 20 is closest to:
0 1 2 3 4 5
PV5
20
...
$50,000
A. $22,819.
B. $27,763.
C. $28,873.
© CFA Institute. For candidate use only. Not for distribution.
- 3. Learning Module 1 The Time Value of Money
42
12. A client requires £100,000 one year from now. If the stated annual rate is 2.50%
compounded weekly, the deposit needed today is closest to:
A. £97,500.
B. £97,532.
C. £97,561.
13. A client can choose between receiving 10 annual $100,000 retirement payments,
starting one year from today, or receiving a lump sum today. Knowing that he can
invest at a rate of 5 percent annually, he has decided to take the lump sum. What
lump sum today will be equivalent to the future annual payments?
14. You are considering investing in two different instruments. The first instrument
will pay nothing for three years, but then it will pay $20,000 per year for four
years. The second instrument will pay $20,000 for three years and $30,000 in the
fourth year. All payments are made at year-end. If your required rate of return on
these investments is 8 percent annually, what should you be willing to pay for:
A. The first instrument?
B. The second instrument (use the formula for a four-year annuity)?
15. Suppose you plan to send your daughter to college in three years. You expect her
to earn two-thirds of her tuition payment in scholarship money, so you estimate
that your payments will be $10,000 a year for four years. To estimate whether you
have set aside enough money, you ignore possible inflation in tuition payments
and assume that you can earn 8 percent annually on your investments. How
much should you set aside now to cover these payments?
16. An investment pays €300 annually for five years, with the first payment occurring
today. The present value (PV) of the investment discounted at a 4% annual rate is
closest to:
A. €1,336.
B. €1,389.
C. €1,625.
17. At a 5% interest rate per year compounded annually, the present value (PV) of a
10-year ordinary annuity with annual payments of $2,000 is $15,443.47. The PV
of a 10-year annuity due with the same interest rate and payments is closest to:
A. $14,708.
B. $16,216.
C. $17,443.
18. Grandparents are funding a newborn’s future university tuition costs, estimated
at $50,000/year for four years, with the first payment due as a lump sum in 18
years. Assuming a 6% effective annual rate, the required deposit today is closest
to:
A. $60,699.
B. $64,341.
© CFA Institute. For candidate use only. Not for distribution.
- 4. Practice Problems 43
C. $68,201.
19. The present value (PV) of an investment with the following year-end cash flows
(CF) and a 12% required annual rate of return is closest to:
Year Cash Flow (€)
1 100,000
2 150,000
5 –10,000
A. €201,747.
B. €203,191.
C. €227,573.
20. A perpetual preferred stock makes its first quarterly dividend payment of $2.00 in
five quarters. If the required annual rate of return is 6% compounded quarterly,
the stock’s present value is closest to:
A. $31.
B. $126.
C. $133.
21. A sweepstakes winner may select either a perpetuity of £2,000 a month begin-
ning with the first payment in one month or an immediate lump sum payment
of £350,000. If the annual discount rate is 6% compounded monthly, the present
value of the perpetuity is:
A. less than the lump sum.
B. equal to the lump sum.
C. greater than the lump sum.
22. For a lump sum investment of ¥250,000 invested at a stated annual rate of 3%
compounded daily, the number of months needed to grow the sum to ¥1,000,000
is closest to:
A. 555.
B. 563.
C. 576.
23. An investment of €500,000 today that grows to €800,000 after six years has a
stated annual interest rate closest to:
A. 7.5% compounded continuously.
B. 7.7% compounded daily.
C. 8.0% compounded semiannually.
24. A client plans to send a child to college for four years starting 18 years from now.
Having set aside money for tuition, she decides to plan for room and board also.
© CFA Institute. For candidate use only. Not for distribution.
- 5. Learning Module 1 The Time Value of Money
44
She estimates these costs at $20,000 per year, payable at the beginning of each
year, by the time her child goes to college. If she starts next year and makes 17
payments into a savings account paying 5 percent annually, what annual pay-
ments must she make?
25. A couple plans to pay their child’s college tuition for 4 years starting 18 years
from now. The current annual cost of college is C$7,000, and they expect this cost
to rise at an annual rate of 5 percent. In their planning, they assume that they can
earn 6 percent annually. How much must they put aside each year, starting next
year, if they plan to make 17 equal payments?
26. A sports car, purchased for £200,000, is financed for five years at an annual rate of
6% compounded monthly. If the first payment is due in one month, the monthly
payment is closest to:
A. £3,847.
B. £3,867.
C. £3,957.
27. Given a stated annual interest rate of 6% compounded quarterly, the level amount
that, deposited quarterly, will grow to £25,000 at the end of 10 years is closest to:
A. £461.
B. £474.
C. £836.
28. A client invests €20,000 in a four-year certificate of deposit (CD) that annually
pays interest of 3.5%. The annual CD interest payments are automatically rein-
vested in a separate savings account at a stated annual interest rate of 2% com-
pounded monthly. At maturity, the value of the combined asset is closest to:
A. €21,670.
B. €22,890.
C. €22,950.
© CFA Institute. For candidate use only. Not for distribution.
- 6. Practice Problems 151
PRACTICE PROBLEMS
1. Published ratings on stocks ranging from 1 (strong sell) to 5 (strong buy) are
examples of which measurement scale?
A. Ordinal
B. Continuous
C. Nominal
2. Data values that are categorical and not amenable to being organized in a logical
order are most likely to be characterized as:
A. ordinal data.
B. discrete data.
C. nominal data.
3. Which of the following data types would be classified as being categorical?
A. Discrete
B. Nominal
C. Continuous
4. A fixed-income analyst uses a proprietary model to estimate bankruptcy proba-
bilities for a group of firms. The model generates probabilities that can take any
value between 0 and 1. The resulting set of estimated probabilities would most
likely be characterized as:
A. ordinal data.
B. discrete data.
C. continuous data.
5. An analyst uses a software program to analyze unstructured data—specifically,
management’s earnings call transcript for one of the companies in her research
coverage. The program scans the words in each sentence of the transcript and
then classifies the sentences as having negative, neutral, or positive sentiment.
The resulting set of sentiment data would most likely be characterized as:
A. ordinal data.
B. discrete data.
C. nominal data.
The following information relates to questions
6-7
An equity analyst gathers total returns for three country equity indexes over the
past four years. The data are presented below.
© CFA Institute. For candidate use only. Not for distribution.
- 7. Learning Module 2 Organizing, Visualizing, and Describing Data
152
Time Period Index A Index B Index C
Year t–3 15.56% 11.84% −4.34%
Year t–2 −4.12% −6.96% 9.32%
Year t–1 11.19% 10.29% −12.72%
Year t 8.98% 6.32% 21.44%
6. Each individual column of data in the table can be best characterized as:
A. panel data.
B. time-series data.
C. cross-sectional data.
7. Each individual row of data in the table can be best characterized as:
A. panel data.
B. time-series data.
C. cross-sectional data.
8. A two-dimensional rectangular array would be most suitable for organizing a
collection of raw:
A. panel data.
B. time-series data.
C. cross-sectional data.
9. In a frequency distribution, the absolute frequency measure:
A. represents the percentages of each unique value of the variable.
B. represents the actual number of observations counted for each unique value
of the variable.
C. allows for comparisons between datasets with different numbers of total
observations.
10. An investment fund has the return frequency distribution shown in the following
exhibit.
Return Interval (%) Absolute Frequency
−10.0 to −7.0 3
−7.0 to −4.0 7
−4.0 to −1.0 10
−1.0 to +2.0 12
+2.0 to +5.0 23
+5.0 to +8.0 5
Which of the following statements is correct?
© CFA Institute. For candidate use only. Not for distribution.
- 8. Practice Problems 153
A. The relative frequency of the bin “−1.0 to +2.0” is 20%.
B. The relative frequency of the bin “+2.0 to +5.0” is 23%.
C. The cumulative relative frequency of the bin “+5.0 to +8.0” is 91.7%.
11. An analyst is using the data in the following exhibit to prepare a statistical report.
Portfolio’s Deviations from Benchmark Return for a 12-Year Period (%)
Year 1 2.48 Year 7 −9.19
Year 2 −2.59 Year 8 −5.11
Year 3 9.47 Year 9 1.33
Year 4 −0.55 Year 10 6.84
Year 5 −1.69 Year 11 3.04
Year 6 −0.89 Year 12 4.72
The cumulative relative frequency for the bin −1.71% ≤ x < 2.03% is closest to:
A. 0.250.
B. 0.333.
C. 0.583.
The following information relates to questions
12-13
A fixed-income portfolio manager creates a contingency table of the number of
bonds held in her portfolio by sector and bond rating. The contingency table is
presented here:
Bond Rating
Sector A AA AAA
Communication Services 25 32 27
Consumer Staples 30 25 25
Energy 100 85 30
Health Care 200 100 63
Utilities 22 28 14
12. The marginal frequency of energy sector bonds is closest to:
A. 27.
B. 85.
C. 215.
13. The relative frequency of AA rated energy bonds, based on the total count, is
© CFA Institute. For candidate use only. Not for distribution.
- 9. Learning Module 2 Organizing, Visualizing, and Describing Data
154
closest to:
A. 10.5%.
B. 31.5%.
C. 39.5%.
14. The following is a frequency polygon of monthly exchange rate changes in the US
dollar/Japanese yen spot exchange rate for a four-year period. A positive change
represents yen appreciation (the yen buys more dollars), and a negative change
represents yen depreciation (the yen buys fewer dollars).
Exhibit 1: Monthly Changes in the US Dollar/Japanese Yen Spot Exchange
Rate
–3
–5 3
1
–1
Frequency
20
15
10
5
0
Return Interval Midpoint (%)
Based on the chart, yen appreciation:
A. occurred more than 50% of the time.
B. was less frequent than yen depreciation.
C. in the 0.0 to 2.0 interval occurred 20% of the time.
15. A bar chart that orders categories by frequency in descending order and includes
a line displaying cumulative relative frequency is referred to as a:
A. Pareto Chart.
B. grouped bar chart.
C. frequency polygon.
16. Which visualization tool works best to represent unstructured, textual data?
A. Tree-Map
B. Scatter plot
© CFA Institute. For candidate use only. Not for distribution.
- 10. Practice Problems 155
C. Word cloud
17. A tree-map is best suited to illustrate:
A. underlying trends over time.
B. joint variations in two variables.
C. value differences of categorical groups.
18. A line chart with two variables—for example, revenues and earnings per share—
is best suited for visualizing:
A. the joint variation in the variables.
B. underlying trends in the variables over time.
C. the degree of correlation between the variables.
19. A heat map is best suited for visualizing the:
A. frequency of textual data.
B. degree of correlation between different variables.
C. shape, center, and spread of the distribution of numerical data.
20. Which valuation tool is recommended to be used if the goal is to make compari-
sons of three or more variables over time?
A. Heat map
B. Bubble line chart
C. Scatter plot matrix
The following information relates to questions
21-22
The following histogram shows a distribution of the S&P 500 Index annual re-
turns for a 50-year period:
© CFA Institute. For candidate use only. Not for distribution.
- 11. Learning Module 2 Organizing, Visualizing, and Describing Data
156
–37
to
–32
–32
to
–27
–27
to
–22
–22
to
–17
–17
to
–12
–12
to
–7
–7
to
–2
–2
to
3
3
to
8
8
to
13
13
to
18
18
to
23
23
to
28
28
to
33
33
to
38
Frequency
8
7
6
5
4
3
2
1
0
Return Intervals (%)
21. The bin containing the median return is:
A. 3% to 8%.
B. 8% to 13%.
C. 13% to 18%.
22. Based on the previous histogram, the distribution is best described as being:
A. unimodal.
B. bimodal.
C. trimodal.
23. The annual returns for three portfolios are shown in the following exhibit. Portfo-
lios P and R were created in Year 1, Portfolio Q in Year 2.
Annual Portfolio Returns (%)
Year 1 Year 2 Year 3 Year 4 Year 5
Portfolio P −3.0 4.0 5.0 3.0 7.0
Portfolio Q −3.0 6.0 4.0 8.0
Portfolio R 1.0 −1.0 4.0 4.0 3.0
The median annual return from portfolio creation to Year 5 for:
A. Portfolio P is 4.5%.
B. Portfolio Q is 4.0%.
© CFA Institute. For candidate use only. Not for distribution.
- 12. Practice Problems 157
C. Portfolio R is higher than its arithmetic mean annual return.
24. At the beginning of Year X, an investor allocated his retirement savings in the
asset classes shown in the following exhibit and earned a return for Year X as also
shown.
Asset Class
Asset Allocation
(%) Asset Class Return for Year X (%)
Large-cap US equities 20.0 8.0
Small-cap US equities 40.0 12.0
Emerging market equities 25.0 −3.0
High-yield bonds 15.0 4.0
The portfolio return for Year X is closest to:
A. 5.1%.
B. 5.3%.
C. 6.3%.
25. The following exhibit shows the annual returns for Fund Y.
Fund Y (%)
Year 1 19.5
Year 2 −1.9
Year 3 19.7
Year 4 35.0
Year 5 5.7
The geometric mean return for Fund Y is closest to:
A. 14.9%.
B. 15.6%.
C. 19.5%.
26. A portfolio manager invests €5,000 annually in a security for four years at the
prices shown in the following exhibit.
Purchase Price of Security (€ per unit)
Year 1 62.00
Year 2 76.00
Year 3 84.00
Year 4 90.00
The average price is best represented as the:
A. harmonic mean of €76.48.
B. geometric mean of €77.26.
C. arithmetic average of €78.00.
© CFA Institute. For candidate use only. Not for distribution.
- 13. Learning Module 2 Organizing, Visualizing, and Describing Data
158
27. When analyzing investment returns, which of the following statements is cor-
rect?
A. The geometric mean will exceed the arithmetic mean for a series with
non-zero variance.
B. The geometric mean measures an investment’s compound rate of growth
over multiple periods.
C. The arithmetic mean measures an investment’s terminal value over multiple
periods.
The following information relates to questions
28-32
A fund had the following experience over the past 10 years:
Year Return
1 4.5%
2 6.0%
3 1.5%
4 −2.0%
5 0.0%
6 4.5%
7 3.5%
8 2.5%
9 5.5%
10 4.0%
28. The arithmetic mean return over the 10 years is closest to:
A. 2.97%.
B. 3.00%.
C. 3.33%.
29. The geometric mean return over the 10 years is closest to:
A. 2.94%.
B. 2.97%.
C. 3.00%.
30. The harmonic mean return over the 10 years is closest to:
A. 2.94%.
B. 2.97%.
C. 3.00%.
© CFA Institute. For candidate use only. Not for distribution.
- 14. Practice Problems 159
31. The standard deviation of the 10 years of returns is closest to:
A. 2.40%.
B. 2.53%.
C. 7.58%.
32. The target semideviation of the returns over the 10 years if the target is 2% is
closest to:
A. 1.42%.
B. 1.50%.
C. 2.01%.
The following information relates to questions
33-34
180
160
140
120
100
80
60
40
154.45
51.51
114.25
100.49
79.74
33. The median is closest to:
A. 34.51.
B. 100.49.
C. 102.98.
34. The interquartile range is closest to:
A. 13.76.
B. 25.74.
C. 34.51.
© CFA Institute. For candidate use only. Not for distribution.
- 15. Learning Module 2 Organizing, Visualizing, and Describing Data
160
The following information relates to questions
35-36
The following exhibit shows the annual MSCI World Index total returns for a
10-year period.
Year 1 15.25% Year 6 30.79%
Year 2 10.02% Year 7 12.34%
Year 3 20.65% Year 8 −5.02%
Year 4 9.57% Year 9 16.54%
Year 5 −40.33% Year 10 27.37%
35. The fourth quintile return for the MSCI World Index is closest to:
A. 20.65%.
B. 26.03%.
C. 27.37%.
36. For Year 6–Year 10, the mean absolute deviation of the MSCI World Index total
returns is closest to:
A. 10.20%.
B. 12.74%.
C. 16.40%.
37. Annual returns and summary statistics for three funds are listed in the following
exhibit:
Annual Returns (%)
Year Fund ABC Fund XYZ Fund PQR
Year 1 −20.0 −33.0 −14.0
Year 2 23.0 −12.0 −18.0
Year 3 −14.0 −12.0 6.0
Year 4 5.0 −8.0 −2.0
Year 5 −14.0 11.0 3.0
Mean −4.0 −10.8 −5.0
Standard deviation 17.8 15.6 10.5
The fund with the highest absolute dispersion is:
A. Fund PQR if the measure of dispersion is the range.
B. Fund XYZ if the measure of dispersion is the variance.
C. Fund ABC if the measure of dispersion is the mean absolute deviation.
38. The average return for Portfolio A over the past twelve months is 3%, with a stan-
© CFA Institute. For candidate use only. Not for distribution.
- 16. Practice Problems 161
dard deviation of 4%. The average return for Portfolio B over this same period
is also 3%, but with a standard deviation of 6%. The geometric mean return of
Portfolio A is 2.85%. The geometric mean return of Portfolio B is:
A. less than 2.85%.
B. equal to 2.85%.
C. greater than 2.85%.
39. The mean monthly return and the standard deviation for three industry sectors
are shown in the following exhibit.
Sector Mean Monthly Return (%)
Standard Deviation of Return
(%)
Utilities (UTIL) 2.10 1.23
Materials (MATR) 1.25 1.35
Industrials (INDU) 3.01 1.52
Based on the coefficient of variation, the riskiest sector is:
A. utilities.
B. materials.
C. industrials.
The following information relates to questions
40-42
An analyst examined a cross-section of annual returns for 252 stocks and calcu-
lated the following statistics:
Arithmetic Average 9.986%
Geometric Mean 9.909%
Variance 0.001723
Skewness 0.704
Excess Kurtosis 0.503
40. The coefficient of variation is closest to:
A. 0.02.
B. 0.42.
C. 2.41.
41. This distribution is best described as:
A. negatively skewed.
B. having no skewness.
C. positively skewed.
© CFA Institute. For candidate use only. Not for distribution.
- 17. Learning Module 2 Organizing, Visualizing, and Describing Data
162
42. Compared to the normal distribution, this sample’s distribution is best described
as having tails of the distribution with:
A. less probability than the normal distribution.
B. the same probability as the normal distribution.
C. more probability than the normal distribution.
43. An analyst calculated the excess kurtosis of a stock’s returns as −0.75. From this
information, we conclude that the distribution of returns is:
A. normally distributed.
B. thin-tailed compared to the normal distribution.
C. fat-tailed compared to the normal distribution.
44. A correlation of 0.34 between two variables, X and Y, is best described as:
A. changes in X causing changes in Y.
B. a positive association between X and Y.
C. a curvilinear relationship between X and Y.
45. Which of the following is a potential problem with interpreting a correlation
coefficient?
A. Outliers
B. Spurious correlation
C. Both outliers and spurious correlation
The following information relates to questions
46-47
An analyst is evaluating the tendency of returns on the portfolio of stocks she
manages to move along with bond and real estate indexes. She gathered monthly
data on returns and the indexes:
Returns (%)
Portfolio Returns
Bond Index
Returns
Real Estate Index
Returns
Arithmetic average 5.5 3.2 7.8
Standard deviation 8.2 3.4 10.3
Portfolio Returns and
Bond Index Returns
Portfolio Returns and Real
Estate Index Returns
Covariance 18.9 −55.9
© CFA Institute. For candidate use only. Not for distribution.
- 18. Practice Problems 163
46. Without calculating the correlation coefficient, the correlation of the portfolio
returns and the bond index returns is:
A. negative.
B. zero.
C. positive.
47. Without calculating the correlation coefficient, the correlation of the portfolio
returns and the real estate index returns is:
A. negative.
B. zero.
C. positive.
48. Consider two variables, A and B. If variable A has a mean of −0.56, variable B
has a mean of 0.23, and the covariance between the two variables is positive, the
correlation between these two variables is:
A. negative.
B. zero.
C. positive.
© CFA Institute. For candidate use only. Not for distribution.
- 19. Practice Problems 221
PRACTICE PROBLEMS
1. In probability theory, exhaustive events are best described as the set of events
that:
A. have a probability of zero.
B. are mutually exclusive.
C. include all potential outcomes.
2. Which probability estimate most likely varies greatly between people?
A. An a priori probability
B. An empirical probability
C. A subjective probability
3. If the probability that Zolaf Company sales exceed last year’s sales is 0.167, the
odds for exceeding sales are closest to:
A. 1 to 5.
B. 1 to 6.
C. 5 to 1.
4. After six months, the growth portfolio that Rayan Khan manages has outper-
formed its benchmark. Khan states that his odds of beating the benchmark for
the year are 3 to 1. If these odds are correct, what is the probability that Khan’s
portfolio will beat the benchmark for the year?
A. 0.33
B. 0.67
C. 0.75
5. Suppose that 5% of the stocks meeting your stock-selection criteria are in the
telecommunications (telecom) industry. Also, dividend-paying telecom stocks
are 1% of the total number of stocks meeting your selection criteria. What is the
probability that a stock is dividend paying, given that it is a telecom stock that has
met your stock selection criteria?
6. You are using the following three criteria to screen potential acquisition targets
from a list of 500 companies:
Criterion
Fraction of the 500 Companies
Meeting the Criterion
Product lines compatible 0.20
Company will increase combined sales growth rate 0.45
Balance sheet impact manageable 0.78
If the criteria are independent, how many companies will pass the screen?
7. Florence Hixon is screening a set of 100 stocks based on two criteria (Criterion
© CFA Institute. For candidate use only. Not for distribution.
- 20. Learning Module 3 Probability Concepts
222
1 and Criterion 2). She set the passing level such that 50% of the stocks passed
each screen. For these stocks, the values for Criterion 1 and Criterion 2 are not
independent but are positively related. How many stocks should pass Hixon’s two
screens?
A. Less than 25
B. 25
C. More than 25
8. You apply both valuation criteria and financial strength criteria in choosing
stocks. The probability that a randomly selected stock (from your investment
universe) meets your valuation criteria is 0.25. Given that a stock meets your
valuation criteria, the probability that the stock meets your financial strength
criteria is 0.40. What is the probability that a stock meets both your valuation and
financial strength criteria?
9. The probability of an event given that another event has occurred is a:
A. joint probability.
B. marginal probability.
C. conditional probability.
10. After estimating the probability that an investment manager will exceed his
benchmark return in each of the next two quarters, an analyst wants to forecast
the probability that the investment manager will exceed his benchmark return
over the two-quarter period in total. Assuming that each quarter’s performance is
independent of the other, which probability rule should the analyst select?
A. Addition rule
B. Multiplication rule
C. Total probability rule
11. Which of the following is a property of two dependent events?
A. The two events must occur simultaneously.
B. The probability of one event influences the probability of the other event.
C. The probability of the two events occurring is the product of each event’s
probability.
12. Which of the following best describes how an analyst would estimate the expect-
ed value of a firm using the scenarios of bankruptcy and non-bankruptcy? The
analyst would use:
A. the addition rule.
B. conditional expected values.
C. the total probability rule for expected value.
13. Suppose the prospects for recovering principal for a defaulted bond issue depend
on which of two economic scenarios prevails. Scenario 1 has probability 0.75 and
will result in recovery of $0.90 per $1 principal value with probability 0.45, or
© CFA Institute. For candidate use only. Not for distribution.
- 21. Practice Problems 223
in recovery of $0.80 per $1 principal value with probability 0.55. Scenario 2 has
probability 0.25 and will result in recovery of $0.50 per $1 principal value with
probability 0.85, or in recovery of $0.40 per $1 principal value with probability
0.15.
A. Compute the probability of each of the four possible recovery amounts:
$0.90, $0.80, $0.50, and $0.40.
B. Compute the expected recovery, given the first scenario.
C. Compute the expected recovery, given the second scenario.
D. Compute the expected recovery.
E. Graph the information in a probability tree diagram.
14. An analyst developed two scenarios with respect to the recovery of $100,000
principal from defaulted loans:
Scenario
Probability
of Scenario (%)
Amount
Recovered ($)
Probability
of Amount (%)
1 40 50,000 60
30,000 40
2 60 80,000 90
60,000 10
The amount of the expected recovery is closest to:
A. $36,400.
B. $55,000.
C. $63,600.
15. The probability distribution for a company’s sales is:
Probability Sales ($ millions)
0.05 70
0.70 40
0.25 25
The standard deviation of sales is closest to:
A. $9.81 million.
B. $12.20 million.
C. $32.40 million.
16. US and Spanish bonds have return standard deviations of 0.64 and 0.56, respec-
tively. If the correlation between the two bonds is 0.24, the covariance of returns
is closest to:
A. 0.086.
B. 0.335.
C. 0.390.
© CFA Institute. For candidate use only. Not for distribution.
- 22. Learning Module 3 Probability Concepts
224
17. The covariance of returns is positive when the returns on two assets tend to:
A. have the same expected values.
B. be above their expected value at different times.
C. be on the same side of their expected value at the same time.
18. Which of the following correlation coefficients indicates the weakest linear rela-
tionship between two variables?
A. –0.67
B. –0.24
C. 0.33
19. An analyst develops the following covariance matrix of returns:
Hedge Fund Market Index
Hedge fund 256 110
Market index 110 81
The correlation of returns between the hedge fund and the market index is closest
to:
A. 0.005.
B. 0.073.
C. 0.764.
20. All else being equal, as the correlation between two assets approaches +1.0, the
diversification benefits:
A. decrease.
B. stay the same.
C. increase.
21. Given a portfolio of five stocks, how many unique covariance terms, excluding
variances, are required to calculate the portfolio return variance?
A. 10
B. 20
C. 25
22. Which of the following statements is most accurate? If the covariance of returns
between two assets is 0.0023, then:
A. the assets’ risk is near zero.
B. the asset returns are unrelated.
C. the asset returns have a positive relationship.
© CFA Institute. For candidate use only. Not for distribution.
- 23. Practice Problems 225
23. A two-stock portfolio includes stocks with the following characteristics:
Stock 1 Stock 2
Expected return 7% 10%
Standard deviation 12% 25%
Portfolio weights 0.30 0.70
Correlation 0.20
What is the standard deviation of portfolio returns?
A. 14.91%
B. 18.56%
C. 21.10%
24. Lena Hunziger has designed the three-asset portfolio summarized below:
Asset 1 Asset 2 Asset 3
Expected return 5% 6% 7%
Portfolio weight 0.20 0.30 0.50
Variance-Covariance Matrix
Asset 1 Asset 2 Asset 3
Asset 1 196 105 140
Asset 2 105 225 150
Asset 3 140 150 400
Hunziger estimated the portfolio return to be 6.3%. What is the portfolio stan-
dard deviation?
A. 13.07%
B. 13.88%
C. 14.62%
25. An analyst produces the following joint probability function for a foreign index
(FI) and a domestic index (DI).
RDI = 30% RDI = 25% RDI = 15%
RFI = 25% 0.25
RFI = 15% 0.50
RFI = 10% 0.25
The covariance of returns on the foreign index and the returns on the domestic
index is closest to:
A. 26.39.
B. 26.56.
C. 28.12.
26. You have developed a set of criteria for evaluating distressed credits. Companies
that do not receive a passing score are classed as likely to go bankrupt within 12
© CFA Institute. For candidate use only. Not for distribution.
- 24. Learning Module 3 Probability Concepts
226
months. You gathered the following information when validating the criteria:
■ Forty percent of the companies to which the test is administered will go
bankrupt within 12 months: P(non-survivor) = 0.40.
■ Fifty-five percent of the companies to which the test is administered pass it:
P(pass test) = 0.55.
■ The probability that a company will pass the test given that it will subse-
quently survive 12 months, is 0.85: P(pass test | survivor) = 0.85.
A. What is P(pass test | non-survivor)?
B. Using Bayes’ formula, calculate the probability that a company is a survivor,
given that it passes the test; that is, calculate P(survivor | pass test).
C. What is the probability that a company is a non-survivor, given that it fails
the test?
D. Is the test effective?
27. An analyst estimates that 20% of high-risk bonds will fail (go bankrupt). If she ap-
plies a bankruptcy prediction model, she finds that 70% of the bonds will receive
a “good” rating, implying that they are less likely to fail. Of the bonds that failed,
only 50% had a “good” rating. Use Bayes’ formula to predict the probability of fail-
ure given a “good” rating. (Hint, let P(A) be the probability of failure, P(B) be the
probability of a “good” rating, P(B | A) be the likelihood of a “good” rating given
failure, and P(A | B) be the likelihood of failure given a “good” rating.)
A. 5.7%
B. 14.3%
C. 28.6%
28. In a typical year, 5% of all CEOs are fired for “performance” reasons. Assume
that CEO performance is judged according to stock performance and that 50% of
stocks have above-average returns or “good” performance. Empirically, 30% of all
CEOs who were fired had “good” performance. Using Bayes’ formula, what is the
probability that a CEO will be fired given “good” performance? (Hint, let P(A) be
the probability of a CEO being fired, P(B) be the probability of a “good” perfor-
mance rating, P(B | A) be the likelihood of a “good” performance rating given that
the CEO was fired, and P(A | B) be the likelihood of the CEO being fired given a
“good” performance rating.)
A. 1.5%
B. 2.5%
C. 3.0%
29. A manager will select 20 bonds out of his universe of 100 bonds to construct a
portfolio. Which formula provides the number of possible portfolios?
A. Permutation formula
B. Multinomial formula
C. Combination formula
30. A firm will select two of four vice presidents to be added to the investment com-
© CFA Institute. For candidate use only. Not for distribution.
- 25. Practice Problems 227
mittee. How many different groups of two are possible?
A. 6
B. 12
C. 24
31. From an approved list of 25 funds, a portfolio manager wants to rank 4 mutual
funds from most recommended to least recommended. Which formula is most
appropriate to calculate the number of possible ways the funds could be ranked?
A. Permutation formula
B. Multinomial formula
C. Combination formula
32. Himari Fukumoto has joined a new firm and is selecting mutual funds in the
firm’s pension plan. If 10 mutual funds are available, and she plans to select four,
how many different sets of mutual funds can she choose?
A. 210
B. 720
C. 5,040
The following information relates to questions
33-35
Gerd Sturm wants to sponsor a contest with a $1 million prize. The winner must
pick the stocks that will be the top five performers next year among the 30 stocks
in a well-known large-cap stock index. He asks you to estimate the chances that
contestants can win the contest.
33. What are the chances of winning if the contestants must pick the five stocks in
the correct order of their total return? If choosing five stocks randomly, a contes-
tant’s chance of winning is one out of:
A. 142,506.
B. 17,100,720.
C. 24,300,000.
34. What are the chances of winning if the contestants must pick the top five stocks
without regard to order? If choosing five stocks randomly, a contestant’s chance
of winning is one out of:
A. 142,506.
B. 17,100,720.
C. 24,300,000.
35. Sturm asks, “Can we trust these probabilities of winning?”
© CFA Institute. For candidate use only. Not for distribution.
- 26. Learning Module 4 Common Probability Distributions
288
PRACTICE PROBLEMS
1. A European put option on stock conveys the right to sell the stock at a prespeci-
fied price, called the exercise price, at the maturity date of the option. The value
of this put at maturity is (exercise price – stock price) or $0, whichever is greater.
Suppose the exercise price is $100 and the underlying stock trades in increments
of $0.01. At any time before maturity, the terminal value of the put is a random
variable.
A. Describe the distinct possible outcomes for terminal put value. (Think of the
put’s maximum and minimum values and its minimum price increments.)
B. Is terminal put value, at a time before maturity, a discrete or continuous
random variable?
C. Letting Y stand for terminal put value, express in standard notation the
probability that terminal put value is less than or equal to $24. No calcula-
tions or formulas are necessary.
2. Which of the following is a continuous random variable?
A. The value of a futures contract quoted in increments of $0.05
B. The total number of heads recorded in 1 million tosses of a coin
C. The rate of return on a diversified portfolio of stocks over a three-month
period
3. X is a discrete random variable with possible outcomes X = {1, 2, 3, 4}. Three
functions—f(x), g(x), and h(x)—are proposed to describe the probabilities of the
outcomes in X.
Probability Function
X = x f(x) = P(X = x) g(x) = P(X = x) h(x) = P(X = x)
1 −0.25 0.20 0.20
2 0.25 0.25 0.25
3 0.50 0.50 0.30
4 0.25 0.05 0.35
The conditions for a probability function are satisfied by:
A. f(x).
B. g(x).
C. h(x).
4. The value of the cumulative distribution function F(x), where x is a particular
outcome, for a discrete uniform distribution:
A. sums to 1.
B. lies between 0 and 1.
C. decreases as x increases.
© CFA Institute. For candidate use only. Not for distribution.
- 27. Practice Problems 289
5. In a discrete uniform distribution with 20 potential outcomes of integers 1–20,
the probability that X is greater than or equal to 3 but less than 6, P(3 ≤ X < 6), is:
A. 0.10.
B. 0.15.
C. 0.20.
6. You are forecasting sales for a company in the fourth quarter of its fiscal year.
Your low-end estimate of sales is €14 million, and your high-end estimate is €15
million. You decide to treat all outcomes for sales between these two values as
equally likely, using a continuous uniform distribution.
A. What is the expected value of sales for the fourth quarter?
B. What is the probability that fourth-quarter sales will be less than or equal to
€14,125,000?
7. The cumulative distribution function for a discrete random variable is shown in
the following table.
X = x
Cumulative Distribution Function
F(x) = P(X ≤ x)
1 0.15
2 0.25
3 0.50
4 0.60
5 0.95
6 1.00
The probability that X will take on a value of either 2 or 4 is closest to:
A. 0.20.
B. 0.35.
C. 0.85.
8. A random number between zero and one is generated according to a continuous
uniform distribution. What is the probability that the first number generated will
have a value of exactly 0.30?
A. 0%
B. 30%
C. 70%
9. Define the term “binomial random variable.” Describe the types of problems for
which the binomial distribution is used.
10. For a binomial random variable with five trials and a probability of success on
each trial of 0.50, the distribution will be:
A. skewed.
B. uniform.
© CFA Institute. For candidate use only. Not for distribution.
- 28. Learning Module 4 Common Probability Distributions
290
C. symmetric.
11. Over the last 10 years, a company’s annual earnings increased year over year
seven times and decreased year over year three times. You decide to model the
number of earnings increases for the next decade as a binomial random variable.
For Parts B, C, and D of this problem, assume the estimated probability is the
actual probability for the next decade.
A. What is your estimate of the probability of success, defined as an increase in
annual earnings?
B. What is the probability that earnings will increase in exactly 5 of the next 10
years?
C. Calculate the expected number of yearly earnings increases during the next
10 years.
D. Calculate the variance and standard deviation of the number of yearly earn-
ings increases during the next 10 years.
E. The expression for the probability function of a binomial random variable
depends on two major assumptions. In the context of this problem, what
must you assume about annual earnings increases to apply the binomial
distribution in Part B? What reservations might you have about the validity
of these assumptions?
12. A portfolio manager annually outperforms her benchmark 60% of the time.
Assuming independent annual trials, what is the probability that she will outper-
form her benchmark four or more times over the next five years?
A. 0.26
B. 0.34
C. 0.48
13. You are examining the record of an investment newsletter writer who claims a
70% success rate in making investment recommendations that are profitable over
a one-year time horizon. You have the one-year record of the newsletter’s seven
most recent recommendations. Four of those recommendations were profitable.
If all the recommendations are independent and the newsletter writer’s skill is as
claimed, what is the probability of observing four or fewer profitable recommen-
dations out of seven in total?
14. If the probability that a portfolio outperforms its benchmark in any quarter is
0.75, the probability that the portfolio outperforms its benchmark in three or
fewer quarters over the course of a year is closest to:
A. 0.26
B. 0.42
C. 0.68
15. Which of the following events can be represented as a Bernoulli trial?
A. The flip of a coin
B. The closing price of a stock
© CFA Institute. For candidate use only. Not for distribution.
- 29. Practice Problems 291
C. The picking of a random integer between 1 and 10
16. A stock is priced at $100.00 and follows a one-period binomial process with an
up move that equals 1.05 and a down move that equals 0.97. If 1 million Bernoulli
trials are conducted and the average terminal stock price is $102.00, the probabil-
ity of an up move (p) is closest to:
A. 0.375.
B. 0.500.
C. 0.625.
17. A call option on a stock index is valued using a three-step binomial tree with an
up move that equals 1.05 and a down move that equals 0.95. The current level of
the index is $190, and the option exercise price is $200. If the option value is posi-
tive when the stock price exceeds the exercise price at expiration and $0 other-
wise, the number of terminal nodes with a positive payoff is:
A. one.
B. two.
C. three.
18. State the approximate probability that a normal random variable will fall within
the following intervals:
A. Mean plus or minus one standard deviation.
B. Mean plus or minus two standard deviations.
C. Mean plus or minus three standard deviations.
19. In futures markets, profits or losses on contracts are settled at the end of each
trading day. This procedure is called marking to market or daily resettlement.
By preventing a trader’s losses from accumulating over many days, marking to
market reduces the risk that traders will default on their obligations. A futures
markets trader needs a liquidity pool to meet the daily mark to market. If liquidi-
ty is exhausted, the trader may be forced to unwind his position at an unfavorable
time.
Suppose you are using financial futures contracts to hedge a risk in your portfo-
lio. You have a liquidity pool (cash and cash equivalents) of λ dollars per contract
and a time horizon of T trading days. For a given size liquidity pool, λ, Kolb,
Gay, and Hunter developed an expression for the probability stating that you will
exhaust your liquidity pool within a T-day horizon as a result of the daily mark-
ing to market. Kolb et al. assumed that the expected change in futures price is 0
and that futures price changes are normally distributed. With σ representing the
standard deviation of daily futures price changes, the standard deviation of price
changes over a time horizon to day T is
σ
√
_
T
, given continuous compounding.
With that background, the Kolb et al. expression is
Probability of exhausting liquidity pool = 2[1 – N(x)],
where
x = λ/
(
σ
√
_
T
)
. Here, x is a standardized value of λ. N(x) is the standard
normal cumulative distribution function. For some intuition about 1 – N(x) in
the expression, note that the liquidity pool is exhausted if losses exceed the size
of the liquidity pool at any time up to and including T; the probability of that
event happening can be shown to be proportional to an area in the right tail of a
© CFA Institute. For candidate use only. Not for distribution.
- 30. Learning Module 4 Common Probability Distributions
292
standard normal distribution, 1 – N(x).
Using the Kolb et al. expression, answer the following questions:
A. Your hedging horizon is five days, and your liquidity pool is $2,000 per con-
tract. You estimate that the standard deviation of daily price changes for the
contract is $450. What is the probability that you will exhaust your liquidity
pool in the five-day period?
B. Suppose your hedging horizon is 20 days but all the other facts given in
Part A remain the same. What is the probability that you will exhaust your
liquidity pool in the 20-day period?
20. Which of the following is characteristic of the normal distribution?
A. Asymmetry
B. Kurtosis of 3
C. Definitive limits or boundaries
21. Which of the following assets most likely requires the use of a multivariate distri-
bution for modeling returns?
A. A call option on a bond
B. A portfolio of technology stocks
C. A stock in a market index
22. The total number of parameters that fully characterizes a multivariate normal
distribution for the returns on two stocks is:
A. 3.
B. 4.
C. 5.
23. A portfolio has an expected mean return of 8% and standard deviation of 14%.
The probability that its return falls between 8% and 11% is closest to:
A. 8.5%.
B. 14.8%.
C. 58.3%.
24. A portfolio has an expected return of 7%, with a standard deviation of 13%. For
an investor with a minimum annual return target of 4%, the probability that the
portfolio return will fail to meet the target is closest to:
A. 33%.
B. 41%.
C. 59%.
25. Which parameter equals zero in a normal distribution?
A. Kurtosis
© CFA Institute. For candidate use only. Not for distribution.
- 31. Practice Problems 293
B. Skewness
C. Standard deviation
26. An analyst develops the following capital market projections.
Stocks Bonds
Mean Return 10% 2%
Standard Deviation 15% 5%
Assuming the returns of the asset classes are described by normal distributions,
which of the following statements is correct?
A. Bonds have a higher probability of a negative return than stocks.
B. On average, 99% of stock returns will fall within two standard deviations of
the mean.
C. The probability of a bond return less than or equal to 3% is determined
using a Z-score of 0.25.
27. A client has a portfolio of common stocks and fixed-income instruments with a
current value of £1,350,000. She intends to liquidate £50,000 from the portfolio
at the end of the year to purchase a partnership share in a business. Further-
more, the client would like to be able to withdraw the £50,000 without reducing
the initial capital of £1,350,000. The following table shows four alternative asset
allocations.
Mean and Standard Deviation for Four Allocations (in
Percent)
A B C D
Expected annual return 16 12 10 9
Standard deviation of return 24 17 12 11
Address the following questions (assume normality for Parts B and C):
A. Given the client’s desire not to invade the £1,350,000 principal, what is the
shortfall level, RL? Use this shortfall level to answer Part B.
B. According to the safety-first criterion, which of the allocations is the best?
C. What is the probability that the return on the safety-first optimal portfolio
will be less than the shortfall level, RL?
28. A client holding a £2,000,000 portfolio wants to withdraw £90,000 in one year
without invading the principal. According to Roy’s safety-first criterion, which of
the following portfolio allocations is optimal?
Allocation A Allocation B Allocation C
Expected annual return 6.5% 7.5% 8.5%
© CFA Institute. For candidate use only. Not for distribution.
- 32. Learning Module 4 Common Probability Distributions
294
Allocation A Allocation B Allocation C
Standard deviation of returns 8.35% 10.21% 14.34%
A. Allocation A
B. Allocation B
C. Allocation C
29. The weekly closing prices of Mordice Corporation shares are as follows:
Date Closing Price (€)
1 August 112
8 August 160
15 August 120
The continuously compounded return of Mordice Corporation shares for the
period August 1 to August 15 is closest to:
A. 6.90%.
B. 7.14%.
C. 8.95%.
30. In contrast to normal distributions, lognormal distributions:
A. are skewed to the left.
B. have outcomes that cannot be negative.
C. are more suitable for describing asset returns than asset prices.
31. The lognormal distribution is a more accurate model for the distribution of stock
prices than the normal distribution because stock prices are:
A. symmetrical.
B. unbounded.
C. non-negative.
32. The price of a stock at t = 0 is $208.25 and at t = 1 is $186.75. The continuously
compounded rate of return for the stock from t = 0 to t = 1 is closest to:
A. –10.90%.
B. –10.32%.
C. 11.51%.
33. Which one of the following statements about Student’s t-distribution is false?
A. It is symmetrically distributed around its mean value, like the normal
distribution.
B. It has shorter (i.e., thinner) tails than the normal distribution.
© CFA Institute. For candidate use only. Not for distribution.
- 33. Practice Problems 295
C. As its degrees of freedom increase, Student’s t-distribution approaches the
normal distribution.
34. Which one of the following statements concerning chi-square and F-distributions
is false?
A. They are both asymmetric distributions.
B. As their degrees of freedom increase, the shapes of their pdfs become more
bell curve–like.
C. The domains of their pdfs are positive and negative numbers.
35.
A. Define Monte Carlo simulation, and explain its use in investment
management.
B. Compared with analytical methods, what are the strengths and weaknesses
of Monte Carlo simulation for use in valuing securities?
36. A Monte Carlo simulation can be used to:
A. directly provide precise valuations of call options.
B. simulate a process from historical records of returns.
C. test the sensitivity of a model to changes in assumptions—for example, on
distributions of key variables.
37. A limitation of Monte Carlo simulation is:
A. its failure to do “what if” analysis.
B. that it requires historical records of returns.
C. its inability to independently specify cause-and-effect relationships.
© CFA Institute. For candidate use only. Not for distribution.
- 34. Learning Module 5 Sampling and Estimation
344
PRACTICE PROBLEMS
1. Perkiomen Kinzua, a seasoned auditor, is auditing last year’s transactions for
Conemaugh Corporation. Unfortunately, Conemaugh had a very large number
of transactions last year, and Kinzua is under a time constraint to finish the audit.
He decides to audit only the small subset of the transaction population that is of
interest and to use sampling to create that subset.
The most appropriate sampling method for Kinzua to use is:
A. judgmental sampling.
B. systematic sampling.
C. convenience sampling.
2. Which one of the following statements is true about non-probability sampling?
A. There is significant risk that the sample is not representative of the
population.
B. Every member of the population has an equal chance of being selected for
the sample.
C. Using judgment guarantees that population subdivisions of interest are rep-
resented in the sample.
3. The best approach for creating a stratified random sample of a population in-
volves:
A. drawing an equal number of simple random samples from each
subpopulation.
B. selecting every kth member of the population until the desired sample size
is reached.
C. drawing simple random samples from each subpopulation in sizes propor-
tional to the relative size of each subpopulation.
4. Although he knows security returns are not independent, a colleague makes
the claim that because of the central limit theorem, if we diversify across a large
number of investments, the portfolio standard deviation will eventually approach
zero as n becomes large. Is he correct?
5. Why is the central limit theorem important?
6. What is wrong with the following statement of the central limit theorem?
Central Limit Theorem. “If the random variables X1, X2, X3, …, Xn are a ran-
dom sample of size n from any distribution with finite mean μ and variance
σ2, then the distribution of
_
X
will be approximately normal, with a standard
deviation of
σ/
√
_
n
.”
7. Peter Biggs wants to know how growth managers performed last year. Biggs as-
sumes that the population cross-sectional standard deviation of growth manager
© CFA Institute. For candidate use only. Not for distribution.
- 35. Practice Problems 345
returns is 6% and that the returns are independent across managers.
A. How large a random sample does Biggs need if he wants the standard devia-
tion of the sample means to be 1%?
B. How large a random sample does Biggs need if he wants the standard devia-
tion of the sample means to be 0.25%?
8. A population has a non-normal distribution with mean µ and variance σ2. The
sampling distribution of the sample mean computed from samples of large size
from that population will have:
A. the same distribution as the population distribution.
B. its mean approximately equal to the population mean.
C. its variance approximately equal to the population variance.
9. A sample mean is computed from a population with a variance of 2.45. The sam-
ple size is 40. The standard error of the sample mean is closest to:
A. 0.039.
B. 0.247.
C. 0.387.
10. An estimator with an expected value equal to the parameter that it is intended to
estimate is described as:
A. efficient.
B. unbiased.
C. consistent.
11. If an estimator is consistent, an increase in sample size will increase the:
A. accuracy of estimates.
B. efficiency of the estimator.
C. unbiasedness of the estimator.
12. Petra Munzi wants to know how value managers performed last year. Munzi es-
timates that the population cross-sectional standard deviation of value manager
returns is 4% and assumes that the returns are independent across managers.
A. Munzi wants to build a 95% confidence interval for the population mean
return. How large a random sample does Munzi need if she wants the 95%
confidence interval to have a total width of 1%?
B. Munzi expects a cost of about $10 to collect each observation. If she has
a $1,000 budget, will she be able to construct the confidence interval she
wants?
13. Find the reliability factors based on the t-distribution for the following confi-
dence intervals for the population mean (df = degrees of freedom, n = sample
size):
A. A 99% confidence interval, df = 20
© CFA Institute. For candidate use only. Not for distribution.
- 36. Learning Module 5 Sampling and Estimation
346
B. A 90% confidence interval, df = 20
C. A 95% confidence interval, n = 25
D. A 95% confidence interval, n = 16
14. Assume that monthly returns are normally distributed with a mean of 1% and a
sample standard deviation of 4%. The population standard deviation is unknown.
Construct a 95% confidence interval for the sample mean of monthly returns if
the sample size is 24.
15. Explain the differences between constructing a confidence interval when sam-
pling from a normal population with a known population variance and sampling
from a normal population with an unknown variance.
16. For a two-sided confidence interval, an increase in the degree of confidence will
result in:
A. a wider confidence interval.
B. a narrower confidence interval.
C. no change in the width of the confidence interval.
17. For a sample size of 17, with a mean of 116.23 and a variance of 245.55, the width
of a 90% confidence interval using the appropriate t-distribution is closest to:
A. 13.23.
B. 13.27.
C. 13.68.
18. For a sample size of 65 with a mean of 31 taken from a normally distributed pop-
ulation with a variance of 529, a 99% confidence interval for the population mean
will have a lower limit closest to:
A. 23.64.
B. 25.41.
C. 30.09.
19. An increase in sample size is most likely to result in a:
A. wider confidence interval.
B. decrease in the standard error of the sample mean.
C. lower likelihood of sampling from more than one population.
20. Otema Chi has a spreadsheet with 108 monthly returns for shares in Marunou
Corporation. He writes a software program that uses bootstrap resampling to
create 200 resamples of this Marunou data by sampling with replacement. Each
resample has 108 data points. Chi’s program calculates the mean of each of the
200 resamples, and then it calculates that the mean of these 200 resample means
is 0.0261. The program subtracts 0.0261 from each of the 200 resample means,
squares each of these 200 differences, and adds the squared differences together.
The result is 0.835. The program then calculates an estimate of the standard error
© CFA Institute. For candidate use only. Not for distribution.
- 37. Practice Problems 347
of the sample mean.
The estimated standard error of the sample mean is closest to:
A. 0.0115
B. 0.0648
C. 0.0883
21. Compared with bootstrap resampling, jackknife resampling:
A. is done with replacement.
B. usually requires that the number of repetitions is equal to the sample size.
C. produces dissimilar results for every run because resamples are randomly
drawn.
22. Suppose we take a random sample of 30 companies in an industry with 200
companies. We calculate the sample mean of the ratio of cash flow to total debt
for the prior year. We find that this ratio is 23%. Subsequently, we learn that the
population cash flow to total debt ratio (taking account of all 200 companies) is
26%. What is the explanation for the discrepancy between the sample mean of
23% and the population mean of 26%?
A. Sampling error.
B. Bias.
C. A lack of consistency.
23. Alcorn Mutual Funds is placing large advertisements in several financial publi-
cations. The advertisements prominently display the returns of 5 of Alcorn’s 30
funds for the past 1-, 3-, 5-, and 10-year periods. The results are indeed impres-
sive, with all of the funds beating the major market indexes and a few beating
them by a large margin. Is the Alcorn family of funds superior to its competitors?
24. Julius Spence has tested several predictive models in order to identify un-
dervalued stocks. Spence used about 30 company-specific variables and 10
market-related variables to predict returns for about 5,000 North American
and European stocks. He found that a final model using eight variables applied
to telecommunications and computer stocks yields spectacular results. Spence
wants you to use the model to select investments. Should you? What steps would
you take to evaluate the model?
25. A report on long-term stock returns focused exclusively on all currently publicly
traded firms in an industry is most likely susceptible to:
A. look-ahead bias.
B. survivorship bias.
C. intergenerational data mining.
26. Which sampling bias is most likely investigated with an out-of-sample test?
A. Look-ahead bias
B. Data-mining bias
© CFA Institute. For candidate use only. Not for distribution.
- 38. Learning Module 5 Sampling and Estimation
348
C. Sample selection bias
27. Which of the following characteristics of an investment study most likely indi-
cates time-period bias?
A. The study is based on a short time-series.
B. Information not available on the test date is used.
C. A structural change occurred prior to the start of the study’s time series.
© CFA Institute. For candidate use only. Not for distribution.
- 39. Learning Module 6 Hypothesis Testing
408
PRACTICE PROBLEMS
1. Which of the following statements about hypothesis testing is correct?
A. The null hypothesis is the condition a researcher hopes to support.
B. The alternative hypothesis is the proposition considered true without con-
clusive evidence to the contrary.
C. The alternative hypothesis exhausts all potential parameter values not
accounted for by the null hypothesis.
2. Willco is a manufacturer in a mature cyclical industry. During the most recent
industry cycle, its net income averaged $30 million per year with a standard
deviation of $10 million (n = 6 observations). Management claims that Willco’s
performance during the most recent cycle results from new approaches and that
Willco’s profitability will exceed the $24 million per year observed in prior cycles.
A. With μ as the population value of mean annual net income, formulate null
and alternative hypotheses consistent with testing Willco management’s
claim.
B. Assuming that Willco’s net income is at least approximately normally dis-
tributed, identify the appropriate test statistic and calculate the degrees of
freedom.
C. Based on critical value of 2.015, determine whether to reject the null
hypothesis.
3. Which of the following statements is correct with respect to the null hypothesis?
A. It can be stated as “not equal to” provided the alternative hypothesis is
stated as “equal to.”
B. Along with the alternative hypothesis, it considers all possible values of the
population parameter.
C. In a two-tailed test, it is rejected when evidence supports equality between
the hypothesized value and the population parameter.
4. Which of the following statements regarding a one-tailed hypothesis test is cor-
rect?
A. The rejection region increases in size as the level of significance becomes
smaller.
B. A one-tailed test more strongly reflects the beliefs of the researcher than a
two-tailed test.
C. The absolute value of the rejection point is larger than that of a two-tailed
test at the same level of significance.
5. A hypothesis test for a normally distributed population at a 0.05 significance level
implies a:
A. 95% probability of rejecting a true null hypothesis.
B. 95% probability of a Type I error for a two-tailed test.
© CFA Institute. For candidate use only. Not for distribution.
- 40. Practice Problems 409
C. 5% critical value rejection region in a tail of the distribution for a one-tailed
test.
6. The value of a test statistic is best described as the basis for deciding whether to:
A. reject the null hypothesis.
B. accept the null hypothesis.
C. reject the alternative hypothesis.
7. Which of the following is a Type I error?
A. Rejecting a true null hypothesis
B. Rejecting a false null hypothesis
C. Failing to reject a false null hypothesis
8. A Type II error is best described as:
A. rejecting a true null hypothesis.
B. failing to reject a false null hypothesis.
C. failing to reject a false alternative hypothesis.
9. The level of significance of a hypothesis test is best used to:
A. calculate the test statistic.
B. define the test’s rejection points.
C. specify the probability of a Type II error.
10. All else equal, is specifying a smaller significance level in a hypothesis test likely
to increase the probability of a:
Type I error? Type II error?
A. No No
B. No Yes
C. Yes No
11. The probability of correctly rejecting the null hypothesis is the:
A. p-value.
B. power of a test.
C. level of significance.
12. The power of a hypothesis test is:
A. equivalent to the level of significance.
B. the probability of not making a Type II error.
C. unchanged by increasing a small sample size.
13. For each of the following hypothesis tests concerning the population mean, μ,
© CFA Institute. For candidate use only. Not for distribution.
- 41. Learning Module 6 Hypothesis Testing
410
state the conclusion regarding the test of the hypotheses.
A. H0: μ = 10 versus Ha: μ ≠ 10, with a calculated t-statistic of 2.05 and critical
t-values of ±1.984.
B. H0: μ ≤ 10 versus Ha: μ > 10, with a calculated t-statistic of 2.35 and a criti-
cal t-value of +1.679
C. H0: μ = 10 versus Ha: μ ≠ 10, with a calculated t-statistic of 2.05, a p-value of
4.6352%, and a level of significance of 5%.
D. H0: μ ≤ 10 versus Ha: μ > 10, with a 2% level of significance and a calculated
test statistic with a p-value of 3%.
14. In the step “stating a decision rule” in testing a hypothesis, which of the following
elements must be specified?
A. Critical value
B. Power of a test
C. Value of a test statistic
15. When making a decision about investments involving a statistically significant
result, the:
A. economic result should be presumed to be meaningful.
B. statistical result should take priority over economic considerations.
C. economic logic for the future relevance of the result should be further
explored.
16. An analyst tests the profitability of a trading strategy with the null hypothesis
that the average abnormal return before trading costs equals zero. The calculat-
ed t-statistic is 2.802, with critical values of ±2.756 at significance level α = 0.01.
After considering trading costs, the strategy’s return is near zero. The results are
most likely:
A. statistically but not economically significant.
B. economically but not statistically significant.
C. neither statistically nor economically significant.
17. Which of the following statements is correct with respect to the p-value?
A. It is a less precise measure of test evidence than rejection points.
B. It is the largest level of significance at which the null hypothesis is rejected.
C. It can be compared directly with the level of significance in reaching test
conclusions.
18. Which of the following represents a correct statement about the p-value?
A. The p-value offers less precise information than does the rejection points
approach.
B. A larger p-value provides stronger evidence in support of the alternative
hypothesis.
© CFA Institute. For candidate use only. Not for distribution.
- 42. Practice Problems 411
C. A p-value less than the specified level of significance leads to rejection of the
null hypothesis.
19. Which of the following statements on p-value is correct?
A. The p-value indicates the probability of making a Type II error.
B. The lower the p-value, the weaker the evidence for rejecting the H0.
C. The p-value is the smallest level of significance at which H0 can be rejected.
20. The following table shows the significance level (α) and the p-value for two hy-
pothesis tests.
α p-Value
Test 1 0.02 0.05
Test 2 0.05 0.02
In which test should we reject the null hypothesis?
A. Test 1 only
B. Test 2 only
C. Both Test 1 and Test 2
21. Identify the appropriate test statistic or statistics for conducting the following hy-
pothesis tests. (Clearly identify the test statistic and, if applicable, the number of
degrees of freedom. For example, “We conduct the test using an x-statistic with y
degrees of freedom.”)
A. H0: μ = 0 versus Ha: μ ≠ 0, where μ is the mean of a normally distributed
population with unknown variance. The test is based on a sample of 15
observations.
B. H0: μ = 5 versus Ha: μ ≠ 5, where μ is the mean of a normally distributed
population with unknown variance. The test is based on a sample of 40
observations.
C. H0: μ ≤ 0 versus Ha: μ > 0, where μ is the mean of a normally distributed
population with known variance σ2. The sample size is 45.
D. H0: σ2 = 200 versus Ha: σ2 ≠ 200, where σ2 is the variance of a normally
distributed population. The sample size is 50.
E.
H
0
:
σ
1
2 =
σ
2
2 versus
H
a
:
σ
1
2 ≠
σ
2
2
, where
σ
1
2
is the variance of one normally
distributed population and
σ
2
2
is the variance of a second normally distrib-
uted population. The test is based on two independent samples, with the
first sample of size 30 and the second sample of size 40.
F. H0: μ1 − μ2 = 0 versus Ha: μ1 − μ2 ≠ 0, where the samples are drawn from
normally distributed populations with unknown but assumed equal vari-
ances. The observations in the two samples (of size 25 and 30, respectively)
are independent.
22. For each of the following hypothesis tests concerning the population mean, state
the conclusion.
© CFA Institute. For candidate use only. Not for distribution.
- 43. Learning Module 6 Hypothesis Testing
412
A. H0: σ2 = 0.10 versus Ha: σ2 ≠ 0.10, with a calculated chi-square test statistic
of 45.8 and critical chi-square values of 42.950 and 86.830.
B. H0: σ2 = 0.10 versus Ha: σ2 ≠ 0.10, with a 5% level of significance and a
p-value for this calculated chi-square test statistic of 4.463%.
C. H0: σ1
2 = σ2
2 versus Ha: σ1
2 ≠ σ2
2, with a calculated F-statistic of 2.3. With
40 and 30 degrees of freedom, the critical F-values are 0.498 and 1.943.
D. H0: σ2 ≤ 10 versus Ha: μσ2 > 10, with a calculated test statistic of 32 and a
critical chi-square value of 26.296.
The following information relates to questions
23-24
Performance in Forecasting Quarterly Earnings per Share
Number of
Forecasts
Mean Forecast Error
(Predicted − Actual)
Standard Deviation of
Forecast Errors
Analyst A 10 0.05 0.10
Analyst B 15 0.02 0.09
Critical t-values:
Area in the Right-Side Rejection Area
Degrees of Freedom p = 0.05 p = 0.025
8 1.860 2.306
9 1.833 2.262
10 1.812 2.228
11 1.796 2.201
12 1.782 2.179
13 1.771 2.160
14 1.761 2.145
15 1.753 2.131
16 1.746 2.120
17 1.740 2.110
18 1.734 2.101
19 1.729 2.093
20 1.725 2.086
21 1.721 2.080
22 1.717 2.074
23 1.714 2.069
24 1.711 2.064
25 1.708 2.060
26 1.706 2.056
27 1.703 2.052
© CFA Institute. For candidate use only. Not for distribution.
- 44. Practice Problems 413
23. Investment analysts often use earnings per share (EPS) forecasts. One test of
forecasting quality is the zero-mean test, which states that optimal forecasts
should have a mean forecasting error of zero. The forecasting error is the differ-
ence between the predicted value of a variable and the actual value of the vari-
able.
You have collected data (shown in the previous table) for two analysts who cover
two different industries: Analyst A covers the telecom industry; Analyst B covers
automotive parts and suppliers.
A. With μ as the population mean forecasting error, formulate null and alterna-
tive hypotheses for a zero-mean test of forecasting quality.
B. For Analyst A, determine whether to reject the null at the 0.05 level of
significance.
C. For Analyst B, determine whether to reject the null at the 0.05 level of
significance.
24. Reviewing the EPS forecasting performance data for Analysts A and B, you want
to investigate whether the larger average forecast errors of Analyst A relative to
Analyst B are due to chance or to a higher underlying mean value for Analyst A.
Assume that the forecast errors of both analysts are normally distributed and that
the samples are independent.
A. Formulate null and alternative hypotheses consistent with determining
whether the population mean value of Analyst A’s forecast errors (μ1) are
larger than Analyst B’s (μ2).
B. Identify the test statistic for conducting a test of the null hypothesis formu-
lated in Part A.
C. Identify the rejection point or points for the hypotheses tested in Part A at
the 0.05 level of significance.
D. Determine whether to reject the null hypothesis at the 0.05 level of
significance.
25. An analyst is examining a large sample with an unknown population variance.
Which of the following is the most appropriate test to test the hypothesis that the
historical average return on an index is less than or equal to 6%?
A. One-sided t-test
B. Two-sided t-test
C. One-sided chi-square test
26. Which of the following tests of a hypothesis concerning the population mean is
most appropriate?
A. A z-test if the population variance is unknown and the sample is small
B. A z-test if the population is normally distributed with a known variance
C. A t-test if the population is non-normally distributed with unknown vari-
ance and a small sample
27. For a small sample from a normally distributed population with unknown vari-
ance, the most appropriate test statistic for the mean is the:
© CFA Institute. For candidate use only. Not for distribution.
- 45. Learning Module 6 Hypothesis Testing
414
A. z-statistic.
B. t-statistic.
C. χ2 statistic.
28. An investment consultant conducts two independent random samples of
five-year performance data for US and European absolute return hedge funds.
Noting a return advantage of 50 bps for US managers, the consultant decides
to test whether the two means are different from one another at a 0.05 level of
significance. The two populations are assumed to be normally distributed with
unknown but equal variances. Results of the hypothesis test are contained in the
following tables.
Sample Size
Mean Return
(%) Standard Deviation
US managers 50 4.7 5.4
European managers 50 4.2 4.8
Null and alternative hypotheses H0: μUS − μE = 0; Ha: μUS − μE ≠ 0
Calculated test statistic 0.4893
Critical value rejection points ±1.984
The mean return for US funds is μUS, and μE is the mean return for European funds.
The results of the hypothesis test indicate that the:
A. null hypothesis is not rejected.
B. alternative hypothesis is statistically confirmed.
C. difference in mean returns is statistically different from zero.
29. A pooled estimator is used when testing a hypothesis concerning the:
A. equality of the variances of two normally distributed populations.
B. difference between the means of two at least approximately normally dis-
tributed populations with unknown but assumed equal variances.
C. difference between the means of two at least approximately normally dis-
tributed populations with unknown and assumed unequal variances.
30. The following table gives data on the monthly returns on the S&P 500 Index and
small-cap stocks for a 40-year period and provides statistics relating to their
mean differences. Further, the entire sample period is split into two subperiods of
20 years each, and the return data for these subperiods is also given in the table.
Measure
S&P 500 Return
(%)
Small-Cap
Stock Return
(%)
Differences
(S&P 500 − Small-Cap
Stock)
Entire sample period, 480 months
Mean 1.0542 1.3117 −0.258
Standard deviation 4.2185 5.9570 3.752
First subperiod, 240 months
Mean 0.6345 1.2741 −0.640
© CFA Institute. For candidate use only. Not for distribution.
- 46. Practice Problems 415
Measure
S&P 500 Return
(%)
Small-Cap
Stock Return
(%)
Differences
(S&P 500 − Small-Cap
Stock)
Standard deviation 4.0807 6.5829 4.096
Second subperiod, 240 months
Mean 1.4739 1.3492 0.125
Standard deviation 4.3197 5.2709 3.339
Use a significance level of 0.05 and assume that mean differences are approxi-
mately normally distributed.
A. Formulate null and alternative hypotheses consistent with testing whether
any difference exists between the mean returns on the S&P 500 and
small-cap stocks.
B. Determine whether to reject the null hypothesis for the entire sample period
if the critical values are ±1.96.
C. Determine whether to reject the null hypothesis for the first subperiod if the
critical values are ±1.96.
D. Determine whether to reject the null hypothesis for the second subperiod if
the critical values are ±1.96.
31. When evaluating mean differences between two dependent samples, the most
appropriate test is a:
A. z-test.
B. chi-square test.
C. paired comparisons test.
32. A chi-square test is most appropriate for tests concerning:
A. a single variance.
B. differences between two population means with variances assumed to be
equal.
C. differences between two population means with variances assumed to not
be equal.
33. During a 10-year period, the standard deviation of annual returns on a portfolio
you are analyzing was 15% a year. You want to see whether this record is suffi-
cient evidence to support the conclusion that the portfolio’s underlying variance
of return was less than 400, the return variance of the portfolio’s benchmark.
A. Formulate null and alternative hypotheses consistent with your objective.
B. Identify the test statistic for conducting a test of the hypotheses in Part A,
and calculate the degrees of freedom.
C. Determine whether the null hypothesis is rejected or not rejected at the 0.05
level of significance using a critical value of 3.325.
34. You are investigating whether the population variance of returns on an index
© CFA Institute. For candidate use only. Not for distribution.
- 47. Learning Module 6 Hypothesis Testing
416
changed subsequent to a market disruption. You gather the following data for 120
months of returns before the disruption and for 120 months of returns after the
disruption. You have specified a 0.05 level of significance.
Time Period n
Mean Monthly Return
(%) Variance of Returns
Before disruption 120 1.416 22.367
After disruption 120 1.436 15.795
A. Formulate null and alternative hypotheses consistent with the research goal.
B. Identify the test statistic for conducting a test of the hypotheses in Part A,
and calculate the degrees of freedom.
C. Determine whether to reject the null hypothesis at the 0.05 level of signifi-
cance if the critical values are 0.6969 and 1.4349.
35. Which of the following should be used to test the difference between the varianc-
es of two normally distributed populations?
A. t-test
B. F-test
C. Paired comparisons test
36. In which of the following situations would a nonparametric test of a hypothesis
most likely be used?
A. The sample data are ranked according to magnitude.
B. The sample data come from a normally distributed population.
C. The test validity depends on many assumptions about the nature of the
population.
37. An analyst is examining the monthly returns for two funds over one year. Both
funds’ returns are non-normally distributed. To test whether the mean return of
one fund is greater than the mean return of the other fund, the analyst can use:
A. a parametric test only.
B. a nonparametric test only.
C. both parametric and nonparametric tests.
38. The following table shows the sample correlations between the monthly returns
for four different mutual funds and the S&P 500. The correlations are based on 36
monthly observations. The funds are as follows:
Fund 1 Large-cap fund
Fund 2 Mid-cap fund
Fund 3 Large-cap value fund
Fund 4 Emerging market fund
S&P 500 US domestic stock index
© CFA Institute. For candidate use only. Not for distribution.
- 48. Practice Problems 417
Fund 1 Fund 2 Fund 3 Fund 4 S&P 500
Fund 1 1
Fund 2 0.9231 1
Fund 3 0.4771 0.4156 1
Fund 4 0.7111 0.7238 0.3102 1
S&P 500 0.8277 0.8223 0.5791 0.7515 1
Test the null hypothesis that each of these correlations, individually, is equal to
zero against the alternative hypothesis that it is not equal to zero. Use a 5% signif-
icance level and critical t-values of ±2.032.
39. You are interested in whether excess risk-adjusted return (alpha) is correlated
with mutual fund expense ratios for US large-cap growth funds. The following
table presents the sample.
Mutual Fund Alpha Expense Ratio
1 −0.52 1.34
2 −0.13 0.40
3 −0.50 1.90
4 −1.01 1.50
5 −0.26 1.35
6 −0.89 0.50
7 −0.42 1.00
8 −0.23 1.50
9 −0.60 1.45
A. Formulate null and alternative hypotheses consistent with the verbal
description of the research goal.
B. Identify and justify the test statistic for conducting a test of the hypotheses
in Part A.
C. Determine whether to reject the null hypothesis at the 0.05 level of signifi-
cance if the critical values are ±2.306.
40. Jill Batten is analyzing how the returns on the stock of Stellar Energy Corp. are
related with the previous month’s percentage change in the US Consumer Price
Index for Energy (CPIENG). Based on 248 observations, she has computed the
sample correlation between the Stellar and CPIENG variables to be −0.1452. She
also wants to determine whether the sample correlation is significantly different
from zero. The critical value for the test statistic at the 0.05 level of significance
is approximately 1.96. Batten should conclude that the statistical relationship
between Stellar and CPIENG is:
A. significant, because the calculated test statistic is outside the bounds of the
critical values for the test statistic.
B. significant, because the calculated test statistic has a lower absolute value
than the critical value for the test statistic.
C. insignificant, because the calculated test statistic is outside the bounds of
the critical values for the test statistic.
© CFA Institute. For candidate use only. Not for distribution.
- 49. Learning Module 6 Hypothesis Testing
418
41. An analyst group follows 250 firms and classifies them in two dimensions. First,
they use dividend payment history and earnings forecasts to classify firms into
one of three groups, with 1 indicating the dividend stars and 3 the dividend
laggards. Second, they classify firms on the basis of financial leverage, using debt
ratios, debt features, and corporate governance to classify the firms into three
groups, with 1 indicating the least risky firms based on financial leverage and 3
indicating the riskiest. The classification of the 250 firms is as follows:
Financial Leverage
Group
Dividend Group
1 2 3
1 40 40 40
2 30 10 20
3 10 50 10
A. What are the null and alternative hypotheses to test whether the dividend
and financial leverage groups are independent of one another?
B. What is the appropriate test statistic to use in this type of test?
C. If the critical value for the 0.05 level of significance is 9.4877, what is your
conclusion?
42. Which of the following statements is correct regarding the chi-square test of
independence?
A. The test has a one-sided rejection region.
B. The null hypothesis is that the two groups are dependent.
C. If there are two categories, each with three levels or groups, there are six
degrees of freedom.
© CFA Institute. For candidate use only. Not for distribution.
- 50. Learning Module 7 Introduction to Linear Regression
474
PRACTICE PROBLEMS
1. Homoskedasticity is best described as the situation in which the variance of the
residuals of a regression is:
A. zero.
B. normally distributed.
C. constant across observations.
2. Julie Moon is an energy analyst examining electricity, oil, and natural gas con-
sumption in different regions over different seasons. She ran a simple regression
explaining the variation in energy consumption as a function of temperature. The
total variation of the dependent variable was 140.58, and the explained variation
was 60.16. She had 60 monthly observations.
A. Calculate the coefficient of determination.
B. Calculate the F-statistic to test the fit of the model.
C. Calculate the standard error of the estimate of the regression estimation.
D. Calculate the sample standard deviation of monthly energy consumption.
3. An economist collected the monthly returns for KDL’s portfolio and a diversified
stock index. The data collected are shown in the following table:
Month Portfolio Return (%) Index Return (%)
1 1.11 −0.59
2 72.10 64.90
3 5.12 4.81
4 1.01 1.68
5 −1.72 −4.97
6 4.06 −2.06
The economist calculated the correlation between the two returns and found it
to be 0.996. The regression results with the KDL return as the dependent variable
and the index return as the independent variable are given as follows:
Regression Statistics
R2 0.9921
Standard error 2.8619
Observations 6
Source df
Sum of
Squares
Mean
Square F p-Value
Regression 1 4,101.6205 4,101.6205 500.7921 0.0000
Residual 4 32.7611 8.1903
Total 5 4,134.3815
© CFA Institute. For candidate use only. Not for distribution.
- 51. Practice Problems 475
Coefficients Standard Error t-Statistic p-Value
Intercept 2.2521 1.2739 1.7679 0.1518
Index return (%) 1.0690 0.0478 22.3784 0.0000
When reviewing the results, Andrea Fusilier suspected that they were unreliable.
She found that the returns for Month 2 should have been 7.21% and 6.49%, in-
stead of the large values shown in the first table. Correcting these values resulted
in a revised correlation of 0.824 and the following revised regression results:
Regression Statistics
R2 0.6784
Standard error 2.0624
Observations 6
Source df
Sum of
Squares
Mean
Square F p-Value
Regression 1 35.8950 35.8950 8.4391 0.044
Residual 4 17.0137 4.2534
Total 5 52.91
Coefficients Standard Error t-Statistic p-Value
Intercept 2.2421 0.8635 2.5966 0.060
Slope 0.6217 0.2143 2.9050 0.044
Explain how the bad data affected the results.
The following information relates to questions
4-7
An analyst is examining the annual growth of the money supply for a country
over the past 30 years. This country experienced a central bank policy shift 15
years ago, which altered the approach to the management of the money supply.
The analyst estimated a model using the annual growth rate in the money supply
regressed on the variable (SHIFT) that takes on a value of 0 before the policy shift
and 1 after. She estimated the following:
Coefficients Standard Error t-Stat.
Intercept 5.767264 0.445229 12.95348
SHIFT −5.13912 0.629649 −8.16188
Critical t-values, level of significance of 0.05:
One-sided, left side: −1.701
One-sided, right side: +1.701
Two-sided: ±2.048
© CFA Institute. For candidate use only. Not for distribution.
- 52. Learning Module 7 Introduction to Linear Regression
476
4. The variable SHIFT is best described as:
A. an indicator variable.
B. a dependent variable.
C. a continuous variable.
5. The interpretation of the intercept is the mean of the annual growth rate of the
money supply:
A. over the enter entire period.
B. after the shift in policy.
C. before the shift in policy.
6. The interpretation of the slope is the:
A. change in the annual growth rate of the money supply per year.
B. average annual growth rate of the money supply after the shift in policy.
C. difference in the average annual growth rate of the money supply from
before to after the shift in policy.
7. Testing whether there is a change in the money supply growth after the shift in
policy, using a 0.05 level of significance, we conclude that there is:
A. sufficient evidence that the money supply growth changed.
B. not enough evidence that the money supply growth is different from zero.
C. not enough evidence to indicate that the money supply growth changed.
8. You are examining the results of a regression estimation that attempts to explain
the unit sales growth of a business you are researching. The analysis of variance
output for the regression is given in the following table. The regression was based
on five observations (n = 5).
Source df
Sum of
Squares
Mean
Square F p-Value
Regression 1 88.0 88.0 36.667 0.00904
Residual 3 7.2 2.4
Total 4 95.2
A. Calculate the sample variance of the dependent variable using information
in the table.
B. Calculate the coefficient of determination for this estimated model.
C. What hypothesis does the F-statistic test?
D. Is the F-test significant at the 0.05 significance level?
E. Calculate the standard error of the estimate.
© CFA Institute. For candidate use only. Not for distribution.
- 53. Practice Problems 477
The following information relates to questions
9-12
Kenneth McCoin, CFA, is a challenging interviewer. Last year, he handed each
job applicant a sheet of paper with the information in the following table, and
he then asked several questions about regression analysis. Some of McCoin’s
questions, along with a sample of the answers he received to each, are given
below. McCoin told the applicants that the independent variable is the ratio of
net income to sales for restaurants with a market cap of more than $100 million
and the dependent variable is the ratio of cash flow from operations to sales for
those restaurants. Which of the choices provided is the best answer to each of
McCoin’s questions?
Regression Statistics
R2 0.7436
Standard error 0.0213
Observations 24
Source df
Sum of
Squares
Mean
Square F p-Value
Regression 1 0.029 0.029000 63.81 0
Residual 22 0.010 0.000455
Total 23 0.040
Coefficients Standard Error t-Statistic p-Value
Intercept 0.077 0.007 11.328 0
Net income to
sales (%)
0.826 0.103 7.988 0
9. The coefficient of determination is closest to:
A. 0.7436.
B. 0.8261.
C. 0.8623.
10. The correlation between X and Y is closest to:
A. −0.7436.
B. 0.7436.
C. 0.8623.
11. If the ratio of net income to sales for a restaurant is 5%, the predicted ratio of
cash flow from operations (CFO) to sales is closest to:
A. −4.054.
B. 0.524.
C. 4.207.
© CFA Institute. For candidate use only. Not for distribution.
- 54. Learning Module 7 Introduction to Linear Regression
478
12. Is the relationship between the ratio of cash flow to operations and the ratio of
net income to sales significant at the 0.05 level?
A. No, because the R2 is greater than 0.05
B. No, because the p-values of the intercept and slope are less than 0.05
C. Yes, because the p-values for F and t for the slope coefficient are less than
0.05
The following information relates to questions
13-17
Howard Golub, CFA, is preparing to write a research report on Stellar Energy
Corp. common stock. One of the world’s largest companies, Stellar is in the
business of refining and marketing oil. As part of his analysis, Golub wants to
evaluate the sensitivity of the stock’s returns to various economic factors. For
example, a client recently asked Golub whether the price of Stellar Energy Corp.
stock has tended to rise following increases in retail energy prices. Golub believes
the association between the two variables is negative, but he does not know the
strength of the association.
Golub directs his assistant, Jill Batten, to study the relationships between (1)
Stellar monthly common stock returns and the previous month’s percentage
change in the US Consumer Price Index for Energy (CPIENG) and (2) Stellar
monthly common stock returns and the previous month’s percentage change in
the US Producer Price Index for Crude Energy Materials (PPICEM). Golub wants
Batten to run both a correlation and a linear regression analysis. In response,
Batten compiles the summary statistics shown in Exhibit 1 for 248 months. All
the data are in decimal form, where 0.01 indicates a 1% return. Batten also runs
a regression analysis using Stellar monthly returns as the dependent variable and
the monthly change in CPIENG as the independent variable. Exhibit 2 displays
the results of this regression model.
Exhibit 1: Descriptive Statistics
Stellar Common
Stock Monthly Return
Lagged Monthly Change
CPIENG PPICEM
Mean 0.0123 0.0023 0.0042
Standard deviation 0.0717 0.0160 0.0534
Covariance, Stellar vs. CPIENG −0.00017
Covariance, Stellar vs. PPICEM −0.00048
Covariance, CPIENG vs. PPICEM 0.00044
© CFA Institute. For candidate use only. Not for distribution.
- 55. Practice Problems 479
Stellar Common
Stock Monthly Return
Lagged Monthly Change
CPIENG PPICEM
Correlation, Stellar vs. CPIENG −0.1452
Exhibit 2: Regression Analysis with CPIENG
Regression Statistics
R2 0.0211
Standard error of the estimate 0.0710
Observations 248
Coefficients Standard Error t-Statistic
Intercept 0.0138 0.0046 3.0275
CPIENG (%) −0.6486 0.2818 −2.3014
Critical t-values
One-sided, left side: −1.651
One-sided, right side: +1.651
Two-sided: ±1.967
13. Which of the following best describes Batten’s regression?
A. Time-series regression
B. Cross-sectional regression
C. Time-series and cross-sectional regression
14. Based on the regression, if the CPIENG decreases by 1.0%, the expected return
on Stellar common stock during the next period is closest to:
A. 0.0073 (0.73%).
B. 0.0138 (1.38%).
C. 0.0203 (2.03%).
15. Based on Batten’s regression model, the coefficient of determination indicates
that:
A. Stellar’s returns explain 2.11% of the variability in CPIENG.
B. Stellar’s returns explain 14.52% of the variability in CPIENG.
C. changes in CPIENG explain 2.11% of the variability in Stellar’s returns.
16. For Batten’s regression model, 0.0710 is the standard deviation of:
A. the dependent variable.
B. the residuals from the regression.
C. the predicted dependent variable from the regression.
© CFA Institute. For candidate use only. Not for distribution.
- 56. Learning Module 7 Introduction to Linear Regression
480
17. For the analysis run by Batten, which of the following is an incorrect conclusion
from the regression output?
A. The estimated intercept from Batten’s regression is statistically different
from zero at the 0.05 level of significance.
B. In the month after the CPIENG declines, Stellar’s common stock is expected
to exhibit a positive return.
C. Viewed in combination, the slope and intercept coefficients from Batten’s
regression are not statistically different from zero at the 0.05 level of
significance.
The following information relates to questions
18-26
Anh Liu is an analyst researching whether a company’s debt burden affects inves-
tors’ decision to short the company’s stock. She calculates the short interest ratio
(the ratio of short interest to average daily share volume, expressed in days) for
50 companies as of the end of 2016 and compares this ratio with the companies’
debt ratio (the ratio of total liabilities to total assets, expressed in decimal form).
Liu provides a number of statistics in Exhibit 1. She also estimates a simple
regression to investigate the effect of the debt ratio on a company’s short inter-
est ratio. The results of this simple regression, including the analysis of variance
(ANOVA), are shown in Exhibit 2.
In addition to estimating a regression equation, Liu graphs the 50 observations
using a scatter plot, with the short interest ratio on the vertical axis and the debt
ratio on the horizontal axis.
Exhibit 1: Summary Statistics
Statistic
Debt Ratio
Xi
Short Interest Ratio
Yi
Sum 19.8550 192.3000
Sum of squared deviations
from the mean
∑
i=1
n
(
X
i
−
_
X
)
2
= 2.2225.
∑
i=1
n
(
Y
i
−
_
Y
)
2
= 412.2042.
Sum of cross-products of devi-
ations from the mean
∑
i=1
n
(
X
i
−
_
X
)
(
Y
i
−
_
Y
)
= −9.2430.
Exhibit 2: Regression of the Short Interest Ratio on the Debt Ratio
ANOVA
Degrees of
Freedom (df) Sum of Squares Mean Square
Regression 1 38.4404 38.4404
Residual 48 373.7638 7.7867
Total 49 412.2042
Regression Statistics
© CFA Institute. For candidate use only. Not for distribution.
- 57. Practice Problems 481
ANOVA
Degrees of
Freedom (df) Sum of Squares Mean Square
R2 0.0933
Standard error of
estimate
2.7905
Observations 50
Coefficients Standard Error t-Statistic
Intercept 5.4975 0.8416 6.5322
Debt ratio (%) −4.1589 1.8718 −2.2219
Critical t-values for a 0.05 level of significance:
One-sided, left side: −1.677
One-sided, right side: +1.677
Two-sided: ±2.011
Liu is considering three interpretations of these results for her report on the rela-
tionship between debt ratios and short interest ratios:
Interpretation 1 Companies’ higher debt ratios cause lower short interest
ratios.
Interpretation 2 Companies’ higher short interest ratios cause higher debt
ratios.
Interpretation 3 Companies with higher debt ratios tend to have lower short
interest ratios.
She is especially interested in using her estimation results to predict the short
interest ratio for MQD Corporation, which has a debt ratio of 0.40.
18. Based on Exhibits 1 and 2, if Liu were to graph the 50 observations, the scatter
plot summarizing this relation would be best described as:
A. horizontal.
B. upward sloping.
C. downward sloping.
19. Based on Exhibit 1, the sample covariance is closest to:
A. −9.2430.
B. −0.1886.
C. 8.4123.
20. Based on Exhibits 1 and 2, the correlation between the debt ratio and the short
interest ratio is closest to:
A. −0.3054.
B. 0.0933.
C. 0.3054.
© CFA Institute. For candidate use only. Not for distribution.
- 58. Learning Module 7 Introduction to Linear Regression
482
21. Which of the interpretations best describes Liu’s findings?
A. Interpretation 1
B. Interpretation 2
C. Interpretation 3
22. The dependent variable in Liu’s regression analysis is the:
A. intercept.
B. debt ratio.
C. short interest ratio.
23. Based on Exhibit 2, the degrees of freedom for the t-test of the slope coefficient
in this regression are:
A. 48.
B. 49.
C. 50.
24. Which of the following should Liu conclude from the results shown in Exhibit 2?
A. The average short interest ratio is 5.4975.
B. The estimated slope coefficient is different from zero at the 0.05 level of
significance.
C. The debt ratio explains 30.54% of the variation in the short interest ratio.
25. Based on Exhibit 2, the short interest ratio expected for MQD Corporation is
closest to:
A. 3.8339.
B. 5.4975.
C. 6.2462.
26. Based on Liu’s regression results in Exhibit 2, the F-statistic for testing whether
the slope coefficient is equal to zero is closest to:
A. −2.2219.
B. 3.5036.
C. 4.9367.
The following information relates to questions
27-31
Elena Vasileva recently joined EnergyInvest as a junior portfolio analyst. Vasile-
va’s supervisor asks her to evaluate a potential investment opportunity in Amtex,
a multinational oil and gas corporation based in the United States. Vasileva’s
© CFA Institute. For candidate use only. Not for distribution.
- 59. Practice Problems 483
supervisor suggests using regression analysis to examine the relation between
Amtex shares and returns on crude oil.
Vasileva notes the following assumptions of regression analysis:
Assumption 1 The error term is uncorrelated across observations.
Assumption 2 The variance of the error term is the same for all
observations.
Assumption 3 The dependent variable is normally distributed.
Vasileva runs a regression of Amtex share returns on crude oil returns using the
monthly data she collected. Selected data used in the regression are presented in
Exhibit 1, and selected regression output is presented in Exhibit 2. She uses a 1%
level of significance in all her tests.
Exhibit 1: Selected Data for Crude Oil Returns and Amtex Share Returns
Oil Return
(Xi)
Amtex Return
(Yi)
Cross-Product
(
X
i
−
_
X
)
(
Y
i
−
_
Y
)
Predicted
Amtex Return
ˆ
Y
i
Regression
Residual
Y
i
−
ˆ
Y
i
Squared Residual
(
Y
i
−
ˆ
Y
i
)
2
Month 1 −0.032000 0.033145 −0.000388 0.002011 −0.031134 0.000969
⋮ ⋮ ⋮ ⋮ ⋮ ⋮ ⋮
Month 36 0.028636 0.062334 0.002663 0.016282 −0.046053 0.002121
Sum 0.085598 0.071475
Average −0.018056 0.005293
Exhibit 2: Selected Regression Output, Dependent
Variable: Amtex Share Return
Coefficient Standard Error
Intercept 0.0095 0.0078
Oil return 0.2354 0.0760
Critical t-values for a 1% level of significance:
One-sided, left side: −2.441
One-sided, right side: +2.441
Two-sided: ±2.728
Vasileva expects the crude oil return next month, Month 37, to be −0.01. She
computes the standard error of the forecast to be 0.0469.
27. Which of Vasileva’s assumptions regarding regression analysis is incorrect?
A. Assumption 1
B. Assumption 2
C. Assumption 3
© CFA Institute. For candidate use only. Not for distribution.