Apidays New York 2024 - APIs in 2030: The Risk of Technological Sleepwalk by ...
Pie chart
1. PIE CHART
Fractions and percentages are used in pie charts. Say the following fractions and percentages and then illustrate them in pie charts.
INPUT
………………………………………………………………………………………………………..………………………………………………..
………………………………………………………………………………………………………..………………………………………………..
………………………………………………………………………………………………………..………………………………………………..
………………………………………………………………………………………………………..………………………………………………..
………………………………………………………………………………………………………..………………………………………………..
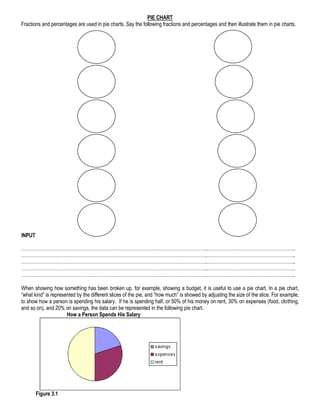
When showing how something has been broken up, for example, showing a budget, it is useful to use a pie chart. In a pie chart,
“what kind” is represented by the different slices of the pie, and “how much” is showed by adjusting the size of the slice. For example,
to show how a person is spending his salary. If he is spending half, or 50% of his money on rent, 30% on expenses (food, clothing,
and so on), and 20% on savings, the data can be represented in the following pie chart.
How a Person Spends His Salary
Figure 3.1
2. Notice how each slice of the pie is of a size that matches the proportion. “Rent” is half the pie, or 50%, while “expenses” is about a
third, which is near 30%, and “savings” is smaller than the other two. A legend next to the chart explains what is represented by the
different slices of the pie. However, there are some weaknesses in the chart represented. The actual values for each slice are not
labelled. One way to improve the situation is to include the percentages as part of the label. So a better chart is represented below.
Figure 3.2
In order to describe the amount in a pie chart, you need different ways to express them. Some vocabulary to describe amount are: a
tenth, a fifth, a quarter, a third, a half, and three quarters. However, fractions are not as clear as percentages such as 22%, 31%,
60% etc. You may also use expressions such as slightly more than a fifth, slightly less than a third, more than half, approximately,
close to and the vast majority. In other words, you can express information in a variety of ways so that you can vary your
expressions. Otherwise you will be repeating the same words too often.
How a Person Spends His Salary
expenses savings
30% 20%
savings
rent
expenses
rent
50%
Figure 3.3
ACTIVITIES
TASK 1
State whether the following sentences are true or false.
T F
1. The pie chart is one of the visual representations commonly used.
2. All visual representations have something in common and these qualities are used to influence viewer.
3. The pie chart is mainly used to show parts of a whole.
4. The main purpose of a legend is to show the percentages of each slice in a pie chart.
5. In the pie chart given, the proportion of expenses is slightly less than a third.
6. Rent takes up a fifth of the salary.
7. Savings is a quarter of the salary.
8. The parts that show “how much” describe the amount in a pie chart.
9. You can describe the amount in a pie chart in a variety of ways.
10. Slightly less than a third means approximately a third.
3. TASK 2
Complete the phrases to describe the pie charts by choosing one of the expressions in the box below.
majority slightly apart close slightly more than
1. In Chart A , ______________ to 45% of the business salaries had increased.
Chart A
Business Science
43% Science
57% Business
2. A large ___________ of the respondents were women in Chart B.
Chart B
Men
28%
Women Men
Women
72%
3. Chart C shows that _____________ over half of the students were engineering majors.
Chart C
Business Engineering
Engineering
46%
54% Business
4. 4. ____________from the 12% in Chart D, all the other workers received a raise.
Chart D
No Raise
12%
Raises
No Raise
Raises
88%
5. Chart E indicates __________________________ twice as many business students as there were liberal arts students.
Chart E
Liberal Arts
33%
Business
liberal Arts
Business
67%
TASK 3
The pie chart below shows the contents of the average Malaysian’s dustbin. Try to work out the missing words in the passage that
describe the chart.
Contents of the Average Malaysian's Dustbin
food
glass
plastic food
27% 18%
paper
glass
10%
metal cloth
7%
cloth paper metal
5% 33%
plastic
Figure 3.4
The pie chart reveals what the average Malaysian throws away. From the information shown, we can see that __________________
of the rubbish is paper waste, while plastic accounts for ____________ . Food waste is the next biggest category, accounting for
5. ____________________. Glass makes up ____________________ of the contents of the average Malaysian’s dustbin, and metal
and cloth make up the remaining percentage – 7% and 5% respectively.
TASK 4
The pie chart below shows the average way in which foreign students studying English in London spend their money. Describe the
information shown in the pie chart. You should write about 150 words.
Students' Spending
clothes
Rent
8%
subway 34% Rent
8%
school fees
entertainment
entertainment clothes
20%
subway
school fees
30%
Figure 3.5
SELF ASSESSMENT
A. Based on the pie chart below, choose the correct answers to the questions.
Percentage of Hours in a Day Spent on Activities
sleep
school
17%
job
8% 25%
8% 25% homework
17% meals
entertainment
1. A part of a pie chart that explains the colours that represent each part or slice of the chart is a
A. legend
B. grid
C. axis
2. These two activities took up half of the time of the day.
A. Entertainment and school
B. Meals and school
C. Sleep and school
3. These two activities took up the least amount of time.
6. A. Sleep and school
B. Meals and homework
C. Sleep and job
4. Which of these took up one fourth of the day?
A. Entertainment
B. Sleep
C. Homework
5. What percentage of the day does homework take up?
A. 2
B. 8
C. 25
6. Which of these take up the same amount of time as meals and entertainment together?
A. Job
B. School
C. Homework
B. Look at the pie chart below and describe orally the information shown.
The Ethnic Origins of the Pupils in a Class
Bangladeshi
20% White
White
Indian
40%
Pakistani Pakistani
17% Indian Bangladeshi
23%
Figure 3.7
7. FEEDBACK
A.
1. A 2. C 3. B 4. B 5. B 6. B
B.
The pie chart reveals the ethnic origins of the pupils in a class. The pupils in the class are classified into four different ethnic origins.
A fifth of the pupils in the classroom is Bangladeshi while Pakistani accounts for slightly less than a fifth. Indian makes up twenty-
three percent of the class population and White represents the biggest ethnic origin, accounting for forty percent.
ANSWER KEY
TASK 1
1. T 2. F 3. T 4. F 5. T
6. F 7. F 8. T 9. T 10. T
TASK 2
1. close 2. majority 3. slightly 4. apart 5. slightly more than
TASK 3
The pie chart reveals what the average Malaysian throws away. From the information shown, we can see that exactly a third of the
rubbish is waste, while plastic accounts for slightly more than a quarter. Food waste is the next biggest category, accounting for
slightly less than a fifth. Glass makes up a tenth of the contents of the average Malaysian’s dustbin, and metal and cloth make up the
remaining percentage – 7% and 5% respectively.
TASK 4
The pie chart reveals typical spending patterns of foreign students taking English Language courses in London. The average amount
spent can be divided very roughly into thirds – the first third being spent on rent, the second on school fees and the last divided
between entertainment, travel, clothes and study materials.
From the information shown, it can be seen that rent accounts for exactly a third of the total amount spent by students. This is the
biggest single expense for students in London. The second greatest expense is school fees, which is slightly less than a third.
Entertainment accounts for a fifth of the total spent by students in London, and the remaining money is used for travelling on the
subway and buying clothes which is 8% each.