
Recommended
Recommended
More Related Content
Similar to 354110-005-1Though TSGs performance in the first half.docx
Similar to 354110-005-1Though TSGs performance in the first half.docx (20)
More from tamicawaysmith
More from tamicawaysmith (20)
Recently uploaded
Recently uploaded (20)
354110-005-1Though TSGs performance in the first half.docx
- 1. 354 110-005-1 Though TSG's performance in the first half of fiscal 2009-10 was disappointing: the company believed that the demand for steel products was reviving. In the second quarter of financial year 2009-10, TSO reported higher deliveries of 6.22 million tonnes as compared to 5.34 million tonnes in the first quarter 0[2009·10, a growth of 17%. The company expected to utilize 100% capacity by the end of' March 2010. Murhurarnan said, "In October, the capacity utilization had touched 80%. It should be 85% by the end of November and 100 per cent by the end of this financial year, Demand is coming back.,,26 The operations of Tala Steel had been good since mid-200S backed by growth in rural construction and the auto and infrastructure sectors, Automobiles had been registering healthy sales since April 2008, helping in the revival of the steel sector to an extent. The Indian government's expenditure on infrastructure and rural development also favored the domestic steel sector. Banks had aggressively slashed lending rates to increase the credit off- take, which had helped the real estate and the auto sectors in India in 2009. Analysts estimated that steel consumption in India would grow by 5-6% in 2009 while production would grow by 4-5%. Tara Steel had expanded its
- 2. production capacities by 20% in the fiscal 2008~09. It planned to increase its market share with the expanded capacities. However, the global demand For steel, especially the demand from rbe developed nations, remained under pressure. Even though developed nations had deployed high amounts as stimulus packages, the scope for infrastructure development which required large volumes of steel, was low as they already had good infrastructure. The focus of the governments there was to increase consumption and employment. The auto sector in the US and the UK were ailing because of low demand and union related issues. Moreover, the auto companies in developed nations were facing challenges of high debts and had to cut down production significantly. However, TSG was optimistic about the future. It stated that the global steel demand was reviving as companies had started building inventories. However, it stated that it would take several years lor the consumption to reach the peak levels of2007. Moreover, analysts had revised their estimate of a decline in demand for steel in the calendar year 2009 to 8% in October 2009 from their previous estimate of a decline of 15% in April 2009. Going forward, industry analysts had mixed opinions about the future performance of TSG. According to Abhijeet Naik and Alok Rawat, Analysts at CLSA27 Asia-Pacific markets, "Tata Steel's aggressive cost-cutting measures in Europe will ensure that COTUS will emerge from the current downturn with a far-improved cost structure. While the
- 3. restructuring charges will keep FY I0 profits under pressure, we see a sharp profit recovery in FY II and FY 12.,,28 26 ~I~~f10~~~elSees Full Capacity Utilization at Corus on Demand Revival," http://.steelguru.com, November 27 Founded in [986, CLSA is a leading brokerage and investment group in Asia. It is headquartered in Hong Kong. 28 Sarish John, "Tata Steel Profit Falls; Revamp of Corus Working," www.livemillt.com.July 30, 2009. 12 TATA STEEL'S ACQUISITION OF CORUS (8) 110-005-1 Exhibit I Quarterly Performance of Tata Steel Group o11 Rs. Million) Quarter ended June 30 2009 2008 Net Sales/Income from Operations 231805.1 433745.2 Other Operating Income 11i8.0 1216.5 Total Income 232923.1 434961.7 Total Expenditure 244111.5 372655.9
- 4. Operating Profit (11188.4) 62305.8 Other Income 2039.0 526.9 Operating Profit before Net Finance (91494) 62832.7 Charges, Exceptional Items and tax Net Financing Charges 8818.9 8242.7 ProfiV(Loss) before exceptional items (17968.3) 54590.0 Exceptional Items (2187.6) (6513.9) Profit Before Tax (20155.9) 48076.1 Tax 2229.4 8929.9 Net Profit (22086.8) 39009.0 13 Source: www.tafos/eel.com. Exhibit U Top Ten Steel Producing Companies in the World Rank Production 2008 2007 Company 2008 2007 I I ArcelorMittal 101.6 116.4 2 2 Nippon Steel
- 5. 37.5 35.7 3 6 Baosteel Group 35.4 28.6 4 4 Hebei Steel Group 33.3 31.1 3 JFE 32.4 34 5 5 Posco 31.7 31.1 6 II Wuhan Steel Group 27.7 20.2 7 7 Tata Steel 24.4 26.5 8 Shandong Steel group 23.8 23.8 9 8 10 US Steel 23.2 21.5 10
- 6. Source: )1lWW. worfdslee/.org. 356 International Business Strateg~y ~ _ 110-005-1 Exhibit JI] Tata Steel Group - Income Statement (2007-09) (In Rs. Million) Financial Year Ending 2009 2008 2007 Sales of products and services 1,499,849.4 1,340,867.7 2,74,372.9 Less: Excise DUly (26,556.8) (25,531.4) (22,249.1) 1,473,292.6 1,315,336.3 2,52,123.8 Other Income 2,656.7 4,758.6 4,380.7 1,475,949.3 1,320,094.9 2,56,504.5 Manufacturing & other Expenses 1,299,846.6 1,142,989.6 1,81,158.3 Depreciation 42,653.9 41,369.5 10,109.8 1,342,500.5 1,184,359.1 19,126.81 Less-Expenditure(other then interest) transferred 7,830.7 5,477.6 3,536.0 to capital and other accounts
- 7. 1,33,466.98 1,178,881.5 1,87,732.1 Net Finance Charges 32,901.8 40,854.1 4,111.9 Total Expenditure 1,367,571.6 1,219,735.6 1,91,844.0 Profit Before taxes and exceptional items 1,08,377.7 1,00,359.3 64,660.5 Employee Separation Compensation . (1,530.3) Contribution for Sports Infrastructure . (1,500.0) . Exchange Gain/Loss . 5,782.9 .-. Actuarial Gainl (Loss) on funds for employee 59,068.4 benefits Restructuring, impairment and disposals (40,945.3) Profit Before Taxes 67,432.4 1,63,710.6 63,130.2 Taxes 18,940.0 40,493.0 21,474.1 Profit after taxes 48,492.4 1,23,217.6 41,656.1 Source. Tata Steel Annual Reports, 2008-09. 14 _______-------------------------T::A~T~A s~T~EE::l::'sACQUISITIONOfCORUs(8) 110-005-1 Exhibit IV Tata Steel Group - Balance Sbeet (2007-09)
- 8. n I IOn Financial Year Ending 2009 2008 2007 Sources of Funds Total Share Capital 62,027.8 62,026.3 7,270.6 Reserves & Surplus 2,15,115.0 2,79,713.5 1,38,951.4 Networth 2,77,142.8 3,41,739.8 1,46,222.0 Warrants issued by H subsidiary company - - 174.6 Minority interest - - 5,983.9 Secured Loans 3,43,292.6 3,54,149.9 49,612.3 Unsecured Loans 2,55,712.4 1,82,097.5 1,99,643.0 Totol Debt 5,99,005.0 5,36,247.4 2,49,255.3 Deferred Tax Liobility 17,855.5 24,646.8 7,928.7 Provision for Employee Separation 10,424.1 10,800.5 11,183.0 Compensation Total Liabilities 9,13,550.8 9,21,936.1 4,20,747.5 Application of Funds Gross Block 1,083,887.4 1,051,287.1 2,34, I01.5 Less-Impainnent 32,250.7 32,235.0 1,004.1
- 9. Less- Depreciation 5,98,580.9 5,99,389.2 90,892.1 Net Block 4,53,055.8 4,19,662.9 1,42,205.3 Investments 64,111.0 33,674.3 1,64,975.0 Foreign currency monetary item translation 4,716.6 - difference account Goodwill on consolidation 1,53,649.2 1,80,499.6 920.7 Purchased Goodwill 1,275.9 761.2 102.6 69.3 Deferred tax assets 18,527.1 16,549.7 6,929.7 Stores and spare parts 1,98,159.9 2,14,093.7 3,1951.6 Stock-in-trade 1,30,316.3 1,86,978.2 16,865.3 Sundry Debtors • 68.1 89.6 11.6 Interest accrued on investments (/ Rs Mil' )
- 10. 15 358 In,ernatlona:::I.::.B:::us:::.in.::.es::s.::.St:::.ra::,e::.:g~y - _ 110-005-1 Cash and Bank Balance 61,483.6 42,318.6 1,08,879.6 Total Current Assets 4,08,555.0 4,60,029.8 1,64,637.8 Loans and Advances 1,30,157.3 1,54,598.1 19,803.4 Total CA, Loans & Advances 5,38,712.3 6,14,627.9 1,84,441.2 Current Liabilities 2,30,933.0 2,63,607.4 54,441.9 Provisions 71,577.1 64,580.1 20,795.7 Total CL & Provisions 3,02,510.1 3,28,187.5 75,237.6 Net Current Assets 2,36,202,2 2,86,440,4 1,09,203.6 Miscellaneous Expenses 1,054.8 1,556.3 2,097.7 Total Assets 9,13,550.8 9,21,936.1 4,20,747.5 Source: Tata Steel Annual Reports, 2008-09. 1000 v..M1 1 IA.800 V~;/ il600 ~ fY~ 1M
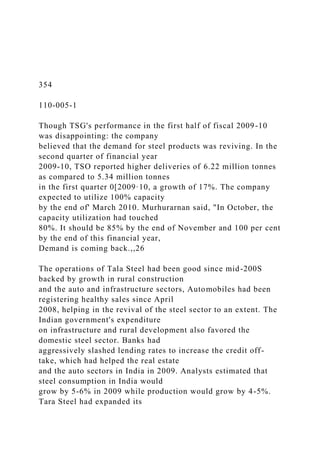
- 11. 400 J ~ ~ ~ f200 - - -- - 145 VV· JanOS Nau08 SenOS Jan09 Mau09 SeD09 Exhibit V Tata Steel's Stock Price Chart (November 2007 - October 2009) Source. hlfp./lfinance.yahoo.com X·Axis- Time Period Y-Axis- Price in Rs 16 ____ _____------------------------- ::'TA~T~A.::ST~E~El~'S!.A~CQ~U~IS~11l~O~N~O~f~CORUS IB) 110-005-1 Suggested Readings and References: I. Mobis Philipose and Ashwin Ramarathinam Tata St I G . Corus Still a Concern, www.livernint.com, August 07~~008~ms from Captive Resources; 2. Tata Steel-Cor us Synergy Realises $76 M . FYAugust
- 12. 12,2008. n In 2008, www.financialexpress.com. 3. Nandini Goswarni, Tata-Corus Synergy Realization at 16% http'II'fy A2008. 0, • 51 .corn, ugust 14, 4. Sanjiv Shnnkaran, Tata Steel Faces Cor us Pension Fund Losses www livemint com October 14, 2008. ' . ., 5. Corus Acts to Lessen Impact of Softening Near-Term Steel Outlook wwwtatasteelcom October 16, 2008. .' . ., 6. Steel Demand Seen Suffering until Mid-2009, www.rusmer.ccmOctcber rt.zcos. 7. Corus Raises Production Cuts to 30 Per Cent; Axes 400 Jobs, www.domain-b.com November 08, 2008. ' 8. Short- Term <?~tlook for Steel Demand Exceptionally Weak, Say Industry Experts, www.comrnodities.xorte.com, December 18, 2008. 9. Tom Stundza. Hot-Rolled Sheet Steel Price Forecast At US$ 515/Ton For 2009, http://wlVlV.purchasing.com.February 18,2009. 10. Corus Was a Very Very Good Buy: Muthuraman, Tata Steel MD, http://ecollomictimes.indiatimes,com, March 03, 2009, II. Demand for Steel Is Expected to Slow Down But to Grow at a CAGR of 8.0% in FY 2009-11 Accord to Latest Report "Indian Steel Industry 2009," April 03, 2009.
- 13. 12. Tata Steel Targets One Billion Pound Savings at Corus, www.financialexpress.com. April 11,2009. 13, Tata Steel Plans Rs 3,000 Crore Non-Convertible Debenture Issue, http://business.rediff.com, May 13,2009. 14, Tata Steel FY09 Net Drops 60 Pet, www.indianexpress.com.June26.2009. 15. Tata Steel Sees Sales Jump 25% in FY 10,www.blonnet.com.June27.2009. 16. Global Steel Industry Shows Signs Of Recovery: WSA, www.domain-b.com, August 31, 2009 17. Steel: the End of the Commodities Super Cycle, www.consensuseconomics.com. 18. Shobhana Subramanian, Tata Steel: Satisfactory Performance, hltp;//sify.com, October 28,2009. 19. Joel Rebello. Tata Steel Q2 Profit Halves; Weak Overseas Demand, www.liveminLcom, October 28,2009. 20. Tata Steel, Riversdale to Invest in Mozambique, www.moneycontrol.com. October 31, 2009. 21. 22.
- 14. 23. Steel Lndustry: The Way Forward, www.thomex.com. Piya Singh, Making Corus Work, www.businessworld.in. World Crude Steel Production Decreases by 1.2% in 2008, Wvw.worldsteel.org. 17 _________ --------------------------- ~Z~h~ej~ia~n~~Ge~e~I~~~~~·~ y utomotlve's Purchase orvofvc Xinjiang Exhibit 1 Geely's Manufacturing Locations summer of 2009, the government's "Cash for Clunkers" program helped somewhat with US$2.85 billion in government-backed rebates. Americans responded, bUY- ing nearly 700,000 vehicles. But for the mostpart, 2009 was a dismal year for new vehicles. Foreign automak- ers Honda, Nissan, and Toyota also saw sharp declines for 2009. Honda's sales were off 22 percent, while Nis- san was down 19 percent. Nissan's increase in December came from higher sales of its Versa compact car. Toyota sales were down just over 20 percent for the year. Sales of smaller, cheaper vehicles, however, helped drive gains for some manufacturers. Hyundai continued its surge, with an 8 percent yearly gain, while its low-cost Kia brand reported 2009 sales gains of nearly 10 percent. Japanese
- 15. automaker Subaru, famous for small all·wheel-drive cars and sport utility vehicles, said 2009 was its best year ever for sales and market share. They reported a 15 percent sales gain for the year and called 2009 an unqualified success. But by 20 I0, U.S. auto sales were sputtering back to life, and analysts were projecting sales to con.ti~ue increasing into 2011. With sales of around 11.5 mIllIon new cars and trucks, 20 I0 was still the second-worst HainanO year in almost three decades, after 2009. This was quite a drop from the heights of the early 2000s, when credit was cheap, incentives were rampant, and sales topped 17 mil- lion. In 2010 Ford sold 1.9 million cars and trucks, an increase of 15 percent over 2009. II was able to capture market share from rivals GM and Toyota. Ford's sales rose thanks to strong demand for its pickups, as construc- tion companies and other small businesses began buy- ing trucks again. The F-150 pickup was the best-selling vehiclein the UnitedStates in 20IO.OM sold 2.2 mil- lion vehicles in 2010, for an increase of6.3 percent over 2009, Chrysler sold 1.1 million vehicles in 2010-8 year- on-year increase of 17 percent. This was an impressive rebound, considering the company had emerged from a bankruptcy restructuring in 2009. For foreign automakers, winners included South Korea's Hyundai, which said its sales rose 24 percent for the year to 538,000 vehicles, a record for the company. Nissan reported an 18 percent sales increase for 20 I0 to nearly 909,000 vehicles. Honda sold over 1.2 mil- lion vehicles in 20I0, a 7.6 percent increase. However, Toyota continued to struggle. Its sales were nat in 2010,
- 16. a casualty of the company's tarnished safety record. " . Case 28:: ZhejiangGeo1yAUlIrilOtiyn Pu....... ofVolw eatll'., " '/~ 't~" ~~~;~:itI. • ",. •• ~..!.o...~,~ ... ~3:.::2:;4;:"""1-_ International Business Strategy Toyota had recalled more than 1a million vehicles since late 2009 for various issues, including sticky gas pedals. In early 2011, it was too early to tell whether the Japa- nese manufacturers would be significantly affected by the March 12 earthquake and tsunami that struck north- eastern Japan. Car companies had downsized and they were produc- ing fewer vehicles, so they didn't have to resort to costly incentives in order to clear out inventory. Big incen- tives-like the employee-pricing-for-everyone program in the summer of 2005-were one reason buyers flocked to dealerships, Also, buyers had been spooked by falling home prices and stubbornly high unemployment. But the economy was improving, and car companies were more confident about 2011. The recovery in global car sales also remained on track, with volumes advancing 6 percent above a year earlier in January 2011. The Rise of China's Auto Market Although the global auto market was sputtering, this was not the case in China, where automobile sales increased by an explosive 32.4 percent in 2010. China had already over- taken the United States as the largest car market in 2009,
- 17. and it was also the largest market for General Motors vehicles''. This was indicative of China's epic transforma- tion to a market economy and meteoric economic rise that had seen double digit growth rates for most of the past 20 years. China's middle class was expanding rapidly, and its large land mass and infrastructure could support a huge car fleet. Moreover, as China emerged as an economic power, the Chinese authorities were hoping to reduce reli- ance on exports and encourage more growth from domes- tic consumer spending. China's auto industry produced 18.06 million units in 2010. This was up from 13.79 million units in 2009, of which 8 million were passenger cars (sedans, sport utility vehicles, multipurpose vehicles, and crossovers) and 3.41 million units were commercial vehicles (buses, trucks, and tractors). In 2009, 13,644,800 cars were sold in China, The total revenue was RMB512,81 billion (US$76.67 billion) and profit rose to RMB 117,28 billion (US$17,53 billion), The growth in the auto industry was driven by increases in demand for cars in both the domestic and overseas markets. The growth of China's auto industry was nothing short of astounding. China produced one million cars in 1992 and two million cars per year by 2000. After China's entry into the World Trade Organization (WTO) in 200 I, the development of the automobile market accelerated. Between 2002 and 2007, China's national automobile market grew by an average of 21 percent, or one million vehicles, year-on-year. In 2006 China's vehicle production capacity successively exceeded six, then seven million, and in 2007 China produced over eight million automobiles. In 2009,13.759 million motor vehicles were manufactured in China, surpassing Japan as the largest automobile maker
- 18. in the world, In 20 I0 both sales and production topped 18 million units, with 13.76 million passenger cars deliv- ered. Likewise, the number of registered cars, buses, vans, and trucks on the road in China is projected to exceed 200 million units by 2020. For this reason, Geely, along with other car makers, had begun paying increasing attention to the China market. China's automobile manufacturers could be classi- fied into two types: joint ventures and domestic indepen- dent manufacturers. Of the automobiles produced, 44.3 percent were local brands (BYD, Lifan, Chang' an, Oeely, Chery, Hafei, Jianghuai [JAC], Grear Wall, Roewe, etc.). The rest were produced by joint ventures with foreign car makers such as Volkswagen, Mitsubishi, General Motors, Hyundai, Nissan, Honda, Toyota, and so on. Most of the cars manufactured in China were sold within China, with only 369,600 cars being exported in 2009. These joint ventures were so prevalent that they hardly left any mar- ket share for other independent manufacturers. Even so, Geely was determined in its resolve to become a major player, One reason that independent car companies had dif- ficulty competing was the perception that they lacked innovative designs. Market observers at the Detroit Auto Show in 2006 were unimpressed by the simple curves of mainland cars, They also commented on the shoddy fin- ish and the tinny sounds of the doors". Although Geely engineers were trying to modify car designs and engi- neering, Mr. Li knew that Chinese engineers still had a long way to go before they could satisfy the sophisticated tastes of Western buyers. Furthermore, Chinese products had a reputation for infringing upon others' intellectual property rights. For instance, Chery and Geely were accused of copying technology from GM and Toyota,
- 19. respectively. OM said that Chery's popular small QQ model was a rip-off of its Chevrolet Spark. Although neither OM nor Toyota prevailed in court the lawsuits inevitably tarnished the image of Chinese car makers. In 2011 Geely was sued by the British car maker Land Rover over a trademark dispute. Land Rover said it had been using two Chinese characters 'ILu Hu" in China for its "Land Rover" brand since the early 1990s, but that in 1999 Oeely registered the "Lu Hu" trademark knowing that Land Rover was using it,s Exhibit 2 shows total auto- mobile sales by region. Geely's Operations :With t~e motto of "passion in professional dedication, mnovanon, communication and hard work," Geely had created a corporate culture that cncouraeed innovation and growth. Geely was founded on a culture of entrepre- neurship, research, and innovation and this continued into 2011 with ongoing investments in 'education, training, and R&D. Geely. had grown its workforce with a commitment ______ -------------------------- Z~h~e~jia:l1n~g~G~ee~IY~A~U~to~m~o~tive'spurchaseofVoll O 1990-1999* 2000-2007* 2008# Exhibit 2 International Automobile Sales by Region Total Sales (millions of units) North America Canada
- 20. United States Mexico Western Europe Germany Eastern Europe Russia Asia China India South America Brazil 325 39.20 49.19 62.33 51.03 16.36 19.41 15.85 12.68 1.27 1.60 1.64 1.46 14.55 16.79 13.19 10.40 0.54 1.02 1.02 0.82 13.11 14.59 13.54 13.62 3.57 3.30 3.09 3.81 118 2.55 4.17 3.12
- 21. 0.78 1.37 2.90 1.47 6.91 10.45 15.07 17.68 0.43 2.91 4.98 7.32 0.31 0.78 1.20 1.43 1.64 2.19 3.70 3.93 0.94 1.37 2.23 2.53 Source: Global Auto Report, Global Economic Research. Note: • average annual sales # annual sales to hard work and quality. Stakeholders had come from all across China with diverse nationalities or overseas experi- ences. In short, Geely had developed a strong track record amid changing circwnstances. Research and Development Geelywaswenaware of the importance of R&D to corporate sustainability in automotive manufacturing. Therefore, Geely had been put- ting more than 10 percent of its annual sales revenue into R&D. For example, In 2009 Geely investedoverRMB1.2 billion (US$179.4 million) in R&D to back lip its inde- pendent development path. Geely's R&D capabilities were shaped by its team of engineers. TIle company had more than 1,600 engineers who came from all overChina, as wen as a number of foreign engineering experts and Chinese who had experience overseas. The research team expanded by more than 200 people during the first three quarters of 2009 and represented more than 13 percent of the firm's
- 22. overall workforce. Geely had established the Geely Auto- mobile Research School and the Geely Engine Research School. A new R&D center was planned to be built in Hangzhou, with a Phase I investment of RMB350 million (US$52.3 million). Geely had mastered most of the key technologies that were crucial to an autornaker, including knowledge about engines, drive trains, ancillary power systems, and interior and exterior equipment. The company claimed to be the first Chinese automaker that independently researched automobile transmissions. As of September 2009 Geely had achieved more than 1,200 patents, 30 of which were granted internationally. One technological advancement was the creation of the world's first Blow-Our Monitoring and BrakingSystem("BMBS"), a uniquetechnologythat helped to control a car when a tire blows out. In addition, Geely had invested in the research of new environmentally sound technologies and operated a self-developed Energy Effieient Building System ("EEBS") that reduced noise during the production process and cut gas emissions by up to 35 percent. Mr. Li believed that by mastering tech- nology Geely would be able to maintain its competitive advantage when facing foreign rivals. Geely placed significant emphasis on training. Geely's training program involved all employees and included regular lectures and educational sessions. To improve product design and quality, Geely began cooper- ating with many foreign automakers. from such countries r' C~~2B:~i1.jiangG~i A~~';llve'.Puttllawof VolvOCU. . ./;~:?~~''f~.' - ~'.'{ .", . .
- 23. 326 International Business Strategy (US$10,465). The target market of the models manufac- tured at Taizhou of Zhejiang Province was even lower, with prices around RMB30,000 (US$4,485). In addition, cost-saving was achieved through vertical integration; by producing many components in-house, Geely was able to further reduce costs and keep information regarding its manufacturing processes proprietary. Although Geely primarily began as a price leader, it slowly began to produce higher quality cars. Management realized that it was difficult to compete on price in the long-term, because the profit margins for low-end prod- ucts were razor thin. Thus, in 2004, having cemented its leading position in the low-end segment, Geely ventured into the middle- to high-end market. Prior to this, all of Geely's models in China targeted the low-end of the mar- ket, priced from RMB30,OOO(US$4,485) to RMB80,000 (US$II,960). By the end of 2004, Geely introduced its first middle-level model, Beauty Leopard, which ranged from RMB80,000 (US$11 ,960) to RMB 120,000 (US$17,940). Then they targeted the sports segment and mid-level portions of the market. For instance, 23 new models were introduced at China's automotive exposi- tion in April 2008. Geely introduced the Emgrand EC8, a limousine model with distinct Chinese elements at the Auto China Show 2010 (see Exhibit 3). The presence of the Emgrand EC8 at the auto show, which was a sign of the booming Chinese automobile industry, indicated that the independent Chinese national automakers had begun to manufacture luxury cars. Moreover, in order to repre- sent a new image, Geely paid RMB3.6 million (US$0.54 mil1ion) for a design contest for its new logo, including RMB2 million (US$0.30 million) for the designer. The
- 24. new logo (see Exhibit 4) was put into use at the end of 2007. The company reiterated in 2011 that its objective was to move to the upper end of the market and break from a traditional reliance on lower-cost models to boost average BiU)~$ GEELY AUTOMOBILE Exhibit 4 Geely Logo as South Korea, Germany, and Jtaly. Experts from foreign companies and institutes were invited to Geely to share their experience and provide training. Meanwhile, Geely's employees were sent abroad to receive professional train- ing. Such opportunities for knowledge exchange gave Geely's employees opportunities to fulfill individual growth, The R&D initiatives enabled Geely to gain a more advantageous position in the local market, and it lifted its international profile, These factors increased Geely's confidence in its ability to compete in China as well as overseas. Product Positioning inthe China Market Chinese carmakers have not provided data on overseas sales by country. But in general, exports paled in comparison to production for the domestic Chinese market. Besides Geely, a few other Chinese automakers also considered tackling overseas markets, including Chang'an Automo- bile Group, Beijing Automotive Holding Co., and Chery Automotive'. In 2008 the mainland exported 644,000 vehicles (worth US$8.88 billion) according to the China Association of Automobile Manufacturers, which was an increase of approximately 9.4 percent and 32.5 percent respectively over 2007. However, because of the financial
- 25. crisis and resulting decrease in automobile demand inter- nationally, only 370,700 vehicles (worth US$5.19 billion) were exported in 2009. Initially, Geely competed on price in China, provid- ing a series of models ranging in price from RMB30,OOO (US$4,485) to RMB80,000 (US$II,960). These prices put the dream of owning an automobile within reach of consumers in China's rural areas, where incomes were lower, Geely had developed an effective cost-control sys- tern. First, each product had its own specialized manufac- turing base to enhance efficiency. For instance, the plant in Shanghai focused primarily on mid-level automobiles, whereas the operations at Ningbo of Zhejiang Province manufactured the lower-end models, with price rang- ing between RMB50,000 (US$7,475) to RMB70,000 Exhibit 3 Emgrand EC8 Display at Auto China 2010 Show _____________________ .!'Zh~e~jl~angGeelyAutomotive'sPurchaseof Volvo revenue and profit per car sold. "We are not the Gee! f f "" yolye 0: SIXyears ago, chief executive Gui Shengyue said. The firm would start production on the Emgrand EX? SUV by June at a newly built factory in Chengdu with an initial a,ooual capacity of 50,000 units, Gui said. They were also In the process of developing eight new upper- end models." By 2010 there were more than 8 mi1lion Geely cars on the road. and the company's trademark was well rec- ognized throughout China. To further increase sales and
- 26. provide after-sale service. Geely had built a dealership and service network across China and in each of its new mar- kets. As customer satisfaction was critical, Geely became the first Chinese auto manufacturer to establish a call center providing around-the-clock service. In December 20 I0, Geely became the first domestic automaker to sell cars on Taobao Mall (see wWII.IQobao.com.cn) China's largest online shops. Geely faced tough competition from strong joint venture competitors and on several occasions was nearly driven out of business, but Mr. Li Shufu remained resil- ient and optimistic. He did not attempt to obtain a for- eign partner like many of his competitors. He believed that partnering with a foreign firm was a losing proposi- lion in the long run. The Chinese partners had little bar- gaining power over their larger, more established foreign partners. and they participated very little in the decision making. Furthermore, the alliances often did not bring about the advanced technology that was promised by the foreign partner. Instead, foreign partners often main- tained tight control, with the goal of maximizing their return. Mr. Li liked the independence of financial and operational decisions that came from remaining free of a foreign partner. Overseas Market Development Historically, Chinese vehicle exports had primarily been limited to buses and trucks and other heavy equipment. But Chi- nese manufacturers had steadily been upgrading their Exhi bit 5 An Iconic London Black Cab Being Assembled at the Coventry Plant technology and production efficiency in an attempt to ~ompete overseas in private passenger vehicles. The Im.portand export. unit of Geely Holding Group, Shang-
- 27. hai Geely lnternational Corporation, was founded in July 2002, Offices were established in five strategic markets: the Middle East, Africa, Southeast Asia. Central America, and South America. Geely exported about 19,000 vehicles in 2009, making it the second largest automobile exporter from China. After its participation in the 2005 lnternarionale Automobil-Ausstellung (IAA) in Frankfurt, Germany, Geely began to design and build a car model just for export to Western countries. Geely had established strong international partnerships and also made a variety of international investments. It had begun working with Magna Steyr of Austria, but the start date for exporting vehicles to Europe was not conftrmed.? The company had set up production plants in Indonesia and Russia, each with the capacity to produce 50,000 cars. II was reported that Geely was in talks with four to five coun- tries for future cooperation, citing discussions to set up assembly plants in Africa, Europe, and the United States. In addition, Geely signed an agreement with Manganese Bronze Holdings in October 2006. Manganese manufac- tured the distinctive London black taxi (see Exhibit 5), Under the agreement, Gecly became the largest share- holder of the British autornaker, At the same time, the Shanghai LTI Automobile Components Co. Ltd., a joint venture with Manganese, was established in 2007. This venture came into production in mid-2008. By 2011 executives were confident that the London black cab manufacturing venture could turn profitable that year. The Shanghai plant started shipping knocked-down car kits to the Coventry plant for assembly instead of mak- ing them on site, a move that could save nearly US$5000 per car in costs. In 2009 Geely acquired Drive Train Systems lnter-
- 28. national Pty Ltd., a leading global transmission developer headquartered in Australia. In March 2011 the Geely MK became the first Chinese passenger car to enter the Australian market, with retail prices beginning at $11.990 Australian dollars (see Exhibit 6). Geely saw Australia as an ideal test market for the car-savvy Western consum- ers before launching in the United States and Europe. The MK appeared to be a good value, but it was only the beginning for Geely's ambitious plans for the Western markets. Geely had developed a network of more than 500 retail distributors in 45 countries across five continents and nearly 600 service stations. In addition, Geely sourced components both domestically and internationally, with many of its 650 suppliers supplying the firm from their operations elsewhere in the world. Geely's Enterp~isc Resource Planning (ERP) after-sale service Information system ensured that Geely was intimately involved with 327 a 328 Exhibit 6 The Geely MK, Which Went on Sale in Australia in March 2011 its network and able to respond quickly to market demand as well as analyze customer patterns. Geely planned to expand this global footprint with additional manufac- turing facilities, dealer networks, and customer support systems.
- 29. Questions about Quality and Safety China was world-renowned as the world's workshop-dominating industries from shoes and toys to tools and basic elec- tronics. However, when it comes to cars, China is a relatively late entrant. Although Geely received encour- agement from the Chinese government, there were numerous challenges that had to be overcome in order for the company to succeed. Other things equal, low price is associated with low quality, and products from China had a reputation for shoddy workmanship. For example, the Landwind SUV made by Chinese auto- maker Jiangl ing Motors had gained a reputation for being of extremely poor quality,IO and this had tarnished the image of Chinese automobiles. The result of the German Allgemeiner Deutscher Automobil-C1ub (ADAC) test, which was comparable to European New Car Assess- ment Programme (NCAP) safety standards in passenger cabin protection, was zero out of 5. The passenger cabin completely collapsed upon collision. Since safety was an important factor in consumers' decision to buy, the test result seriously eroded Western consumers' confidence in the safety of Chinese cars. Oeely still had a long way to go on the safety and quality fronts!'. On December 12, 2006, at the Chinese Car and Technology Research centres crash test labora- lory, CNAp, the body responsible for Chinese car safety, carried out a crash test on Zi YOll Jlan (also translated as Freedom Vessel), a small sedan from Geely. The crash test was conducted on all aspects of the car's outer shell. Results showed that the pillar between the driver door and rear left-hand side door was extremely weak 12. Zi You Jian also took part in a Russian crash test in 2008. The crash test was conducted by the Russian magazine AU/amative
- 30. C232·C~ 28:~Zfiejhing Gcely Automotive's Purchase of Volvo- Review: which bought the car for just under US$12,OOO. Although this test was conducted two years after the first test, the car scored zero stars. The editors of the magazine began calling the car the "Death Vessel.,,13 (See YouTube videos' search "Geely Crash Test.") Fer this reason, Geely was determined to make tech- nological breakthroughs in the areas of safety and quality control, as well as energy efficiency and environmen- tal protection, and it was believed the Volvo acquisition could help in these areas. All new Geely cars needed to pass tests from independent testing centers with stan- dards specified by the New Car Assessment Programme (NCAP) in China. Oeely also took quality control seri- ously. All Geely facilities were IS09000 compliant, and the Ningbo plant was certified lSOITSI6949:2002. Moreover, the Geely team launched a five-year energy efficiency and environmentally friendly auto develop- ment program to develop cars not powered by standard gasoline engines. Furthermore, the company intended to develop five hybrid models in the near future that would incorporate plug-in, stop-run, hybrid, and electric-only systems. The Volvo Acquisition Details of the Merger In 2009 Oeely's parent com- pany, Zhejiang Geely Holdings, made a big step toward international expansion by announcing it would acquire Volvo Car Corporation from Ford Motor Company. This US$1.8 billion acquisition was, at that time, the largest cross- border acquisition by a Chinese privately owned enterprise. The transaction agreements included, in addi- tion to the stock purchase agreement, further agreements on intellectual property rights, supply, and R&D arrange-
- 31. ments between VolvoCars, Geely Group, and Ford. Although initially the two companies would operate independently, future potential synergies could be envi- sioned. Forexample, it was hoped that Geely could benefit from Volvo's advanced safety, quality, and environmental technologies. In particular, Volvo was known as a leader in automobile safety. This appealed to Geely, which was par- ticularly stung by having their car labeled a "death vessel" by overseas crash testers. It was thought that Volvo could benefit by the infusion of new resources and greater access to the burgeoning China market. Geely hoped to preserve Volvo's existing manufacturing facilities in Sweden and Belgium. The collaborative relationships that Volvo had built with employees, unions, suppliers, dealers, and customers were also valuable for Geely. On completion of the merger, Volvo would be a separate company with its own management team and a new board of directors based in Gothenburg, Sweden. The board and the manage- ment would have a mandate to develop Volvo's leadership in safety and environmental technologies, expanding the company as a world-leading premium brand with a pres- ence in more than 100 markets with ambitious plans for the fast-growing Chinese market. _________ --------------------------- .:z~h~e~jia~n~g~Gee~I~Y~A~ut,amotlve's Purchaseor Volvo Li Shufu woul~ become chairman of the board at Volvo Car Corporation and Hans-Olov Olsson a r id d hi f ' rormerpresi ent an C ie executive of Volvo would b, h. • ecome V1C~ c airman. In F~bruary 2011, Volvo established its
- 32. China he~dq~art~r5 In Shanghai and announced that It would build Its first Chinese plant in the western city of Chengdu, scheduled to open in 2013 with an annual capac- ity of 100,000 units. A year after the merger, Volvo man- aged to make a profit in 201Q-..-afirst since 2005. Volvo sold nearly 374,000 units globally, up 11.2 percent from the previous year; sales in China increased 36 percent to 30,522 cars, In China, Volkswagen was the first foreign auto- maker to set up a joint venture in 1984. As a result Audi cars were viewed as a made-in-China luxury brand among government officials. Geely's strategy was to grab mar- ket share from Audi, and to boost Volvo's China sales to over 200,000 units annually by 2015, Geely wanted to sell Volvos to wealthy Chinese consumers and especially government officials in China, at prices ranging from USS40,000 for basic modelsto USSIOO,OOOfor high-end luxury models (see Exhibit 7), Although foreign-brand cars sold in China were made in China, the brands were owned by the foreign companies. It was hoped that this would work in Volvo's favor, as patriotic Chinese con- sumers might prefer buying a car from a Chinese-owned company. It was the same strategy that Chinese computer maker Lenovo used when it bought 18M's PC business and became a world-class player. However, white this strategy might benefit Volvo in China's domestic market, it might harm the Volvo brand in foreign markets, where the association with Chinese-made automobiles might signify lower quality or safety. It remained to be seen whether the gains would offset the losses. Turnaround and Branding Challenges Geely's parent company faced a challenge in restoring Volvo to Exhibit 7 The Volvo S40
- 33. long-term profitability, Volvo posted revenue of USSI2.4 billion In 2009 by selling 334,000 ears, bUIil recorded a pretax loss of USS653 million," Geely planned to dou- bl~ Volv~'s sales in Europc and North America and gave ~flma:y Importance to building the brand's market share In China and other emerging markets. As the history of General Motors, Ford, and Chrysler show, the auto indus- tf?' was ?ne of the mOSI ferociously competitive indus- tries. This was especially true in mature markets like the United States and Europe, where entrenched incumbents would fight to the death to defend their turf, Geely had little experience selling cars outside of China, let alone running major manufacturing operations in a country as f~r awa7 and as different as Sweden. Ocely lacked expe- nence In the developed countries in how to market and sell upscale cars. Turning Volvo around would require Geely to make upfront investments to increase produc- tion capacity and in advertising and brand building. Many industry analysts predicted that 13·year-old Geely, barely known abroad, would have a difficult time turning around Volvo. Geely also faced challenges regarding brand manage- ment. An important reason for the Volvo acquisition was the value of the Volvo brand. In China, Volvo was consid- ered as luxurious and safe as Mercedes-Benz and BM W. Geely wanted to improve its brand name by acquiring Volvo, so as to move to the higher end of the market. As Mr. Li Shufu put it, "From my perspective, Volvo's prod- uct is already in very good demand. Our real challenge is how we are going to evolve and develop the Volvo brand further." However, the ability to buy is not the same as the ability to manage. The facts were that Oeely was known as a manufacrurer of cheap cars with a short history that included poor safety and questionable quality, while Volvo was a premier European luxury brand. As a Chinese com-
- 34. pany, Geely hoped to localize Volvo cars for thc Chinese market without diluting the global image and positioning of the Volvo brand. Furthermore, it was likely that costs would have to be cut at Volvo, which was still losing money at the time of the acquisition. But this would be difficult, given that Volvo is known as a leader in safety and environmental technologies. If Geely began to use more Chinese-made components in Volvo cars, it could tarnish Volvo's high- end or safety reputations, Meanwhile, Ocely sold subcom- pact cars in emerging markets like Russin, Turkey, a~d Venezuela. It did not enter the U.S. market, because Its quality standards didn't match U.S, safely and other stan- dards, Geely's basic cars were sold for USS6.0oo each, and the company was still viewed as a low-end car maker. Three months after the merger, Volvo and its new owner admitted to differences. Mr. Li, the new chairman of Volvo, disagrced with lhe product and brand strategy of company executives back in Sweden. He wanted Volvo to develop larger cars for Chin~, wh.i1cVol~o w~nted t~ develop small, fuel-efficient vehicles III keeping with their -- ,--=3;.:3~O=-~_International Business Strategy international markets in mind. Among these new models would be five hybrid cars, which were currently under development. Geely also hoped to release eight new series of gasoline and diesel engines as well as seven new series of manual and automatic transmissions. In order to do this, it would have to successfully inte-
- 35. grate its new acquisition, which still faced many challenges. "Volvo cannot fail,"said David Zhao, auto industry analyst of Frost & Sullivan, noting that the government would lose face ifGeely's acquisition proved unprofitable". reputation for being environmentally friendly. Should the company target the Chinese consumers' tastes for ostenta- tious luxury cars or stick to its mandate of environmental protection and safety? Potential Culture Clash Pcstacquisition cultural integration has always been a challenge, even when the companies came from the same country. This challenge is compounded in cross-border acquisitions, where there are differing national cultures on top of differing corpo- rate cultures. Lenovo's acquisition of IBM's PC Division was a vivid example. Lenovo faced enormous challenges as it attempted to incorporate its U.S, division into its predominantly Chinese organization. Similarly, although Geely Holdings had accumulated some international experience from their export activities, the company had limited experience in cross-cultural management. In this case, the acquirer was smaller and less experienced than the acquired. Volvo had a long and proud tradition and a deeply entrenched corporate culture that reflected its proud Scandinavian heritage. This situation had the poten- tial for wounded pride on the Swedish side, loss of face on the Chinese side, and policy disagreements all around. Future Growth Geely had consistently achieved strong sales growth. Its revenues rose roughly 55 percent to R.MB9.24 billion (USSIAI billion) in the first half of20 I0, while net income surged to RMB804.85 million (USSI22.69 million) from RMB595.91 million (USS90.84 million) for the same period of 200915. Geely was never shy about its ambitions for international expansion. Geely bought shares in Cov-
- 36. entry, England-based Manganese Bronze Holdings and owned 20 percent of the iconic London black cab manu- facturer; Traditionally seen as a mass-market car maker, Geely entered the luxury car market by acquiring Volvo in 2010. Geely planned to continue increasing its international presence over the coming five years, with a goal to build 15 production bases worldwide. In addition, it hoped to sell two-thirds of its cars outside of China and to double the global sales of the newly acquired Volvo brand. To do so, the company was growing both organically through its existing car brands and through acquisitions and partner- ships. By 2015 Geely planned to have developed several new car models, all compliant with international emis- sions requirements and suitable for sale overseas and all of which would be designed with both domestic and Endnotes I. wWII'.geely.com. 2. Financial Times lnformation. 2006. "Geely on fast lane for expansion."October 18. 3. Allison Jackson, China Daily. 20 IO. "China overtakes US as world's largest auto market." January II. 4, Bernard Simon, "Eastern carmakers fine-tune their strategies to ensure a slice of the lucrative western market," Financial Times, 2007. January 4. s. "Short Critique,"China Daily. 2010. November 15. 6. Andy Cheng, "Chery to Set Up Three Assembly Plants Abroad,"Stnocast China Transportation Watch. 2007. January 24.
- 37. 7, Neil Gough, "Geely's new BUVsto boost profit," South China Morning Post. 201 1. Geely's new SUVs to boost profits. March 24. 8. Toru Shimoharaguchi,"Young China execs challenge world,"Nikkei Weekly. 2011. January 17. 9. Alysha Webb,Crain Communications. 2006. "Despite obstacles, Chinese carmakers are keen to come to Europe: Playersto watch in the race to export from East to West." December I 1. 10. China Business lnfocentre, The WTO Column. 2005. Can Chinese products survive a crash test? http://www. ajroshanghai.com/forulllslillde.x.php?topic= J30.0. 11. The Cars Guide. 20 IO. "Moving forward in the motoring world."August 20. 12. China Car Times. 2006. "Geely crash test-Zi You Jian- Free Vessel:' December 13. 13. China Car Times. 2008. "Geely 'Death Vessel." February 4, 14. Gazelle (Montreal). 2010. "China's Geely hopes to tum around Volvo."August 3. IS. Vinicy Chan, "Asiamoney best managed company awards: China,"Asiamoney. 20 IO. December. 16. Miho Nagano, Geely's Volvo Management Challenge: Selling Made-ln-Chtna Volvos,"Investor's Business Daily, July 16th2010.
- 38. ____---------------------- .':~N~D~IA~N~W~IN~E~IN~D~U~ST~RY: GROWINGWITHCHALLENGES 31 ~MITYi RESEARCHCENTER HE,DQUARTERS BANGALORE Indian Wine Industry Growing With Challenges Case study Reference no 212·036·1 This case was wrItten by Jimmy Thakkar, Amity Research Centers Headquarters, Bangalore.lt Is intended to be used as the basis for class discussion rather than to illustrate either effective or ineffectIve handllng of a management situation. The case was compiled from published sources. © 2012, Amity Research (enters Headquarters, Bangalcre. No part of this publication may be copied, stored, transmitted, reproduced or distributed in any form or medium whatsoever without the permission of the copyright owner. ethe case for learning OlrtrlbUltci by KdI, UKud USAwww.- .:ch.comAllrlghll reoervedP,lnl~ In UK.nd USA NOI1h A/n ... k.1 ..17112)958&1,.17,11l9YlS.-- ~""tM-WI .... lOtUlt7S090Jf ~1Ol11Jo'1)mS.-
- 39. - 332 International Business Strategy 212-036-1 Indian Wine Industry: GrowIng with Challenges RES); RClJ CE'TF.R HEA~l· 'RTERS BANGALORE Author: Ms. Jimmy Thakkar Indian Wine Industry: Growing with Challenges Abstract: Indian Wine was exposed to the world during 1800s, but after a sudden bout of epidemic, the vineyards were destroyed. Sutthe Indian wine began to sparkle again after the vineyards began to take roots during 1880s to 1980s with renewed vigour. India had been one of the fastesl growing alcoholic beverages markels in the world, but had negligibie consumption of wine compared to all other alcoholic beverages. Despite having a large populalion of around 1.2 billion, consumption of wine in India remained low compared to other Asian countries. The iower per capita consumption level of wine provided potential opportunity for wineries to cover a huge untapped market. The changing socio-cultural factors and influence of the western culture had impacted the perception of indian consumers for wine. In addition, increasing disposable income, changing habits, wine tourism, wine clubs and festivals, changing lifestyle, growing preference of women for Wine, greater
- 40. awareness of wine and easier availabilily through newer retail formats had given a fresh impetus for growth to the wine industry in India. Yet, industry observers were skeplical whether the wine manufacturers and marketers would be able to leverage socia-cultural changes effectively, given the fact that the industry was vexed with myriad tax regulations and paradoxical federal government rules and regulalions. Pedagogical Objectives The case study helps to understand and analyse: • The growth of the Indian Wine Industry • Impact of the Socia-Cultural factors impeding its growth • The Opportunities and Challenges faced by the Indian Wine Industry. Case Study "Economic prosperity has found ways of flOWingout Into social prosperity, and the ealing and drinking out levels have grown exponentially. With this, wine finds center-slage.'" - Sijoor Harish, Brand Strategist & CEO, Harish Sijoor Consultants' India was considered to be the one of the fastesl growing economies amongstlhe BRiC nations (Brazil, Russia, India, and China).' After China, India was the second highest populist country in the world' With Ihe growing economy.and mcreasmq middle class population, Indian market provided promising opportunities for various commodities. An evolVing population, gov~rn~ent regulations, consumer behaviour, higher incomes, industry advancements, media and Increased globallSatlon had witnessed growth for wine market in India.' Rajeev
- 41. 1 "Socfo-cultural Changes Cheer India'. Wine Market", http://knowredge.wharton,upenn,edullndlalarticle,Cfm;jsesslOnJ d=a8303cd5627c781b3c00194e2f161454632d?artlcleJd=4676 March 151112012 , 2 A Private Label Consulting Firm Specialised In Brand and Business Strategy. , "The Wine Market In India Opportunities for Canadian Wine Exporters", h ttp;lIwww.ats-sea.agr.gc.ca/asI15542-eng.hlm.July2010 4lbld. 5 Ibid. "© 2012, Amity Research Centers HQ, 8Ingllo(e, AU rights reeerved." 2 INDIAN WINE INDUSTRY: GROWING WITH CHALLENGES 212-036-1 Indian Wine Industry: Growing with Ch,lIengH Samant, Chief Executive Officer" Sula Vineyards' said: 'The demographics favor the growth of wine In every single way, Young, urban professional women are starting to donk socially, which never happened a generation ago, and a lot of them are preferring wine." Although the Indian wine industry was at nascent stage, the vast Indian population and changing social dynamics provided an apt backdrop for the beverage to prosper and emerge as potential alcoholic beverage, The Influence of western cullure, the emergence of newer retail formats was slowly turning in favour of the beverage to gain the status
- 42. of being fashionable and modern drink among younger consumers, However, the growth of the beverage was being stifled due to myoad taxes and paradoxical federal government regUlations and stipUlations, It remained to be seen whether the Indian wine industry would be able to overcome the hurdles and leverage the changing socio-eullural environment. Indian Wine Industry: Poised to Sparkle The consumption of alcoholic beverages among all civilisations dated back to 3000-200 BC' Alcohol had varied uses like medical, social, religious and recrealional across various cullures, The alcoholic fragmentation and distillation was practised by Indus valley civilisation during 2000 BC in India' The Indian alcoholic beverages market was segmented as Fruit-based and Grain-based,1OThe Grain-based alcoholic, beverages were f~rther segmented as distilled and non-dlslilled, The distilled alcoholic beverages included Indian-made Foreign Liquor (IMFL), foreign liquor bottled in India (FL-BII), foreign liquor boilled Ino~igin (FL-BIO), and country liquor. The wine formed part of fruit-based non-distilled acohctc beverages" (Exhibit I), Exhlbitl Classification of Alcoholic Beverages 3 I r-utt N"'chW't' 1 tlnlcWnll:.·r ""1"'" Whi ..l..y ~ NOI' - rdcoholil
- 43. J Al(tlholJc .L rrllit jllic e-'!-i 11".111Drinks k I f Beverages" http://icpe,inlicpefoodnpac agmg p - 'Source: "Pac ag ng 0 , , uerors introduced grape vines in India around 2500 years Historically, it was recorded that the PerSian,conq the aristocrats, The three key segments of win~ In India ago,12 Wine as beverage In India was patr?"s~, by and Fortified wines." Vltlcullure and winemaklng were were Premium Wines (Still Wines), Sparkling nes, occupation in India." The Port-Style wine was strongly persuaded during the British and Ihe Portuguese 'India's Premium Wine Company based In Nashlk. I crte' Prices" http://www.bl00mberg.comlnewsf2011-G7.G owth as Duties Boost mp '111 2011 7 Sharma Malavika "India Wlnemakers Tap r hi her.than.tokyo,hlml, July 27 261lndla'S'Wlnemakers.tap.growth.as.t~x~s.h~~~~j:::ri:~~~:~ta tHealth_&_.UbstanceJbuse_'lcOhol_.t1as3.Pdf a "History of Alcohol", http://wWw.who n e.0 e Ibid. " . In/Ie efoodnpaCkaglng/pdfs/14_beverlges.pdf 10 "Packaging of Beverages J http.lllcpe. P ml2011101117lthe.briCs.suprlslng.wlnes-of.lndlai 11 Ibid. f I dl " http·/IwlneeConomlst.co dl I Industry-emc pdf 12 "The BRieS: Surprlsl~,gWln~~: e~~ePlu~.eUlwp-
- 44. (:ontentiUPloads/201~~~~~~i~e~s~~ry.no.sour.g~lpes.html,Jlnu .ry 13 "IndIan Wine Industry, http. I'; htt ./Iwww.deccanherald.comlconten 14 ''WIne story: No sour grapes, this J p: 28" 2012 - 334 International Business Strategy 212-036-1 Indian Wine Industry: GrowIng wIth Challenges introduced in Goa during the Portuguese Colonist Rule way back in the 16- C~ntury While the British planted wineries in Baramati (an agricu,tura,'town in the State at Maharashtra), Kashmir region In the Nort~.and Sur~t (was a major trading sea-port town In the West region of India)," But In the late 1BOOs,a Phylloxera epidemic destroyed Ihe vineyards in India as much as it did in the Europe (Annexure I), But, In the, early 19BOs, the Narayangoan based Chaleau lndaqa" (indage) established in the sl~te of Maharashtra ~n1tlallyImported the Vitis vinlfera grape varieties like Cabernet Sauvignon, Chardonnay, Plnot blanc, Plnot nair and Ugnl blanc to produce slill and sparkling wines in India and later exported them," However, Indian climate was not ideal for viticullure, But few areas located in Maharashtra such as Deccan Plateau, around Baramati, Nashik, Pune, Sangli and Sholapur, as weil as areas around Hyderabad, besides outskirts of Bangaiore, Chikkaballapur, Bagalkot and Bijapur in Karnataka were found 10 be ideal for viticulture and wine maklng,19
- 45. In India besides, several native varieties of lable grapes like Anabeshahi, Arkavati and Arkashyam, Bangalore Blue (Isabella) and Gulabi (Black Muscat), Turkish grape Sultana, were grown in India. Apart from the imported French varieties such as Sauvignon blanc, Zinfandel, Chenin blanc and Clairette, which were also seen making inroads in the Indian wine making," Mohan Rao, a wine consultant said: 'Grape is the only fruit that can be rnade to wine without changing the chemistry in it. Grape juice contains ready-to-ferment sugars, natural flavour, natural colour and even yeast, seen as a white deposit on the grapes, which heip the fermentation process.'> On the other hand, Ihe nascent wine making industry in India was trying to make a foothoid in domestic and international markets. 22 In India, among Ihe entire alcoholic beverages category, wine was the least preferred drink, Moreover, for religious reasons most Indians do not consume alcoholic beverages, The consumption of wine at home was negligible while consumption of wine in hotels was on the rise," Indage, Sula Vineyards, Grover's Vineyards", Diageo (Nilaya)", Pernod-Ricard" (Seagram's Nine Hills) and the Uniled Breweries Group" (UB) (Zinzi and Four Seasons) were the major wine producing companies in India" In 2010, Sula Vineyards became the leader in wine sales in India, having 20% stake in terms of volume, followed by United Spirits and Grover Vineyards with 15% and 9% of volume shares respectively," Sula Vineyards dominated the light grape wine and sparkling wine, while United Spirits ruled the Indian port wine category. Financial problems in Indage Vintners Vineyards degraded its volume share from 18% in 2009 to 5% in 2010," Between 2009 and 2010, the domestic brands
- 46. maintained its supremacy over imported brands in off- trade outlets, However, increased import duties on wines resulted in the price gap between domestic wines and imported wlnes.31 Major ,importers of ~ine in India were Australia, France and Iialy, and the U,S, was the fourth largest supplier and Singapore remained fifth due to hike in excise tariffs," In India, major production of wine look place in the 15 Ibid. 15 A small, sap-eating, greenish Insect that feeds on Vines. 11 An India WInery Company Based In Narayangaon. ,. "WIne story: No sour grapes, thlsl", op.clt. l'lbld. 20 ibid. 21 ibid. 22"Grape Fever", http://WWWJbef,org/downloadlfeverJan19.Pdf 23 Tigchandler, "RevisitIng India wine market", http://tJgchandler,comI2012101/D7IreviSltfng.the·lndlan- wine·markeU, January 7IIl2012 2.4 A Wine Making Company Baaed In Bangrore . .is BritIsh Based MUltinational Alcoholic Beverages Company Headquartered In London, United Kin dom. 2ll A French Based Company Produces Distilled Beverages. g 11 An IndIan Conglomerate Company Based In Bangalore. : :lndian Wine Market: At A ,~Ianc~n,http://www.tUlteeho.com/Wlne/downloadslWlne_repor t.pdf Food and Beverage India ,http.IIWww.med.govt.nztsectors.industrleS/food.beverage/Pdf. docs-library/Information_ proJectimarket-proflte·lndla.pdf, January 2012 :llIlbld.
- 47. )1 Ibid. 32 Williams David and Mishra Shubhl, 'The Indian Wine Markel" http://www.calwlnexport.comlflleslWlne_New%200elhUndls_ 4.'7.2011.pdf, July 4th 2011 4 INDIAN WINE INDUSTRY: GROWING WITH CHALLENGES 212-036-1 Indian Wine Indulfry: Growing with Chllleng.s state of Ma~rashtra and Karnat~ka,33 Two-third of the wine was domestically produced in Ihe stete of Maharashtra Industry analyst beheved the domeslic wine producers would oonlinue to be dominate the Indtan wine Industry but, consumption of Imported wines w,ere expected to grow in the premium and super premium Wine se~6ment In ~ndla due to the perception of finer quality towards internationat brands," Aooording to RNCOS Report, The consumption of Imported Wines will rise at a CAGR of around 32 per cent during 2009- 2012, well above the industry's overall growth,"" In, 2011, per ceplta consumption of wine in India was only 10 milliliters annually,~ In 2011, lhe US was biggest wine consuming market with anannual per capita consumption of 3,7 billion bottles,~ The Indian wine induslry was expected to touch INR 27 bllhon mark at the end of 2012 from about INR B billion in 2008 In terms of value' the consumption was expected to touch 14.7 million liters in 2012 from aboul 4,6 millio~ Ihres in 2008,~
- 48. According to the 'Indian Wine Industry Analysis' report by RNCOS, 'Red wines are quite popular among Indians, Over 50% of the country's populaton is above 25 years of age, and forms a huge impending oonsumer base for the wine industry, With higher personal disposable income, and changing lifestyles and preferences, the wine consumption volume in India is expected to grow at a CAGR of around 25% during 2011-2014,"" Industry analyst observed that there were muitiple growth drivers shaping the Indian wine Industry such as, rising disposabie income, favorable government policies, wine tourism, clubs and feslivals, changing lifeslyles and perceptions, growing awareness and the emerging trend of women drinking wine," Aooording 10 the industry body Associated Chambers of Commerce and Industry of India (ASSOCHAM)" 'Besides changing lifestyle and drinking habits, favourable government policies, rising disposabie inoome and growth in lourism sector are paving the way for growth of the industry,"" The major oonsumption areas were Mumbai city which accounted for 30% of total consumption in india, Delhi and Goa accounted for 20% each and Bengaluru accounted for 15%, while Punjab accounted for 5% and the remaining 10% was consumed in the other parts of India," According ASSOCHAM Report, 'Cities like Delhi, Mumbai, Chandigarh, Bangaiore, Chennai etc. account for majority of wine oonsumption in India, The chamber feels Ihat as per Ihe emerging trends non-metros and tier I & tier II cities will also form a good portion of wine consumption in India,''' According to Subhir Hari Singh, Chairman, Karnataka Wine Board (KWB)", 'True, the win~ marl<et In India Is very small at present But we see a huge growth polenlial in this sector and we want to faclhtate the growth by creating an enabling environment for all stakehoiders in the
- 49. chain - from the gr~pe farmers to the, end consumers '" In India the consumption of wine remained iow as compared to other ASians oountnes, despite of second largest populist country (1,2 billion) in the world," The lower per capita oonsumplion of the Indian wine industry had shown immense potential for the manufaclurers togro~ In orde~ 10 oover, the unlapped market, According to Reva Singh, Editor and Publisher, Semmeher indla~, The Indian wine Industry took off In Its "Ibid. :w Ibid. k I" 'I 33 "Socio-cultural Changes Cheer India's Wine Mar e I 0p.CI . 3e A leading Market Research and Information Anal'cY·AI·G~~~~p~r~.lndian- e:ommOdlty.COmJcommodltl"llndla.Win .. 31 "Indian Wine Consumptlon to Record 28 percen " Consumption- To_Record.2S.Percent·CAGR,aspx, November 13 11l 2009 ~ "Socio-cultural Changes Cheer India's WIne Market", op.clt ~9ibid. " .a "Indian wine Industry to touch Rs 2,~OOcr mark ~yd20~2 :t.t ch.rs.2700.cr.markobyo2012120110328.hlm, March 28* 2011 http://www.rediff.com/businessfreportllndlan.wlne.m u~ry 0 OU '1 "Sparkling Future Ahead for the Indian Wine Industry, J 121112012 http://www .sbwlre.comJpressoreleaseslsbwlre.122357 ~~tm,anuary '2 "Domestic Wine Anticipated Growing at 21% C~R 'A II I ated_Growlngoato21.CAGR.htm, Janulry 19'" 2012 http://www.rncos.comIPress_ReleasesIDomestiCo ne- n c p '3 One of the Apex Trade Associations of India. b 2012" pelt .. "Indian wine industry to touch Rs 2,700 cr mark y ,0..
- 50. '5 Ibid b 2012 end" httP·/lwww.commodltyonlln •. comlnewaJIndllowln .. , h147mnlltres Y - , . 'II "India wine consumption may reac . 12oend.3770403.31705,html, March 30 ltl 2011 consumPtlon.may.reach.147.mn.lltre~.bt~ocletleS Registration AcI1960, '7 A Registered Body under the Karna a a . k t" 0 cit 48 "Socio-cuiturai Changes Cheer India'. Wme Mar e , p. . 49 "Indian Wine Industry Analysis", JlndianoWlne_lndustryoAnaIYlls-IM296,htm, Janulry 2012 http://www.rncos.com/Market.AnaIYSls.RePorts ne 50 India's First and only Magazine Dedicated to WI . 5 = ...... 3.. 3;:;,;;6;...-4__ Intemettcnel Business S'~trr:.~te2.gy~ _ 212-036-1 Indian WJna/ndustry: GrOWing with Challenges earliest days because of visionaries such as indage, Grover and Sula. There was a lot,of buzz surrounding o~r potentially large and untapped market Good money was spent buiidlng beauliful wmenes and investing In vineyards but other aspects of the business such as deveioping the consumer market lagged.'''
- 51. Socio-Cultural Factors Aiding Growth According to RNCOS, 'The wine industry in India is all set to make a strong comeback this year, owing to a steady economic resurgence, Traditionally, India has not been a wine consuming nation, but among other factors, changing habits of the people have changed the face of the Indian wine industry, which will further support the sector in long-term."" Macro and micro environment had led tremendous change in the Indian communities, The Indian societies experienced a constant transformation, resulting in acceptance of new lifestyle, Iraditions and practices, Giobalisation, Industrialisation, Migration and incursion of media had provoked people's lifestyle, There was a notable change from agrarian to modern societies, accompanied by changes in standard of living, Modern lifestyles had surrogated traditional societies, resulted into shifting traits of the youths and adults in India,53 Where the Indian societies considered wine as liquor, the Indian government ethically compelled to shelter its citizens from its misuse," Article 47 of the Indian Constitution stated that "The State shall regard the raising of the level of nutrilion and the standard of living of Its people and the improvement of public heallh as among Its primary duties and, in particular, the Slate shall endeavor to bring about prohibition of the consumption except for medicinal purpose of intoxicating drinks and of drugs which are injurious to health."" Religion also played a crucial role in affecting eating habits of Indian consumer including wine consumption, Historically, in India wine was being served in the religious festivals, it was considered as illegal drink in the eyes of the society, But, by 21" Century wine was being perceived as urbane drink in India, Despite of the religious reasons; easy
- 52. accessibility to affordable wines and western culture aspiration invigorated the consumption of wine across the country.58 Socio-cultural changes in India had a greater impact on the wine industry in India, According to Subhash Arora (Arora), President, Indian Wine Academy~, "Drinking wine as a lifestyle choice is catching up very fast Wine is now always there at piaces where it hadn't been even offered before, like parties and weddings.''' Indian consumers began perceiving Wine as separate drink, Aspiration of western culture had changed the perception of alcoholic consumption, though alcohol was severely restricted in Hindu religion,59 Eminent spirits like beer, whiskey and gin signifies the culture of traditional British Empire; but wine was considered as a trendy and modern drink of younger audience,eoAccording to Arti Verma, Associate Director, Nieisen Company" (Nielsen), "Wine holds a distinct position in the indian consumers' mind, It is seen as a sophisticated, stylish drink as compared to other alcoholic beverages, like Whiskey, Scotch and Rum that are considered men's drink &1 Ghose Anlndlta, "Heard It on the grapevine", http://www.Hvemlnt.comI2011/10/28193108IHeard.it.on.theogr apevine.htmI J October 29th 2011 52 "IndIan Wine Industry In High Spirits In FY 2010", http://www.rncoS,COmlBlog/reportJlst.php1year=http:llwww,rn cos,comIBloglblogJeport.php&month=12&blog..pagename=lndl an.Wlne.lndustryoln·High.Splrltsoln.FY.2010, December 2Btft2009
- 53. ""Burden and Soclo EconomIc Impact of Alcohol- The Bangalore StUdy", http://203.90.70.117/PDS DOCS/B0305.pdf 54 "Comprehensive StUdy of lndlan Wine Market", - http://www.lndlanwlneacademy.comlComprehenslve_StudyJWM _Reference Sectlon.pdf "Ibid, - 58 "The Indian Wine Markel", cp.clt. 57 A New Delhi-baled Market Development ConSUltancy Firm. 51 McDonald Alyssa, "Despite Problems of Matching, India's Wine Industry Booming", htlp:/lwww.daljlworld.com/newsfnews_dlsp.asp?nJd=129012. February 5th 2012 " "The Wine Market In India Opportunities for Canadian Wine Exporters" op.clt 10 Ibid. ' . 81 A Global Marketing and AdvertisIng Research Company. 6 INDIAN WINE INDUSTRY: GROWING WITH CHALLENGES __ +-.oa:JI..-I 212-036-1 IndIan Wine Industry: Growing with Challenges or Gin, which is considered a woman',s drmk" Lately with more International players entering the market, the Indian co~sum,er has, only p~ogressed m their Indulgence of wine.''' As compared to liquor, wine considered to be healthier d~lnk as It contamed lesser alcoholic content in it According to Arora:Over the last five years, wtne as a dnnk choice has started to become a trend, I,ndlansare known for drinking spirits, especially whisky, many
- 54. of these people are not changing from their signature drink, but adding wine as a selection.''' Growing awareness of heallh Issues was also pr~mptmg some consumers to switch 10 wine from beverages with higher alcohol co~tent Thls factor had made wine even more popular amongst Indian women and the young starters, In India, wme among the female segment was more socially acceptable form of drinking as opposed to hard liquor drink," Ankur Gupta IAnkur), Marketing Head, AM Mind Power Solution " said: '",Women are dnnking more wine because they consider It a 'sophisticated drink' that 'raises their stature In social gatherings'.''' In urban areas of India, the consumption of wine by women had increased to 28.7% in last five years (2006 - 2010) compared to increase in male consumption of 17.3%." Ankur further added that, "Increased fmandal independence of middle class women are also driving demand, as they can more easily 'indulge in social events at bars and at restaurants'.''' Other factor responsible for growth was retail sales that supported the future popularity of wine consumption in india," As in India alcoholic beverages was individual state SUbject,many slates of India had allowed wine to be retailed by private departmental stores," For
- 55. instance, in Delhi departmental stores keep wine along with fruits and vegetables, According to Abhay Kewadkar (Kewadkar), Business Head and Director, Four Seasons Wines", 'The move will see a 30% rise in wine sales In the cily, Availability of wine on the shelves of modern retail stores will surely increase its visibility and customer contact, and will lead to increase in sales, Besides, better storage conditions will also ensure that the quality of the product remains intact.''' Various states allowed wine sales through departmental and supermarkets stores as it helped increase Visibility and availability of wine also distinguishing it from liquor in order to develop wine drinking cullure across the country,73 According to' Industry Analyst, 'In the organized retail segment, wine now acoounts for 30% of all sales as compared to 22% to 25% just a year ago.''' Commenting on the growth of relail wine sales, Subarmanian Ponnu Vice President, Food and Supply Chain, Max Hypermarkellndla" opined, 'In a short span of lime, wine will e";erge as the single largesl segment in liquorretailing.''' Another c,ritical,success factor for the Indian wine industry was emerging trend of the wine tounsm m l~dla,77To attract vsncrs and promote and educate about wines, Wine tourism was deemed one of the best mediums,
- 56. 21' century Indian consumers were very techno-savvy, Use of Internet aided Wine ma~ers to devel?p an education manifesto that assisted in experimenting and Introducmgnew ~me products, The Neilson Syndicated Wine Study' report 2010 stated that, 'The indian wine industry has witnessed phenomenal growth in recent b 'I dla" http'/Iwww Imagesfood,comlnewl.aspx?ld=2000&toplc=2, July 13tl12010 U "Growing wine consumer ase In n , .' " 13 "DespIte Problems of Matching, India's Wine Industry Booming .cp.clt. W "Comprehensive Study of the Indian Wine Market", op.clt. . &!I A Leading Market Research and Information Service Provider In Indla~ 811 Kakavlatos Panos, "Indian Women Drive surg 9 • 2 /,n,;llne. C~~~:~:::.~urge.in.Wlne.con.umPtlon,November 7
- 57. 1t12011 http://www.decanter.comlnews/wlne.newsIS294 n an w 61 ibid. ui~d. . M~l~~c~ n"Soclo-cultural Changes Cheer India's Wine a er', . i d I I" 7Q Dubey NeeraJ, "SpIrited In times of gloom . t~e In:ci~~1~~~~O~9~~4~sipM.Pdf http://www.psalegal.com/pdflenewsUne.novem er- n The Flagship Brand of the US Group Company, . lne" 72 Chatterjee Kakoly, "Cheersl Deihl Stores ca~ Sl~~~:~;~I!c~n.so~n.retal1.WlneIS1639310,September 1311I2009 http://www.f1nanClalexpress.comlnewslcheersde snOlnIndia" 13 Arora Subhash, "Wine retailing witnesses n:w dal~&Sectnam~=Fealures%20. II http://www.retaillng360.com/lndex.asp)(?pa~e-~~~~21201 010211837171796bcfd07, October 21 2010 %20Guest%20Column§ld=8&conlenlld-20 M rk t" op cit 14 "Soclo.cultural Changes Cheer India's Wine a er', . . 75 A leading Retailer. 'W' Market" op.clt. 16 "s I Itural Changes Cheer India, me I t ~ 17 "~~:~~~rlsm. An Emerging Trend in the IndIan:~:.~n~~~~g:Trand.ln.the.lndlan.Wlne.lndu'try.htm,March 1"-2012 http://www.mcos.comIPress_ReleaseslWln e-Teurts
- 58. 7 IIIJ!IIII'II III !' c 338 , International Business Strategy 212-036-1 Indian WIne Industry: Growing with Challenges----------- years due to the entry and introduction of several new brands. The survey was conducted across Mumbai, Delhi and Bangalore, and explored consumer perceptions about wine,
- 59. consumption and purchase habits."" India's middle class population was rapidly growing in the world and it was expected to touch 583 million by 2025 This development served a hopeful consumer market for wine. In India, 'young' population in the age group of 20-49 years that was considered eligible for drinking was huge and growing In number. By 2015, the 'drinking age' population was estimated to touch 95 million tran.slating into a huge consumer ~ark~t for adult beverages." Changing demographic factors of urban population fascinated the consumers eating habits, resuiting into their shifting in consumption habits. indian urban youth was heading towards a more western-style cuisine. Kapil Grover (Kapil), Director, Grover Vineyards stated that, "Like in India, wine consumption in China was traditionally at very low ievels. But in the past few years it has galloped and the country has become one of the biggest markets across the world. There is no reason why India should be so far behind. It is just a matler of time before we reach the inflection point. But the government also needs to do its bit to make it easier to produce and consume wine."80 Way Forward Amidst Challenges
- 60. The Indian wine industry was growing at very smaller pace. As compared to other alcoholic beverages, wine consumption was negligible in India. According to Sidharth Mallya, General Manager Marketing United Spirits Limited and heir to the UB Group, "The current alcoholic beverage penetration in india is around 42.5%, while beer and whiskey penetration is at 26% and 23% respectively. Wine is only at 0.6%. However, four times as many people have expressed their Willingness to taste wine, but haven't done so for lack of the necessary casual fine-dining experience and opportunity.''' Though the Indian wine market had grown, it accounted just about 0.8% in the total share of wine consumed in Asia." According to Internationai Wine & Spirit Research (IWSR)82 study,'Despite a rapid growth seen in the last few years, India ranks a lowly 77 in terms of wine consumption in the world.''' With many positives aspects, the negative traits were also attached with the wine market of the country. The wine industry underwent challenges which threatened the industry growth. They were - state-wise tax structure and policies, problems of logistics & supply chain, improper storage facilities and the under developed
- 61. Infrastructure. Aiso the other major barrier was lack of awareness about the beverages among the buyers and sellers,B5 indian wine makers faced typical challenge of developing a domestic market for wine. There had been substantial increase in the number of wineries in India, nearly 75 in 2011." Oniy few of these wineries had Pan India presence ;emaining were very small. Ac,,?rding to Phadtare Hambir, Managing Director, India's Mountain View. Wines", Only a ha~dfu.1of large wlnenes today control the Indian market. Government policies are prohibitive for the smaller wnenss. For Instance, each state levies a different rate of excise duty and other taxes on wlnes."B8 7& "WIne Wins", http://www.retalltng360.comlindex.8apx?Page=artfcle§nam e=Magazlnes%20. %20SpeclaJ%20Feature§ld=16&conlentld=201 0090920 10091414435213084<:194533, September 9th 201 0 7$ "The Wine Market in IndIa Opportunities for Canadian Wine Exporters", op.clt. eo "scclc-culrural Changes Cheer India'. Wine Market", op.clt. 11 Ibid.
- 62. 12 "India to witness three-fold Increase In wine consumption", htlp:lfartlcles.economJctJmes.lndiatlmes.coml200a_03_ 12JnewsI28419043_1_wlne- consumptlon,wlne_culture_totsl_WIne, March 1211I2008 13 A Magazine PrOVides InsIght Into Short Term and Long Term Trends of Wine Industry, J4 "IndIa to witness three-fold Increase In wine con8umption", op.clt. &I Sekhrl Kapil, "In High Spirits Wine has started gaining mass appeal and Is now one of the lead consumables In the Indian market", http://www,buslnessworld,lnlbuslne8sworldfbu8InesswOrldlG:o ntent/High-SpIrits html May 21" 2012 16 "SocJo-cultural Changes Cheer India'. Wine Market", op.clt. . , 17 A Family Owned Boutique Winery, Based In Nashlk . .. "Soclc-culturel Changes Cheer India'. WIne Market", op.clt. 8 ________________ ~Ir<lND::'A~N'.:W~I::NE~I::N~DU:S~TR~Y~:GROWING
- 63. WITH CHALLENGES 212·036·1 Indfan Wine Industry: Growing with Ch,lIeng8! Although wine was non-distillation drink, consumption was very low as it was considered under the cat a of alcoholic beverages. Commenting on this Kewadkar said 'W',ne an al h I' b eg rybed' d' .." co a IC everage, can be treated as an agro- as In ustry given the fact that ~I~e ISmade from the fermentation of grapes. There is no distillation Involved In the process. This also means It ISa farmer-friendly industry.'" In India, alcoh~1 dr.inking had strong negative sociai impact and hence alcohol consumption had always remained a political Issue. Liquor Industry in india was reguiated by the state government rather than the central gov.ernmenl. Ho~ever, as the alcoholic beverages were state matter, each of India's 29 states and 6 union terntor~~s had their own rules & regulations and duties & taxes. Even the pallem of wine distnbullon and control vanes: According to Chandra Alok, Founder and CEO, Gryphon Brands", 'Wine is a state government subject
- 64. In India and every state has ItS own tax rules and reguiations. This makes it very difficult to operate outside one's own state. It also adds to the end price for the consumer.''' Soaring impon duties, slate excise taxes, sales tax and transaction fees tossed a challenge for Wine importers. They encountered various problems in obtaining license clearance for wine/liquor distribution in respectivestale for markeling their preducl." However, existence of different rules, regulations and duties In different states leads to variation in wine prices. Taxes and duties commonly imposed on wine were, Excise Outy, Additional Duly, Distillery/Brewery License Fee, Bottling fee, L1tterage fee, Assessment Fee, Franchise Fee, Permit Fee, Gallon age Fee, Raw Material Excise, Availability Fee, Brand/Label Fee, Permit Fee, Transportation Fee, Import Pass Fee, Export Pass Fee, EducationallWelfare Cess, Vend Fee, Sales Tax/Surcharge, License Fee, Toll Tax and TOT." According to Kapil, 'Expect the market to grow at a minimum of 25% year- an-year for the next 25 years. If the government policies change, it could be far higher.'~ Imposition of taxes by the state government increased the unit price of wine, leading to reduced consumpficn" This affects wine manufacturers and traders as Ihey were unable to
- 65. earn high profits in the domestic market. Indian consumers were highly price sensitive as they choose low-cost wines in the range of INR 400-800." According to Kewadkar, "At present on a Rs 400 bollie of wine, the sales tax Is Rs 130. This automatically drives up the cost of wine, making it an unviable option. Around the wand, wine is treated as a beverage and said in grocery shops. It only makes sense to do the same in In~ia.'~ In .term~of Price range, Indian wines offered a wider variety than European wlnes.~ According to Arora, The Indian ~lne market is still not very mature. It is an extremeiy pnce sensitive markel. In the Imported ran.ge,the premium segment has wines priced at around US$20 to US$32 per bottle (of 750 mil, and even higher. The mass segment is in the range of US$12 to US$18 a bailie. The prices are even more competitIVefor the Indl~nwines, with the premium segment in the range of US$10 to US$12 a botlle. The fast-moving pnce range IS around US$6 to US$7 a bottle.'''' Imported wines confronted antagonism not only from low priced locally pr~duced wines, but also from seve;~; other restrictive pollcies." The skyrocketing 161% import duty on wines disappointed the Importers. Moreover, such wines could only be sold In outlets possessing
- 66. license, and only 35% to 40% of outlets had such lliI Garg Swetl, Ulndustry Proposes 0, eldic,e,nSln~/ffd~~~ery·~poposeS.delicenSlngwlnesI456327/,N ovember 23rd 2011 http://www.buslnessostandard.comln a new n" 90 "Comparative Study of The Indian Wine Market I http://wwW.lndlanWineaCademy.comIComprehenSlve_StudYJ WM.Pdf t1 An Independent Wine Consultant In IndIa. rl 'fndla'e Wine Market in Full Flow", I:'111X06LQP51lndla_S_Wlne_Market-ln.Fun-Flow,htm, January 15 11I 2012 http://www.hktdc.comllnfolvp/alemklenI1/ox 13 "The Indian Wlne.Market", op.clt,,, ." th ssoclales.comJmarketlng-of-wlne~n.lndl •. html M "Marketing Wine In State of India, http, Www,se a es "Soclo-cultural Changes Cheer India's Wine ~rke_tl'~_~:d~~~;eport,March 2012 116 ''Wine In India", htlp://wWw.euromonltor.com neof Indian wine Industry?",
- 67. e1 "Is protectionism the only way forwa~d2'4~h:~~:tld=177&SUbSUbCatjd=718 http://wwwJcrler.orglpage.asp?MenuIDw "u 116 "Industry Proposes Del1censlng of Wlnes Th , op,CIf Indian wine Industry?", op.clt. " "Is protectionism the only way forward- e case 100 "India's Wine Market in Full Flow", op.clt. 101 lbld. 102 ibid. g • 340 International Business Strategy 212·036·1 Indian Wine Industry: Growing with Challenges
- 68. licenses,'" According to Amit Arawal, Director, Hema Connoisseur Collections (HCC)''', "The competition is not so much from domestic wines, but from other liquors, especially whisky and beer.'''' However, another major challenge faced by the wine manufacturers was promoting wine in India, The Indian government barred direct and surrogate advertisements (sponsoring major sport events, brand related promotions, etc) in the public media for endorsing consumption of liquor including wine,'06 According to Palash Basu, Assistant Manager, Imperial's 1911 Restaurant and Bar"', "The challenge is promoting wine and making your customer knowledgeable about the wine, the grape, the temperature - everyone have to be trained, even the customer."" Most liquor and wine promotions were done by arranging on-premise campaigns like wine tasting events, sponsoring cultural/entertainment events, Point of Sales (paS) and gift materials,'" Consumption of wine flourished throughout the population, social and cultural issues such as majority of Hindu population preventing consumption of wine had threatened the growth of the Industry, In India, ethnic and religious clash prolonged to be a concerning issue; and the wine
- 69. industry wouid probably confront with these challenges in a short time, Where a modern outlook towards wine intake had been gradually increasing, the customary values and perceptions towards aicoholic beverages were stili deep-rooted in the Indian culture, These ancient foundations were major threats for the growth of wine industry, Moreover, the high import duties were forcing many foreign wine makers to join hands with the local wineries to gain entry into the emerging market like India. Arora said: "We will see more of the foreign investment in the wine industry, With foreign investment comes the technology equipment, management and possibility of marketing required to get past the iniliai hiccups the industry is facing."" It remained to be seen, whether the nascent wine induslry would be able to leverage the changing soclo-cuilural and economic environment towards wine consumption. 10) Ibid. 1114 Engaged In the Imports and Distribution of Various International Products In India 105 "India's Wine Market in Full Flow", op.clt. ' lila "The Jndian Wine Markel", op.clt.
- 70. 107 A Hotel Based In India, loa "IndIa Says Cheers to Booming local Wine Industry", hltp:ffln,reuters,comlartlcleI2008/08121/us·lndla.wine.idINBO M8498620080821 109 ''The Indian Wine Market", cp.cft. 110 Awa! Akankshl, "Investors toast India's wine Industry", hltp:llbJogs,ft.comlbeyond·brlcs12011103/1 Ollnvestors·toast·lndJas.wln e·lnduslryl#axzz1 xYMmi NFT, Ma rch 10th 2011 10 __ ------------------ _...:~N:::D:::~A:N:.:w"::~':'.NE:.'~':'.ND~U::S~TR~Y:.':G:I<R:' O:-:W~IN~G_':'W'!:ITH~C~H~AL::L.:'EN~G~E.:S_--- ----- 212-036-1 Indian Wine Industry: Growing with Challenges Annexure I Hlsto 01Wine In India Time Line Events
- 71. 2000·1000 BC Vedic period of Indian history, Wine was believed to be associated with Indra - the king of ods, oured as libalion and drunk al reli ious festivals and celebrations Circa 327 BC The Arthashastra (ancient indian treatise on stalecraft and governance) discusses wines made from grapes and fruit - & begins strict regulation of production and distribution of alcoholic bevera es. 300 -150 BC Alexander invades India & introduces new vines in the area Circa 1526 AD Euro ean travelers brin Euro ean st Ie wines into courts of Mu hal Em erors, Circa 1600 AD Portuguese selliers in Goa use wine to preserve meat with garlic and Indian spices- buildin blocks lor the Ciassic Vindaloo Dish. Circa 1615 AD Clarellovin British setllers in India ianl vines in Surat and Kashmir. 1800 -1900 AD Indian wines exhibited and received favorably by visitors 10 the Great Calculla Exhibition
- 72. of 1884 Circa 1984 AD Wine is overshadowed as India becomes one of Ihe largest markets for British Ate. Long sea voyages inspire crealion of the legendary India Pale Ale. A Phylloxera epidemic devaslates the Indian wine industry like it does Ihrough much of Europe - a setback that will ut the Indian industr in abe ance for about a centu Present Farmers in Nasik Valley trigger a wine revolulion making the Indian wine industry the fastest rowin in the world. Source: "Wine in India", http://soultreewine,co,uklhistOry.pdf 11 TATA STEEL'S ACQUISITION Of CORUS (8)__ '-JiCI 110-005-1
- 73. ICMR- ~- Cenl.t tol Monagement •• tealch ICMR Center for Management Research Tata Steel's Acquisition of Corus (B) ThiS case was written by Harlsn A under the direction of Vlvek Gupta, /CMR Center for Monagement Research. It was compiled from published sources,and is intended to be used as a basis for closs discussion rather than to illustrate either effective or ineffective handling of a management situation. (02010, ICMR Center for Management Research ICMR, Plot # 49, Nagarjuna Hills, Hyderabad 500 082, Indio Email: [email protected] 'NVVVV.icmrindio.org ethe case for learning DI'tflb~ted by o<dl,uttlnd USAWWV/ ... <h,comAll ~ghlS reservedPrlnlod In UK~rld USA Nofl~"m.. l~I
- 74. +1 7Bl1395a84f +1181 23958&5• "ch~h.com Ilttt fIIIlhl worldt +A4lO112J41S090l, +4l(O)12)(75111S• t«hho:l,(Dm ......3....:..44.:.-_I-_ln_t_er_n_ational_B_u_sine_ss_S_tra_t"9y~ _ 110-005-1 ICMR----- C.nl~r fOI Monagemen! ••• .atch Tata Steel's Acquisition of Corus (B) "The company {Tata Steel Group) has not brought down costs to the extent they should have. There is more bad news in store, as the Canis Group disappointment is still round the corner. "I Niraj Shah, Senior Analyst, Centrum Braking", in October 2009. "You don', buy looking at the short-term, but the long-term future of a company. Corus was a very
- 75. good buy as Its fundamentals are quite sound. However, it's poor show on the books has gOI nothing /0 do with itsfundamentals. it's a victim of the current global downturn. ,,) B. Muthuraman, Managing Director, Tata Steel Limited, in March 2009. TATA STEEL GROUP REPORTS LOSS On August 27, 2009, India-based Tata Steel Group (TSG)4 announced disappointing resuIts for the quarter ended June 2009. The company reported that its net sales were down by 47% at Rs 231.8 billion as compared to the corresponding quarter of the previous year. Industry experts were shocked as the company reported a net loss of Rs 22.09 billion for the quarter as compared to a profit of 39.01 billion in the quarter ended June 2008 (Refer to Exhibit [ for Quarterly Performance ofTata Steel). TSG's management said that while they had made efforts to bring down the company's costs, the prices at its European arm - Corus Group PIc. (Corus) - were
- 76. impacting the profit margins. In light or the recession in developed countries, Corus reported lower sales volumes ill the European Union (EU). The company's selling prices declined year-an-year by 1% in the EU. Lower capacity utilization and higher raw material cost impacted the operations in Europe. Commenting on the efforts TSO's management was taking to turn around the operations of Cor us, the company's Managing Director, B, Muthuraman (Muthuraman), said, "The results of TSG for the quarter ended June 2009 reflects the impact of the global economic downturn, particularly in the developed markets. The Group is currently undertaking several restructuring initiatives internally to not only weather the current storm but to emerge much stronger in the near future. The global recovery is expected to be slow and the company will continue to focus on operating performance and liquidity management.v' I "Tam Steel Q2 Profit Halves; Weak Oversees Demand," www.livemint.com.October28. 2009. 2 Founded in 1977, Centrum Braking Pvt Ltd is one of the
- 77. leading stock broking and investment banking companies in India, 3 "Corus was a Very Good Buy: Muthuraman, Tata Steel MD:' http://economictimes.indiatimes.com, March OJ, 2009. 4 Tate Steel Group comprised combined operations of Tata Steel (India), Tata Steel Thailand, Natxtecl Asia, and Corus. s "Tara Steel Q! Cons Net Loss at Rs 22.09 Billion," www.moneyconlrol.com.August27.2009. 2 __ ------------------- T~A'.'.TA~STEEL'SACQUISmONOf CORUS(B) ---- 345 110-005-1
- 78. Industry experts pointed out that while Tata Steel's financial performance on a standalone basis was satisfactory, its ambitious acquisition' of Anglo-Dutch steel company Corus in January 2007, had failed to deliver results. Expressing disappointment, Sanjeev Prasad, Executive Director and Company Head, Kotak Institutional Equities, said, "We have to revise consolidated earning per share (EPS) downwards post Corus numbers, The numbers coming out from the overseas businesses seem 10 be a lot worse than what we on the street had factored in. lt looks like the volume decline is far more that what was anticipated. So, let's see what's paved for recovery out there but it looks like it's going to be another terrible two quarters for at least Corus, going forward. Tata Steel on a standalone basis seems to be doing okay. But I guess, a significant portion of revenue is coming from the overseas operations since the time you see stabilization in overseas volumes - it's very difficult from a consolidated level for the company to report decent numbers." THE ACQUISITION
- 79. On January 31, 2007, Tata Steel acquired Corus for US$ 13.70 billion'. The merged entity, TSG, employed 84,000 people across 45 countries in the world. It had the capacity to produce 27 1~iJ[ion tonnes of steel per annum, which made the merged entity the fifth largest steel producer m t.he world as of early 2007. Commenting on the acquisition, Ratan Tata, Chairman, Tara Sons, s~ld, "Together, we are a well balanced company, strategically well placed to compete at the leading edge of a rapidly changing global steel industry." Before the acquisition the major market for Tata Steel was India. The Indian market accounted for 69 percent of the company's total sales. Almost half of Corus' production of ~teel, on the o~h.er hand, was sold in Europe (excluding the UK). The UK. cons~med twenty rune percent of Its production. After the acquisition, the European market (mcludlng the UK) would consume 59 percent of the merged entity's total production (Refer to Table Ifor the spread of Tata-Corus markets before and after the acquisition). Before the Acquisition After the Acquisition
- 80. Corus Tata-CorusTata Europe 49% Europe 37% India 69% UK 29% Asia 24% Asia (ex. India) 23% North America 10% UK 22% Rest of the World (ROW) 8% 9% North America 8%Asia 3% ROW 9%ROW Table I Spread of Markets Before and after the Acquisition Source: Tata Steel Annual Report, 2006~07.
- 81. , . . -corus PIc. by Tata Steel Limited and the e~~~tcd syncrgic~ 6 A detailed description on t?C acquISItion ~f~ ICMR case study, "Tata Steel's AcqUISitIOn,orCoru~. and challenges is covered III the awa~~:?~ngwebsite (www.icmrindia.org) and ECCH s website The case can be accessed at Number 108-010-1. (www.ecch.com), ECCH Reference '. ganjcev Prasad," www.moneycontrol.com, August 28, 1 "May Review Tata Steel's EPS Post Corus Nos.: ~ 2009. • 18tNR and I Powld' 86.13 tNR. . . As on January 31, 2007, I US Dollar 44. I k Corus," lntemalionailleraid Tribune. April. . . r European Stee rna er , "Tata Steel Completes AcqUISitIOn 0 03,2001. 3 346 International Business Strategy 110-005-1
- 82. However, some industry analysts were skeptical about the success.of the acq~isition. Vive~ Gu~ta, Managing Director, AT Kearney (India), said, "The financials of t~IS dea~ req,Ulre high performance levels, perfect post-deal execution, and sustained high steel pnces. It IS a risky game and will be okay for Tata Steel as long as the economy is growing and no major bumps occur. If [these bumps] do occur, they can become a challenge, and r am reminded of the high leverage days of the mid-I 980s.,,10 Many analysts and industry experts felt that the acquisition was rather expensive for Tata Steel and this move would overvalue the steel industry world over. Commenting on the deal, Sajjan Jindal, Managing Director, Jindal South West Steel, said, "The price paid is expensive ...all steel companies may get re-rated now but it's a good deal for the industry."!' Despite their apprehension of the deal being expensive for Tata Steel, industry experts were optimistic that it would enhance India's position in the global
- 83. steel industry with the world's largest" and fifth largest steel producers having roots in the country. Stressing on the synergies that could arise from this acquisition, Phanish Puram, Professor of Strategic and International Management, London Business School said, "The Tata-Corus deal is different because it links low-cost Indian production and raw materials and growth markets to high-margin markets and high technology in the West. The cost advantage of operating from India can be leveraged in Western markets, and differentiation based on better technology from Corus can work in the Asian markets. Ill) Though the potential benefits of the Corus deal were widely appreciated, some analysts were concerned that the Corus' acquisition would result in significant equity dilution" of Tata Steel. The company also became highly leveraged due to the significant increase in debt" in its capital structure. The US$ 6.14 billion debt that was raised to finance the acquisition had been secured through the asset's of Corus and was to be serviced by the cash flows generated by Corus.
- 84. Financial experts also pointed out to the risk taken by Tata Steel as it piled on the debt burden on Corus. There was a danger that, Corus's cash inflows would reduce if the global steel prices declined significantly, leading to a default on the loan taken. According to the credit rating agency Standard & Poor's (S&P)I6, the move was financially risky for Tata Steel. According to S&P analyst Anshukant Taneja, "The size of the acquisition and the potential cash outflow in Tata Steel's offer for Corus could have an adverse impact on its financial risk profile."!" 10 "Did TataSteelOverheat in itsZeal to WinCorus?"[email protected],February08, 2007. 11 "India Inc.HailsTata's Win,"TheTimesof India,January31,2007. 12 On June25, 2006, India-bornLaxmiMittal'.sRotterdam- basedsteelcompanyMittel Steel Company N.V. (the largest steel producer before the.~C.qulSltlOn)acquired Luxembourg-basedArcelor SA (the second largest steel producer before the acquisition).Thisacquisitionresultedin the formation of ArcelorMittal
- 85. whichbecamethe largest steelproducerin theworld. ' 13 ;~~~~l to the Metal: Challengesof Tata Steel's COTUSTakeover," [email protected], October 31, 14 Tate Steel's stand alone equity share capital increased from Rs. 7277.3 mill' . FY 2006.07 t Rs 62034.5million in FY2008-09. Ion III 0 . 15 Tata Steel's stand alone debt increasedfrom Rs. 96453.3million in FY 2006~07t Rs 269461 8 ilf in FY2008-09. o. . rm ton 16 S&P isa divisionof McGra.v~Hillthat publishesfinancialresearchanda 1· ks db d It is f h . ... na YSIS on stoe an on s.one ate LOp threecompanies ill this business,alongwithMoody's and Fit h R ti 17 C . . , le amgs. hris Noon,RuthDavid, 'Tata PrevailsinCorusBattle,"www.forbes.com.January31, 2007. 4
- 86. TATA STEEL'S ACQUISmON Of CORUS (6) 110-005-1 THE GLOBAL STEEL INDUSTRY The global steel industry had witnessed an unprecedented boom between the year 2002 and mid. 2008. Several major steel companies across the world went on expanding capacities encouraged by the increasing demand led by the significant growth in the world economy IS and the rising price of the commodity (Refer to Exhibit II for Top Ten Steel producing companies in the World). Easy availability of credit boosted construction activity both in developed and developing nations. Growth in the world economy became synonymous with the growth in the global steel industry because of the high utility of steel in key sectors like infrastructure, automotives, consumer goods, and industrial. By July 2008, the prices of most of the steel products were at their peak (Refer to Table II for Global Steel Prices between January 2008 and July