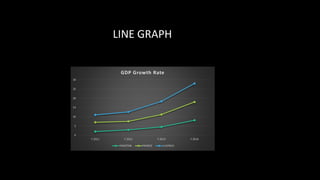
GDP Growth Rates of Pakistan, France and South Africa from 2011-2014
•Download as PPTX, PDF•
0 likes•347 views

The document contains 4 charts: a line graph showing GDP growth rates for Pakistan, France and South Africa from 2011-2014; a pie chart showing items sold during Ramzan in 2014 with rice being the highest at 36%; a bar chart displaying currency change rates in percentages for different countries from 2011-2012 with Pakistan showing the highest increase; and a column chart comparing price increases of various fuels like kerosene, petrol and diesel in Pakistan from March 2011 to August 2013.

Recommended
More Related Content
More from Syed Iftikhar Ali Shah
More from Syed Iftikhar Ali Shah (11)
Recently uploaded
Recently uploaded (20)
GDP Growth Rates of Pakistan, France and South Africa from 2011-2014
- 1. 0 5 10 15 20 25 30 Y 2011 Y 2012 Y 2013 Y 2014 GDP Growth Rate PAKISTAN FRANCE S.AFRICA LINE GRAPH
- 2. PIE GRAPH Tomato 18% Fruits 21% Onion 25% Rice 36% Ramzan things sold 2014 Tomato Fruits Onion Rice
- 3. BAR CHART 0 20 40 60 80 100 120 Pakistan USA India UAE Currency change rate % Diffferent countries Series 3 Y 2012 y 2011
- 4. COLUMN CHART 0 1 2 3 4 5 6 7 8 9 KEROSENE Petrol Diesel LPG Increase Price Of POL March 2011 To Aug 2013 2011 2012 2013
- 5. GOOD BY