Impact Investing and its Future Impact on Business Priorities
•Download as PPTX, PDF•
0 likes•145 views

New Metrics 9/27 16.45 - 17.30 Panel Paul Herman

Recommended
More Related Content
Viewers also liked
Viewers also liked (18)
Similar to Impact Investing and its Future Impact on Business Priorities
Similar to Impact Investing and its Future Impact on Business Priorities (20)
More from Sustainable Brands
More from Sustainable Brands (20)
Recently uploaded
Recently uploaded (20)
Impact Investing and its Future Impact on Business Priorities
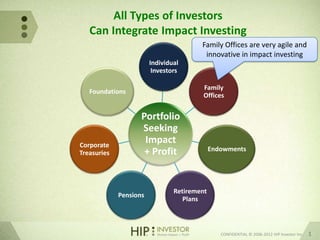
- 1. All Types of Investors Can Integrate Impact Investing Family Offices are very agile and innovative in impact investing Individual Investors Family Foundations Offices Portfolio Seeking Corporate Impact + Profit Endowments Treasuries Retirement Pensions Plans CONFIDENTIAL © 2006-2012 HIP Investor Inc. 1
- 2. Trillions Are Invested for Impact Growing in Europe and the USA Source: www.eurosif.org; www.ussif.org CONFIDENTIAL © 2006-2012 HIP Investor Inc. 2
- 3. ESG in Each Asset Class Still Ripe for Sustainability Portfolios Source: Mercer ratings CONFIDENTIAL © 2006-2012 HIP Investor Inc. 3
- 4. Harvard Professors: Sustainability Can Benefit Portfolio Value CONFIDENTIAL © 2006-2012 HIP Investor Inc. 4
- 5. CONFIDENTIAL © 2006-2012 HIP Investor Inc. 5
- 6. CONFIDENTIAL © 2006-2012 HIP Investor Inc. 6
- 7. CONFIDENTIAL © 2006-2012 HIP Investor Inc. 7
- 8. Impact Investing Seeks to “Do Good” and “Make Money” at the Same Time Solve Seek Higher Human Needs (Do Good) HIP Profits (Make Money) We call this “HIP” = Human Impact + Profit CONFIDENTIAL © 2006-2012 HIP Investor Inc. 8
- 9. In this Portfolio, HIP Scores Can Vary by Asset Class, With a Wide Range of Human Impact + Profit CONFIDENTIAL © 2006-2012 HIP Investor Inc. 9
- 10. IMPACT and PERFORMANCE REPORT “HEAT MAP” (Sample)
- 11. RISK, RETURN, IMPACT and ALLOCATION (Sample) Relative to an Efficient Frontier ALLOCATION: size of RETURNS: bubbles is percent (%) Annualized Allocated to Asset Class Returns* IMPACT: color of bubbles: Green = higher IMPACT Yellow = medium IMPACT Red = Lower IMPACT RISK: Standard Deviation of Returns* * For annualized time period over the past 3 years ending July 30, 2012 (or for data since inception of strategy)