Beginners Guide to TikTok for Search - Rachel Pearson - We are Tilt __ Bright...
Hal 37 39
1. 37
1. Karakteristik Responden
1. Umur
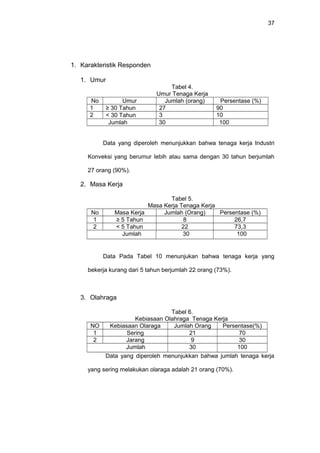
Tabel 4.
Umur Tenaga Kerja
No Umur Jumlah (orang) Persentase (%)
1 ≥ 30 Tahun 27 90
2 < 30 Tahun 3 10
Jumlah 30 100
Data yang diperoleh menunjukkan bahwa tenaga kerja Industri
Konveksi yang berumur lebih atau sama dengan 30 tahun berjumlah
27 orang (90%).
2. Masa Kerja
Tabel 5.
Masa Kerja Tenaga Kerja
No Masa Kerja Jumlah (Orang) Persentase (%)
1 ≥ 5 Tahun 8 26,7
2 < 5 Tahun 22 73,3
Jumlah 30 100
Data Pada Tabel 10 menunjukan bahwa tenaga kerja yang
bekerja kurang dari 5 tahun berjumlah 22 orang (73%).
3. Olahraga
Tabel 6.
Kebiasaan Olahraga Tenaga Kerja
NO Kebiasaan Olaraga Jumlah Orang Persentase(%)
1 Sering 21 70
2 Jarang 9 30
Jumlah 30 100
Data yang diperoleh menunjukkan bahwa jumlah tenaga kerja
yang sering melakukan olaraga adalah 21 orang (70%).
2. 38
4. Kebiasaan Merokok
Tabel 7.
Kebiasaan Merokok Tenaga Kerja
No Kebiasaan Merokok Jumlah(Orang) Persentase(%)
1 Merokok 12 40
2 Tidak Merokok 18 60
Jumlah 30 100
Data pada Tabel 12 menunjukan bahwa jumlah tenaga kerja
yang tidak memiliki kebiasaan merokok adalah 18 orang (60%)
2. Hasil Pengukuran
a. Kadar Debu Terpapar
Tabel 8.
Distribusi Frekuensi Kadar Debu di Industri
No Kadar Debu Jumlah Orang Persentase(%)
1 Masih Memenuhi Syarat 5 16,7
2 Tidak Memenuhi Syarat 25 83,3
Jumlah 30 100
Sumber Data primer terolah
Dari data yang diperoleh, kadar debu terpapar yang terhisap
oleh para tenaga kerja di lingkunga kerja industri konveksi banyak
yang tidak memenuhi syarat (≥10 gram) sebanyak 25 orang (83%),
sedangkan jumlah kadar debu yang masih memenuhi syarat hanya 5
orang (16,7%).
b. Alat Pelindung Diri (APD)
Tabel 9.
Distribusi frekuensi penggunaan APD saat bekerja
NO Penggunaan APD Jumlah (Orang) Persentase(%)
1 Memakai 3 10
2 Tidak Memakai 27 90
Jumlah 30 100
Sumber: Observasi
3. 39
Data pada Tabel 14 menunjukan bahwa tenaga kerja industri
konveksi yang menggunakan APD sebanyak 3 orang (10%),
sedangkan yang tidak menggunakan APD sebanyak 27 orang (90%).
c. Kapasitas Vital Paru
Tabel 10.
Distribusi frekuensi kapasitas vital paru tenaga kerja
No Kapasitas Vital Paru Jumlah(Orang) Persentase (%)
1 Normal 26 86,7
2 Tidak Normal 4 13,3
Jumlah 30 100
Sumber: Data Primer Terolah
Data pada table 15 menunjukan bahwa jumlah tenaga kerja yang
kapasitas vital parunya sudah tidak normal sebanyak 4 orang
(13,3%) sedangkan jumlah tenaga kerja yang jumlah yang kapasitas
vital parunya masih normal sebanyak 26 orang (86,7%)
3. Analisis Data
Data hasil pengukuran di uji menggunakan regresi linear dan chi
square dengan derajat kepercayaan 95% atau α=0,05, menggunakan
program SPSS 13,0 for Windows.
Berdasarkan hasil pengukuran kadar debu, observasi tentang
penggunaan APD ketika bekerja dan pengukuran kapasitas vital paru
dibuat table silang antara hubungan kadar debu dan kapasitas vital paru
serta hubungan penggunaan APD dengan kapasitas vital paru. Table
hubungan tersebut dapat dilihat sebagai berikut.: