2. 37 European Journal of Economics, Finance and Administrative Sciences - Issue 16 (2009)
private and government organization computer is at fore front. In Pakistan internet service was started
in 1995 along with upgrading telephonic infrastructure. IT progress is being monitored by IT Ministry
In Pakistan now(Kazmi, 2003; Rizvi, 2005). Many other departments like Electronic Government
Directorate, Pakistan Computer Bureau, Pakistan Software export board, Pakistan Telecommunication
Authority, Computer Society of Pakistan are also working side by side IT Ministry to boost IT in the
country(Ghauri, 2003, 2006a,2006b).
Financial sector is the major user and large investor in use of IT. It was among the first to
incorporate electronic data processing in its operations, through check handling, bookkeeping credit
analysis and ATMs (Bender, 1986; Martini,1999; Vasudevan, 2003). The computers usage in banking
sector first started in the early 1950s. Bank of America was the first user of computer in banking
sector. Automated Teller Machine (ATM). The use of ATM (Don Wetzel developed it in 1973) was
greatest achievement of online and real time automation by the commercial banks. ATM was first
installed at commercial bank in New York (Shelly and Cashman 2004). In Pakistan banking sector is
also progressing rapidly with growth of local and multinational banks (Mahmood 2006). Many local
banks are working in private sectors and started their operations since 1992 (SBP Report, 2005). It was
year 1965 when computer was introduced first time in banks in Pakistan. The main commercial banks
in private sectors i.e Habib Bank, United Bank, Muslim Commercial Bank started acquiring computer
to regulate their banking work since that year(Hussain, 2003, Akhtar 2006a, 2006b). The most recent
automated banking systems like Misys, Sibel and Fidility etc have been installed in many of the
Pakistani Banks (Kazmi 2004, 2005; Khan, 2005; Shaukat et.al, 2009).
Like banking, IT is the stone corner in every manufacturing industry as well. IT provides many
manufacturing based advantage to different organization to be the world-class manufacturer. In 1957
“Packages Ltd” was the first manufacturing company in Pakistan which introduced computers. After
that many other companies started using IT and now it is very common in all manufacturing
companies. Within the industrial sector, the use of Enterprise Resources Planning (ERP) software (an
integrated IT software system comprised of several modules that share a central database, designed to
automate business process across the enterprise (Thomas and Michael, 2001)) has increased. E.R.P
software packages such as SAP, Oracle etc. are being commonly used in many manufacturing
industries(Rizvi, 2005; Shahid, 2005)
According to Wheelen and Hunger(2000) the organization performance is an accumulated end
result of organizational process and activity. These are measured by organization’s working and
activity. The organizational management manage the organizational performance, control and customer
value, as it impact reputation of organization. Commonly organizational work measures include
organization effectiveness, productivity/efficiency and industry ranking (Wetherbe et.al.1999).
Efficiency is defined as “minimum utilization of resources and getting maximum output” and
effectiveness is “how well job gets done” (Robbin and Coulter, 2003).
Many researchers like Parthasamthy and Sethi(1993), Kelly(1994),Earls.al(1996) O’ Dell and
Elliot (1999) etc. have investigated the impact of IT on quantitative performance variable i.e
incomes/profits of the companies and founds positive impact. Whereas, Frankin (1997), Olalla (2000),
Schmid et. al (2001), Zee and Han (2002), Shaukat and Zafrullah(2009) etc. have seen the
increase/decrease in different qualitative performance indicators i.e. customer satisfaction, company
image, job interest of employees, stake holders confidence, interoffice link etc. and also have found
positive impact. This paper assesses organizational performance with regards to increase/decrease in
quantitative performance indicators i.e. mainly income for Pakistani organizations operating in banking
and manufacturing sectors after using informational technology.
Research Hypothesis “IT investments have impact on the performance of an organization”.
This can be translated in form of statistical hypotheses as:
H0: IT investments have no impacts on performance of the organizations.
H1: IT investments have impacts on performance of the organizations.
3. 38 European Journal of Economics, Finance And Administrative Sciences - Issue 16 (2009)
In order to test the above hypothesis, the performance of an organization has been measured in
quantitative/financial terms: The above mentioned hypothesis has been tested by measuring:
(a) Increase/decrease in net income, after usage of IT.
(b) Increase/decrease in the proportion of employees as the IT is used.
Time series data was available for these variables. Simple linear regression model was used
taking IT expenses as independent and income as dependant variables. Summary of regression results
are presented in Tables 3(a,b,c,d) to 4(a,b,c,d) and 5.
Methodology
There are two population groups for this research. One is the banking sector local and multinational
and the other is large manufacturing organizations again both local and multinationals, which are
making use of IT. In the sample from these sectors 48 companies, 24 in banking sector (12 foreign, 12
local) and 24 in manufacturing sector (12 foreign, 12 local) were taken. List of sample companies is
given in Annexure I. There are about 40 commercial banks operating in Pakistan. Out of these 40
banks, 24 banks are included in the sample because of the reasons that many other banks are either set
up in few years back or do not have well established network in Pakistan, therefore, they do not serve
the purpose of this research. There is no definite information available relating to the size of large
manufacturing sector. It is estimated however that about 1800 large-scale manufacturing units are
operating in Pakistan (Saeed, 2005). Therefore, in the sample, from the manufacturing sector, a total of
24 big organizations were randomly included. The sample size could have been increased but the
nature of problem seems to be similar in each case. So the chosen sample size is considered to be
sufficient. The companies selected are using latest IT and have well established IT set up. The
participants in the study were the senior managers of finance, human resources, marketing and IT
departments of the companies in sample. The data was collected from in-depth interviews using a
structured close-ended questionnaire, and from official documents, financial statements detailing
different aspects pertaining to the study.
In this research, the research problem has been analyzed for the period from 1994 to 2004,
because of the reasons that many companies operating in Pakistan were either not using IT before 1994
or IT had very little introduction and computers were being used merely as a word processing tools. So
it was difficult to measure any of significant IT impact on organizational performance before above
period. Most of the companies initially declined to provide the required financial(IT expenses and
Income) data citing confidentiality and busy schedules as reasons. However, by help of SBP and
SECP, the researchers managed to collect some data in one year period from these companies.
Therefore, Income & IT expense analysis for test of hypothesis is limited to those companies and for
those years for which the data is received. For analyses of Income Vs IT expense, the companies are
therefore divided into two groups as given in Table 1 & 2 below. The response rate for data was 42%
for the year 1990-2004 and 67% for the year 1999-2004.
The statistical software packages named SPSS 12.0 and Minitab 14.0 have been used for
analysis. According to the problem/requirement, statistical/financial techniques such as linear
regression model and ratio analysis have been applied.
4. 39 European Journal of Economics, Finance and Administrative Sciences - Issue 16 (2009)
Table 1: Group 1: (Companies for which data was available for year 1990 to 2004
A. Foreign Banks B. Local Banks
1. ABN Amro 1. Allied Bank Ltd.
2. Bank Of Tokyo 2. Bank Of Punjab
3. Deutsche Bank 3. First Women Bank Ltd.
4. HSBC Bank 4. Muslim Commercial Bank Ltd.
5. HBL AZ-Zurich 5. National Bank Ltd.
C. Foreign Manufacturing D. Local Manufacturing
1. I.C.I Pakistan Ltd. 1. Atlas Honda Ltd.
2. Pakistan Tobacco Ltd. 2. D.G. Cement
3. Suzuki Pakistan Ltd. 3. Lakson Tobacco
4. Simens Pakistan Ltd. 4. Service Industries
5. Uni Lever Pakistan Ltd. 5. Packages Ltd
Table 2: Group 2: In this group three more companies in each sector of group 1 are added and the data is
available for the years 1999-2004.
A. Foreign Banks B. Local Banks
1. ABN Amro 1. Allied Bank Ltd.
2. Bank Of Tokyo 2. Bank Of Punjab
3. Deutsche Bank 3. First Women Bank Ltd.
4. HSBC Bank Ltd. 4. Muslim Commercial Bank Ltd.
5. HBL AZ-Zurich 5. National Bank Ltd.
6. Citi Bank 6. Askari Bank Ltd.
7. Standard Chartered Bank 7. Bank Al-Habib Ltd.
8. Oman Bank Ltd. 8. Metropolitan Bank Ltd.
C. Foreign Manufacturing D. Local Manufacturing
1. I.C.I Pakistan Ltd. 1. Atlas Honda Ltd.
2. Pakistan Tobacco Ltd. 2. D.G. Cement
3. Suzuki Pakistan Ltd 3. Lakson Tobacco
4. Simens Pakistan Ltd. 4. Service Industries
5. Uni Lever Pakistan Ltd. 5. Packages Ltd
6. Bata Pakistan Limited 6. General Tyre Ltd
7. L.G Pakistan Limited 7. Indus Mtors Ltd
8. Reckitt Benkiser Limited 8. Honda Atlas Ltd
Results and Discussions
In the discussion below we examined the impact of IT on organizational Performance by performing
quantitative analysis of net income Vs IT expenses, total Vs IT employees. In interpretation, results of
each company are discussed separately then comparison has been made between local and foreign
banks, local and foreign manufacturing companies and banking and manufacturing sectors overall.
i. Banking Sector
a. Foreign Banks
The regression analysis shows that IT has no impact on the incomes of the Bank of Tokyo, Deutsche
Bank and HSBC bank as p-values or marginal significance levels for these banks are above 0.05. IT
has positive impact on the incomes of ABN Amro and Habib Bank AG Zurich as p-values or marginal
significance levels for both these banks are far below 0.05. All regression coefficients are positive
showing that with the increase in expenditure on IT, the incomes of these banks have substantially
increased. Analysis is also made for all foreign banks as a whole for group 1 and group 2 (Table 1 &
2). For both groups, it was found that IT has significant impact on income of all foreign banks
operating in Pakistan (p-value < 0.05).
5. 40 European Journal of Economics, Finance And Administrative Sciences - Issue 16 (2009)
Table 3(a): Regression Results Summary ( = 0.05) For Banking Sector
Year 1990-2004 Income = a+b(IT expense)
S/No Bank Name
Results
coefficient t-Statistics p-value
1 All Banks: n=10 7.179 8.661 .000
2 All Foreign Banks: n=5 4.458 10.573 .000
3 All Local Banks: n=5 7.726 5.929 .000
4 ABN Amro 7.487 15.187 .000
5 HBL AG Zurich 12.919 9.829 .000
6 Bank of Punjab 3.214 2.574 .023
7 First Women Bank 8.264 3.673 .003
8 Muslim Commercial Bank 10.791 8.871 .000
9 National Bank of Pakistan 7.316 2.510 .026
Table 3(b): Regression Results Summary ( = 0.05) For Manufacturing Sector
Year 1990-2004 Income = a+b(IT expense)
S/No Company Name
Results
coefficient t-Statistics p-value
1 All Companies: n=20 4.357 4.357 .000
2 All Local Manufacturing: n=5 4.148 3.071 .003
3 Atlas Honda 12.157 2.686 .019
4 Lakson Tobacco 12.509 7.885 .000
5 Suzuki 61.397 4.898 .000
6 P.T.C 1.956 2.182 .048
7 Siemens 1.624 5.927 .000
Table 3(c) Regression Results Summary ( = 0.05) For All Companies
Year 1999-2004 Income = a+b(IT expense)
S/No Company Name
Results
coefficient t-Statistics p-value
1 All Companies: n=20 0.02.798 2.685 .008
2 All Banking Sector: n=10 0.04.57 6.159 .000
3 All Local Banks: n=5 0.03923 4.432 .000
4 All Foreign Banks 0.155 9.453 .000
Table 3(d): Regression Results Summary ( = 0.05) For All Companies
Year 1999-2004 Income = a+b(IT expense)
S/No Company Name
Results
coefficient t-Statistics p-value
1 All Companies n=32 0.03496 4.258 .000
2 All Banking Sector n=16 0.04879 7.903 .000
3 All Local Banks n=8 0.04024 4.953 .000
4 All Foreign Banks n=8 0.09181 10.714 .000
5 All Local Manufacturing n=8 0.03068 2.680 .010
6. 41 European Journal of Economics, Finance and Administrative Sciences - Issue 16 (2009)
Table 4(a): Regression Results Summary ( = 0.05) For Banking Sector
Year 1990-2004 Income = a+b(IT expense)
S/No Bank Name
Results
coefficient t-Statistics p-value
5 Bank of Tokyo 15.788 2.128 .053
6 Deutsche Bank -.466 -.172 .866
7 HSBC 11.273 1.405 .184
9 Allied Bank Limited .288 .047 .963
Table 4(b): Regression Results Summary ( = 0.05) For Manufacturing Sector
Year 1990-2004 Income = a+b(IT expense)
S/No Company Name
Results
coefficient t-Statistics p-value
1 All Manufacturing Companies: n=10 .118 .285 .776
2 All Foreign Manufacturing: n=5 -.275 -.423 .674
3 D.G. Cement 1.171 .374 .715
4 Packages 70.706 1.869 .084
5 Service -.701 -.112 .913
6 I.C.I Pakistan .496 .226 .824
7 Uniliver Pakistan -.960 -.761 .460
Table 4(c): Regression Results Summary ( = 0.05) For all Companies
Year 1999-2004 Income = a+b(IT expense)
S/No Company Name
Results
coefficient t-Statistics p-value
1 All Manufacturing Sector: n=5 -0.0153 -.648 .519
2 All Local Manufacturing: n=5 0.01588 1.165 .254
3 All Foreign Manufacturing n=5 -0.03544 -1.210 .236
Table 4(d): Regression Result s Summary ( = 0.05) For all Companies
Year 1999-2004 Income = a+b(IT expense)
S/No Company Name
Results
coefficient t-Statistics p-value
1 All Foreign Manufacturing n=8 -0.005.53 -.203 .840
2 All Manufacturing n=16 0.001141 .073 .942
Table 5: Regression Results Summary For Total and IT Employees (n=20)
Year 1990-2004: IT employee % of the total employee = a+b(time)
S/No Organizations
Results
t-Statistics P-value
1 All Companies 20.886 .000
2 All Banks 13.576 .000
3 All Foreign Banks -1.288 .220
4 All Local Banks 13.953 .000
5 All Manufacturing 16.565 .000
6 All Local Manufacturing 12.428 .000
7 All Foreign Manufacturing 17.500 .000
Years: Independent variable IT Employees %age to Total Employees: Dependent variable
7. 42 European Journal of Economics, Finance And Administrative Sciences - Issue 16 (2009)
As given in Annexure II, total no of employees in foreign banks have been increased
continuously from the year 1990 to 2004, despite of the facts that IT has been applied in all operations
of the banks. The IT has not reduced the number of employees as anticipated by some circles due the
reasons that most of the banks in this sector have introduced new products or services during this
period, so the work load has also increased, therefore, staff strength has increased. It has also been
observed that there are floating trends in the strength of IT employees. As shown in Annexure II IT
employees have increased for years 1990-1993, decreased from 1994 to 1998 but again increased from
1999 onwards and that increase is due to increase in IT activities because of raised volume of
transactions, introduction of new products/services and increasing competition with the local banks in
offering online/ computerized services. The net income for these banks for the years 1990-2004 is PKR
11.429 billions and IT expenses are PKR 1.716 billions which comes to 15.02% of net income but net
income for these banks for the years 1999-2004 comes to PKR 18.616 billions and IT expense are PKR
2.460 billions which are 13.21% of net income.
b. Local Banks
It is revealed from regression analysis that IT has impact on the income of most of the local banks i.e.
Bank of Punjab, First Woman Bank, Muslim Commercial Bank and National Bank of Pakistan (p-vale
or marginal significance level is far below 0.05). But IT has no impact on income of one bank, i.e
Allied Bank (p-value > 0.05). Overall it is also found that IT has positive impact on income of all the
local banks for group 1 and 2 as for both groups (p-value <0.05).All regression coefficients are also
positive which shows that with the increase in expenditure on IT, the incomes of these banks have
increased significantly. Table 3(a).
As shown in Annexure II, there has been decrease in total no of employees of local banks. It is
not because of IT but it is due to restructuring and privatization of most of local banks during that span
of time. For right sizing purpose many employees were laid off by offering ‘golden hand shakes’
schemes. Contrary, as also presented in Annexure II, there has been gradual increase in the IT
employees, due to increase in workload for up gradation, computerization/making online of many
branches as per industry or customer need. Moreover, net income for these banks for the years 1990-
2004 is PKR 28.040billions and IT expense are 4.186 billions with a ratio of 14.93%, whereas net
income for these banks for the years 1999-2004 is PKR 28.710 billions and IT expenses are
4.479billions with an increased ratio of 15.60%.
c. All Banks
Turning to the overall performance of all the banks for group 1 & 2, it is observed that IT expenditure
has impact on the income of all these banks (p-values< 0.05). A positive regression coefficient
supplements our results that increase in expenditure on IT significantly increases the incomes of these
banks.
To further examine the performance, trend analysis for IT spending and net income is carried
out. It is noted that there is increase in income with proportional increase in IT expenditure of all
banks. Detailing it, the net income for all the banks for the years 1990-2004 is PKR 39.470 billions, IT
expenses are 5.902 billions, which are 14.95% of net income. The net income for all the banks for the
years 1999-2004 for group 2 is PKR 47.327 billions and IT expenses are 6.939 billions, which are
14.66% of net income. While the net income for all foreign banks for the year 1999-2004 is PKR 7.44
billions and IT expenses are 1.050billions which are 14.12% of the net income for the same period, but
these expenses are 61.20% of total IT expenditure out of the year 1990-2004. That means that the
companies have been spending large amounts during the last six years in their IT operations. The same
case is for all local banks i.e. the net income for all local banks for the year 1999-2004 is PKR 18.773
billions and IT expenses are 3.454billions which are 18.40% of the net income for the same period but
these are 82.53% of total IT expenditure from the year 1990-2004. That also shows that there are high
increasing trends in IT expenditures in local banks in the past six years (1999-2004). Surprisingly, the
same results are found for the entire banking sector i.e. the net income for all the banks for the year
8. 43 European Journal of Economics, Finance and Administrative Sciences - Issue 16 (2009)
1999-2004 is PKR 26.213 billions and IT expenses are 4.505 billions which are 17.19% of the net
income for the same period but these expenses are 76.33% of total IT expenditure for the year 1990-
2004. It indicates that there is high increase in IT expenditures in the entire banking sector during the
years 1999-2004.
To investigate the linkage between IT expenditure and increase/decrease in number of total and
IT employees, we observed that during the sample period, the number of IT employees have increased
in the banking sector but total employees have been decreased Annexure II. Further, our regression
analysis also shows (Table 5) that this increase has positive impacts on income (p-value < 0.05).
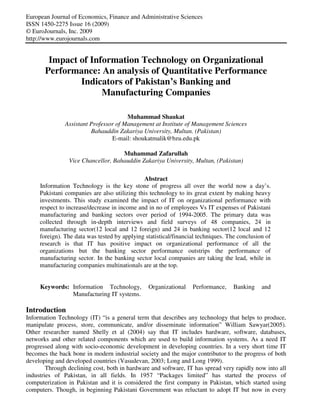
Table 6(a,b,c) and Figures 1 to 3 report the summary of net income/ IT expenses and %
increase/decrease of income to expenses.
Table 6(a): Income & IT Expense Comparison for All companies for the year 1990-2004
For Group 1: n=20
Sector Net Income IT Expenses Expenses %of income
Foreign Banks 11,429,932,000 1,715,997,260 15.02
Local Banks 28,040,686,000 4,185,681,800 14.93
Total Banking Sector 39,470,618,000 5,902,679,060 14.95
Local Manufacturing 14,118,508,000 1,374,077,480 9.73
Foreign Manufacturing 22,371,542,000 10,453,731,000 46.73
Total Manufacturing Sector 36,490,050,000 11,827,808,480 32.41
Total All Companies 75,960,668,000 17,730,487,540 23.34
Figure 1:
Comparison of Income & IT Expenses for Com apanies for the year 1990-2004
0%
10%
20%
30%
40%
50%
60%
70%
80%
90%
100%
F
oreign
B
anks
Local
B
anks
Tatal
B
anking
S
ector
Local
M
anufacturing
F
oreign
M
anufacturing
Tatal
M
anufacturing
S
ector
Total
A
ll
C
om
panies
E
xp
e
n
se
%
o
f
Inco
m
e
Series1 Series2
Series 1 Show the Income Series 2 Show the Expense % of Income
Table 6(b): Income & IT expense Comparison for all companies for the year 1999-2004
For Group 1: n=20
Sector
Net Income IT Expenses
Expenses %of
income
%age of 1999-2004 expenses to
1990-2004 Expenses
Foreign Banks 7,440,175,000 1,050,855,000 14.12 61.2
Local Banks 18,773,824,000 3,454,532,500 18.4 82.53
Total Banking Sector 26,213,999,000 4,505,387,500 17.19 76.33
Local Manufacturing 9,791,169,000 950,434,480 9.71 69.17
Foreign Manufacturing 16,439,359,000 5,934,785,000 36.1 56.77
Total Manufacturing Sector 26,230,528,000 6,885,219,480 26.25 58.21
Total All Companies 52,444,527,000 11,390,606,980 21.72 64.24
9. 44 European Journal of Economics, Finance And Administrative Sciences - Issue 16 (2009)
Figure 2:
Com parison of Incom e & IT Expenses for Com apanies for the year 1999-2004
0%
20%
40%
60%
80%
100%
F
oreign
B
anks
L
ocal
B
anks
T
atal
B
anking
S
ector
L
ocal
M
anufacturing
F
oreign
M
anufacturing
T
atal
M
anufacturing
S
ector
T
otal
A
ll
C
om
panies
E
x
p
e
n
s
e
%
o
f
In
c
o
m
e
Series1 Series2
Series 1 Show the Income Series 2 Show the Expense % of Income
Table 6(c): Income & IT Expense Comparison for all Companies for the year 1999-2004
For Group 2: n=32
Sector Net Income IT Expenses Expenses %of income
Foreign Banks 18,616,763,000 2,460,082,000 13.21
Local Banks 28,710,716,000 4,479,494,500 15.60
Total Banking Sector 47,327,479,000 6,939,576,500 14.66
Local Manufacturing 16,455,436,909 1,436,243,780 08.73
Foreign Manufacturing 17,604,147,000 6,055,853,900 34.40
Total Manufacturing Sector 34,059,583,909 7,492,097,680 22.00
Total All Companies 81,387,062,909 14,431,674,180 17.73
Figure 3:
Comparison of Income & IT Expenses for Comapanies for the year 1999-2004
0%
20%
40%
60%
80%
100%
Foreign
Banks
Local
Banks
Tatal
Banking
Sector
Local
Manufacturing
Foreign
Manufacturing
Tatal
Manufacturing
Sector
Total
All
Companies
Expense
%
of
Income
Series1 Series2
Series 1 Show the Income Series 2 Show the Expense % of Income
ii. Manufacturing Sector
a. Local Manufacturing Companies
The regression analysis shows that IT has positive impacts on the incomes of the local manufacturing
companies i.e Atlas Honda and Lakson Tobacco (p-values < 0.05). But IT has no impact on the income
of D.G. Cement, Packages and Services Industries, (p-value > 0.05).
Further analysis for all local manufacturing companies for the years 1990-2004 and 1999-2004
shows that IT has positive impacts on income of all the local companies as p-value is far below .05 for
group 1 and 2 (Table 1 & 2). The regression coefficient for these companies is positive, which
indicates the decisive impact of IT on income. At the same time, net income for these companies for
the years 1990-2004 is PKR 14.118 billions and IT expenditures are 1.374 billions which are only
9.73% of net income. Whereas, net income for the year 1999-2004 is 9.791 billions and IT expenses
10. 45 European Journal of Economics, Finance and Administrative Sciences - Issue 16 (2009)
are 950,434,480 that are 9.71% of the net income of 1999-2004 but 69.17% out of total IT expenditure
of 1990-2004. For group 2 the net income for these companies for the years 1999-2004 is PKR 16.455
billions and IT expense are 1.436 billions which are low as 8.73% of net income.
As seen in Annexure II, there is a gradual increase in total and IT employees till year 2002. It
is due to the facts that some of these companies have expanded their operations during these years and
consequently the volume of transaction/job has been increased, resulting therein an increase in staff
strength. After year 2002, there is a slight decrease in IT employees because of the reasons that some
of these companies have implemented S.A.P and their major IT systems are being maintained by
outsourced staff of SAP provider.
b. Foreign Manufacturing Companies
It has also been observed from regression analysis that IT has no impact on the incomes of I.C.I and
Unilever Pakistan Ltd (p-values > 0.05). Furthermore there are three companies, SIMENS Pakistan
Ltd, Suzuki Ltd and P.T.C for which IT has positive impacts on the income (p-value< 0.05). Our
analysis for group 1 and for group 2 presents that IT has no impacts on income of foreign companies as
overall (p-value>0.05). The net income for these companies for the years 1990-2004 is PKR 22.371
billions and IT expense are 10.453 billions, which are high as 46.73%. Where as net income for the
year 1999-2004 is 16.439 billions and IT expenses are 5.934 billions, which are 36.10% of the net
income but 56.77% of the total IT expenditure from 1990-2004.
For group 2, net income for the years 1999-2004 is PKR 17.604 billions and IT expense are
6.055 billions, which are 34.40% of net income.
Like local companies, there has been an increase in total and IT employees. Annexure II
represents these results. Again this increase is considered due to expansion in production over the
period of last ten years. It is because of this, that the volume of transactions/jobs and employees have
been increased
c. All Manufacturing Companies
The overall analysis of all the manufacturing companies for group 1 & 2 further validated that IT has
no impacts on income of all the manufacturing companies (p-value >.05). But surprisingly, there is
marvelous increase in the net income for all the manufacturing companies for the years 1990-2004, i.e.
PKR 36.490 billions and IT expense are 11. 827 billions being 32.41% of net income. For the years
1999-2004 net income for these companies is 26.230 billions and IT expenses are 6.885 billions which
are 26.25% of net income. There is an increase in the IT expenses during the last six years i.e. 1999-
2004 as IT expense ratio of net income is 58.21% out of the total IT expenses for the years 1990-2004
despite of the above facts that IT is not contributing more to incomes of these companies. There is an
increase in total and IT employees and this increase is due to the same reasons as mentioned above.
Annexure II presents these effects clearly.
For group 2 the net income for all the manufacturing companies for the years 1999-2004 is
PKR 34.059 billions and IT expense are 7.492 billions which are 22% of net income. The regression
coefficient is positive for this group. Similar to group 1, the same pattern of increase in total and IT
employees appears.
It is more obvious if we look into the computer usage statistic of manufacturing companies that
only those manufacturing companies (local & foreign) dominate the scene which have excellent IT
systems and have also implemented world class S.A.P (ERP) systems.
iii. All Companies in Both the Sectors
After analyzing the performance of individual sector, the analysis is made to know about performance
of all the companies in banking and manufacturing sectors for group 1 and 2. As discerned, IT has
positive impacts on income of all the companies (p-value<0.05) Table 4(c,d). The regression
coefficient is also positive which shows that there is an increase in income after increase in IT
expenses. So far net income for all the manufacturing companies for the years 1990-2004 is concerned,
11. 46 European Journal of Economics, Finance And Administrative Sciences - Issue 16 (2009)
it is PKR 75.960 billions and IT expenses are 17. 730 billions which are 23.34% of net income for
1990-2004. For the years 1999-2004 net income for all companies is 52.444 billions and IT expenses
are 11.390 billions which are 21.72% of net income. Similarly, net incomes for group 2 for all the
companies for the years 1999-2004 are PKR 81.387 billions and IT expenses are 14.431 billions which
are 17.73% of net income. There appears to be constant increasing trends in the IT expenditures during
the last six years i.e. 1999-2004 in both the sectors. As the IT expense for these years for both the
sectors are 64.24% out of total IT expenses for the years 1990-2004.
So far as total and IT staff strength is concerned as reported in graph in Annexure II, there is
an increase in IT but decrease in total staff and reasons for this increase have already been discussed in
detail in individual banking and manufacturing sections.
Conclusions
IT has revolutionized the entire world. It has turned world in global village. The companies are using
IT to improve organizational performance. This use has grown at an astonishing rate over the past three
decades with latest IT techniques and spending on IT has increased tremendously by the companies. It
would appear from above analyses that IT in Pakistan is being applied aggressively both in
manufacturing and banking sectors as these companies investing billions of rupees on it. It is also
evident that it is being used more efficiently in banking sector than the manufacturing sector. The
following salient points of above discussion are worth stressing 1) the local banking sector of Pakistan
is using IT more than the foreign banks because of intensive competition and increased branch network
2) though multinationals in Pakistan are seen as a means of bringing in new technology and work
practices and providing training grounds for the work force but there is high rise in IT investments in
local baking sector in the latest IT systems in the recent years as compared to foreign banking sectors
percentage of IT expenses for the years 1999-2004 for total banking sector, are 76.33%, out of their
total IT expenses for the years 1990-2004. 3) the percentage increase in IT expenses in local banks is
82.53% for the year 1999-2004 out of expenses of the years 1990-2004, which is much higher than the
foreign banks where %age increase is 61.20%. 4) in comparison of local versus foreign manufacturing
companies mixed trends have been observed in IT spending. The IT expenses percentage is 69.17%
and 56% respectively for both the sectors out of incomes of years 1990-2004. But surprisingly,
percentage of IT expense for local and foreign companies as a whole for the years 1990-2004 are
29.73% and 42.33%. For group 2 these expenses %ages are 18.33 and 34 respectively. It is, therefore,
evident that overall foreign manufacturing sector is investing more in IT than the local manufacturing
sector. 5) overall, there is remarkable increase in the IT expenses and in income in return, of all the
companies, given to the facts that IT expenses are 17.730 billions in 1990-2004 and in 1999-2004,
these are 11. 390 billions which are 64.24% of total IT expenses. The net income is 75.960,668,000 in
the years 1990-2004 and for the years 1999-2004 it is 52,44,527,000. The percentage increase in net
income thus comes to 69.04% for year 1990-2004.
We found strong evidence through above facts that though manufacturing sector is investing
much more in IT but the banking sector surpass the manufacturing sector in performance as their
incomes are very high. On the other hand the study also detected that there is an increase in IT
employees in both the sectors due to increased work because of expansion of operations of the
companies over the years but decrease in total employees because of implementation of down/right
sizing policies in local baking sector since 1990s. In line with above results, in conclusion, we say that
IT investments have positive impacts on the performance of the organizations and we accept our
research hypotheses.
12. 47 European Journal of Economics, Finance and Administrative Sciences - Issue 16 (2009)
References
1] Akhtar, S.(2006a). ‘Roadmap of financial sector of the country’, Business Recorder,
Wednesday, 17 May, 2006.
2] Akhtar, S.(2006b). ‘Pakistan’s Financial Services Sector -A Future Perspective’, Money Plus,
July 31 2006.
3] Bender, D. (1986). ‘Financial impacts of information processing’, Journal of Management
Information System, 3, 2: 232-238.
4] Brynjolfsson, E.(1993). ‘Productivity paradox of information technology’, Communication of
the ACM, 12: 66-67.
5] Franklin, C.F. Jr.1(997), ‘Emerging Technology: Enter the Extranet’, CIO Magazine, May 15,
Available online: www.cio.com/archive/051597_et_content.html.
6] Ghauri S.(2003). ‘IT status in Pakistan, Pakistan & Gulf Economist’, XXIII, 94, December. 6-
12, 2003: 34.
7] Ghauri S.(2006a). ‘A good start of 2006 for IT industry’, The Nation, Monday, February 27,
2006.
8] Ghauri S.(2006b). ‘Prospects and problems of IT industry’, The Dawn, Monday, February 06,
2006.
9] Hussain, A.S. (2003). ‘Economies of IT: Pakistan IT sector Analysis, Economic outlook’,
October 2003: 21.
10] Khan A. U.(2005).’IT initiatives from the government’. The Nation, Monday, March 28, 2005.
11] Kazmi S. H.(2003). ‘IT in Core Industries’, Pakistan & Gulf Economist, XXII, 26, June 30-July
6, 2003: 12-13.
12] Kazmi S. H..(2004). ‘E-Banking’, Pakistan & Gulf Economist, XXIII, no 48, Nov. 29-Dec. 5,
2004: 12-14.
13] Kazmi S. H.(2005). ‘A lot needs to be done to make IT use common’, Pakistan & Gulf
Economist, XXIV, 49, December 5-11, 2005: 14.
14] Kelley, M. R. (1994). ‘Productivity and Information Technology: The elusive connection’,
Management Sciences. 40,11: 1406-1425.
15] Long L. and N. Long. (1999). ‘Computers’, Prentice Hall Inc. U.S.A: 71.
16] Loveman, G.W.(1994), ‘An assessment of the productivity impact on information
technologies’, Research Studies, Information Technology Press, Cambridge, MA: 84-110.
17] Mahmood J. (2006). ‘Another productive year for Banks’, Money Plus July 17,2006.
18] Martini M.(1999). ‘Impact of IT on the Banking and financial industry’, Review of economic
conditions, 1999, 2:203-223.
19] O’Dell,and S.C. Elliot.(1999). ‘Sharing knowledge and best practices: the how and whys of
tapping your organization’s hidden reservoirs of knowledge’, Health-care Forum Journal, 42:
34-37.
20] Olalla, M. F.(2000). ‘IT in business process reengineering’, International Advances in
Economic research, 6, 3: 581-590.
21] Parthasarthy, R and S.P. Sethi. (1993). ‘Relating strategy and structure to flexible automation:
A test of fit and performance implications’, Strategic management Journal, 14,7: 529-549.
22] Rizvi S. A.(2005). ‘IT making strides in Pakistan’, Pakistan & Gulf Economist, XXIV, 49, Dec.
5-11, 2005: 12-13
23] Robbins S. P. and M. Coulter.(2003). ‘Management’, 7th
Edition, Prentice Hall, Int. U.S.A:79.
24] Saeed, K. A.(2005). ‘Economy Of Pakistan’. Khawaja Amjad Saeed Publisher, 2005: 75.
25] Schmidt, J.B, M.M. Montoya-Weiss, and A.P.Massey. (2001). ‘New product development
decision-making effectiveness: Comparing individuals, face-to-face teams, and Virtual teams’,
Decision Sciences, 32,4: 575.
26] Shahid M.(2005). ‘A real IT professional in Pakistan’, The News International, Wednesday,
March 30, 2005.
13. 48 European Journal of Economics, Finance And Administrative Sciences - Issue 16 (2009)
27] Shaukat, M., M. Zafarullah and R.A.Wajid.(2009). “Impact of IT software systems on
organizational performance: An overview of Pakistani companies’, J.Agri.Soc. Sciences, 5:7-
12.
28] Shaukat, M. and M. Zafarullah (2009). “Impact of Information Technoloy on Organizational
Performance: An Analysis of qualitative performance indicators of Pakistan’s Banking and
Manufacturing Companies”, European Journal of Economics, Finance and Administrative
Sciences, issue 16. under print.
29] Shelly G.B, M.E. Cashman.(2004). ‘Discovering Computers: A gateway to information Web
Enhanced’, Thomson Course Technology Boston, U.K. 39: 74-78.
30] State Bank of Pakistan.(2005). ‘Report on Pakistan’s banking infrastructure statistic’: 1.
31] Thomas F.W. and H.K. Michael. (2001). ‘ERP: Making it Happen’, John Wiley & Sons Inc.,
Canada: 4-5.
32] Vasudevan A.(2003). ‘Some perspectives on IT up gradation in the financial sectors’, Journal
of Indian Institute Of Bankers. 74,1, Jan-2003:36-38.
33] Wheelen T.L and J.D. Hunger. (2000). ‘Strategic Management’, 7th
edition, Prentice Hall,
U.S.A:231-235.
34] Wetherbe J, E. Turban, and E. Mclean.(1999). ‘Information Technology for management:
Making connections for strategic advantages’, 2nd
edition, New York, NY, John Wiley and
Sons Inc.
35] William, B.K and S.C. Sawyar. (2005). ‘Using Information Technology’, 6th
edition,
McGraHill Publishing Co. U.S.A: 3,4,147
36] Zee W. and V.D..Han. (2002). ‘Measuring the value of Information Technology’, IRM press,
U.S.A, 7: 47-48.
Annexure I
List of companies in sample: Banking Sector.
List of Local Banks List of Foreign Banks
1 Habib Bank Ltd. 1 American Express Bank Ltd.
2 National Bank Ltd. 2 Citibank N.A.
3 United Bank Ltd. 3 Habib Bank AG Zurich
4 Muslim Commercial Bank Ltd 4 Algemene Bank Netherland (ABN Amro)
5 Bank Al Habib Ltd 5 Internaional Islamic Bank
6 Metropolitan Bank Ltd. 6 Deutsche Bank A.G.
7 Bank Of Punjab 7 Rupali Bank Ltd.
8 Askari Commercial Bank Ltd. 8 Standarad Charterd Bank
9 Bank Alflah Ltd. 9 Oman International Bank Ltd.
10 Allied Bank Ltd. 10 Bank Of Tokyo Ltd.
11 Faisal Bank Ltd. 11 Mashraq Bank Ltd.
12 First Women Bank Ltd. 12 Hong Kong & Shangai Bank Ltd.
14. 49 European Journal of Economics, Finance and Administrative Sciences - Issue 16 (2009)
List of companies in sample: Manufacturing Sector.
List of Pakistani Manufacturing Companies. List of Foreign Manufacturing Companies
1 Packages Ltd 1 Uni Lever Pakistan Ltd.
2 General Tyres Ltd. 2 Reckett Benkiser Pakistan Ltd
3 D.G. Khan Cement Ltd 3 Procter & Gamel Pakistan Ltd.
4 Atlas Honda Cars Ltd. 4 Philips Electrical Company Ltd.
5 Pakistan Steel Ltd. 5 Siemens Pakistan Ltd.
6 P.E.C.O Ltd. 6 I.C.I Pakistan Ltd.
7 Lakson Tobacco Ltd. 7 Nestle Pakistan Ltd.
8 Indus Motor Ltd. 8 Colgate Pakistan Ltd.
9 Service Industries Ltd 9 Pakistan Tobacco Ltd.
10 P.E.L Ltd. 10 Suzuki Pakistan Ltd.
11 Dawllance Pakistan Ltd 11 Bata Pakistan Ltd.
12 Honda Atlas Ltd. 12 L.G Pakistan Ltd.
Total and IT Employee Statistics
Annexure II
All Foreign Banks All Local Banks All Banks
Years IT emply % Tot Emply IT emply % Tot Emply IT emply % Tot Emply
1990-91 4.176904177 407 0.397944681 45735 0.431277361 46142
1991-92 5.213270142 422 0.435039241 45743 0.478717643 46165
1992-93 5.882352941 442 0.484961834 45983 0.53634895 46425
1993-94 5.052631579 475 0.507420225 47101 0.552799731 47576
1994-95 5.350553506 542 0.524067097 47513 0.578503798 48055
1995-96 4.915254237 590 0.530067262 49805 0.581406886 50395
1996-97 4.380664653 662 0.550511879 51770 0.598870919 52432
1997-98 3.362391034 803 0.677014899 44903 0.72419376 45706
1998-99 3.369434416 831 0.74828114 41161 0.80015241 41992
1999-00 4.026845638 894 0.801463767 38804 0.874099451 39698
2000-01 4.057017544 912 0.814461154 39167 0.888245715 40079
2001-02 4.618689581 931 0.893144512 37284 0.983906843 38215
2002-03 4.771784232 964 1.083914002 33582 1.186823366 34546
2003-04 4.688995215 1045 1.148781997 33949 1.256295788 34944
2004-05 4.523026316 1216 1.170427016 34261 1.285339798 35477
All Local Manufacturing All Foreign Manufacturing All Manufacturing All Companies
Years IT emply % Tot Emply IT emply % Tot Emply IT emply % Tot Emply IT emply % Tot Emply
1990-91 0.357698289 12860 0.611028316 13420 0.487062405 26280 0.451520256 72422
1991-92 0.392821382 12983 0.62193605 13667 0.510318949 26650 0.490283595 72815
1992-93 0.4 13500 0.614549092 13994 0.509202008 27494 0.526251708 73919
1993-94 0.420044215 13570 0.624699664 14567 0.525997796 28137 0.542839407 75713
1994-95 0.438308131 13689 0.682035193 14662 0.564353991 28351 0.573253409 76406
1995-96 0.427890011 14256 0.758807588 14760 0.596222774 29016 0.586820466 79411
1996-97 0.463251054 14463 0.790460879 14928 0.629444388 29391 0.609852975 81823
1997-98 0.495799477 14522 0.819399107 15011 0.660278333 29533 0.699105517 75239
1998-99 0.528592023 14567 0.849087894 15075 0.691586263 29642 0.755227964 71634
1999-00 0.581037665 14629 0.952569954 15117 0.769851409 29746 0.829445308 69444
2000-01 0.610727562 15064 0.95444971 15192 0.783315706 30256 0.843107983 70335
2001-02 0.64618225 15166 0.984445757 15237 0.815708976 30403 0.909382378 68618
2002-03 0.611192462 15707 0.969397453 15783 0.790727215 31490 0.846507965 66036
2003-04 0.631911532 15825 1.004548901 15828 0.818247875 31653 1.047308956 66647
2004-05 0.600529879 16985 1.032030709 15891 0.809100864 32876 1.056281363 68353