SlideShare a Scribd company logo
1 of 98
The White Standard: Racial Bias in Leader Categorization
Ashleigh Shelby Rosette
Duke University
Geoffrey J. Leonardelli
University of Toronto
Katherine W. Phillips
Northwestern University
In 4 experiments, the authors investigated whether race is
perceived to be part of the business leader
prototype and, if so, whether it could explain differences in
evaluations of White and non-White leaders.
The first 2 studies revealed that “being White” is perceived to
be an attribute of the business leader
prototype, where participants assumed that business leaders
more than nonleaders were White, and this
inference occurred regardless of base rates about the
organization’s racial composition (Study 1), the
racial composition of organizational roles, the business
industry, and the types of racial minority groups
in the organization (Study 2). The final 2 studies revealed that a
leader categorization explanation could
best account for differences in White and non-White leader
evaluations, where White targets were
evaluated as more effective leaders (Study 3) and as having
more leadership potential (Study 4), but only
when the leader had recently been given credit for
organizational success, consistent with the prediction
that leader prototypes are more likely to be used when they
confirm and reinforce individualized
information about a leader’s performance. The results
demonstrate a connection between leader race and
leadership categorization.
Keywords: racial bias, prototypical leadership characteristics,
stereotypes, leadership categorization,
diversity
Substantial progress has been made by underrepresented minor-
ities in Corporate America since the 1960s civil rights
movement
knocked down opaque racial barriers and championed equal op-
portunity in organizational settings. Over time, African
Americans
have come to occupy a greater percentage of entry-level
positions
and more middle management roles (Tomaskovic-Devey et al.,
2006; U.S. Bureau of Labor Statistics, 2004). In addition, other
racial minority groups, such as Asian Americans (Takaki, 1989;
Woo, 2000) and Hispanic Americans (GAO Report, 2006), have
also made noticeable inroads at lower and middle levels in busi-
ness organizations. Although progress is evident at some
positions,
racial minorities are still less visible in top leadership positions
than would be expected on the basis of population base rates
(The
Alliance for Board Diversity, 2005; Corporate Board Initiative,
2006; Fortune, 2006; McCoy, 2007; Thomas & Gabarro, 1999).
Given that explicit racial barriers no longer exist, what is
prevent-
ing well-trained racial minorities from advancing within the
orga-
nizational hierarchy to become leaders in U.S. companies?
One important determinant for whether employees advance to
leadership positions is how their leadership skills and task com-
petencies are evaluated (Connelly et al., 2000; DeVries, 2000;
Hollander, 1960; Levinson, 1980; Lord, de Vader, & Alliger,
1986). Leadership evaluations are an assessment of an organiza-
tion member’s ability to produce positive outcomes for the
orga-
nization and affect who is appraised favorably and who is
allowed
to lead the organization (Calder, 1977; Lord & Maher, 1991;
Meindl & Ehrlich, 1987; Meindl, Ehrlich, & Dukerich, 1985).
According to leadership categorization theory, leaders will be
evaluated as most effective when they are perceived to possess
prototypical characteristics of leadership (Lord & Maher, 1991).
Specifically, over time individuals develop a set of beliefs
about
the behaviors and characteristics of leaders. These beliefs
develop
into leadership categories, and from the various categories of
leadership evolve a standard example or typical leader category
known as a leadership prototype. Those leaders who possess
characteristics that are most consistent with the evaluators’
leader
prototype are appraised most favorably. Several studies have
shown that the fit of individuals’ characteristics to evaluators’
leadership prototypes affects leadership perceptions and
leadership
ratings across several domains, including gender (Brenner,
Tomk-
iewicz, & Schein, 1989; Eagly & Karau, 2002; Heilman, Block,
Martell, & Simon, 1989; Nye & Forsyth, 1991; Schein, 1973;
Scott
Ashleigh Shelby Rosette, Fuqua School of Business, Duke
University;
Geoffrey J. Leonardelli, J. L. Rotman School of Management,
University
of Toronto, Toronto, Ontario, Canada; Katherine W. Phillips,
Management
and Organizations Department, Kellogg School of Management,
North-
western University.
We are grateful for the support of our colleagues Jim Phillips,
Sim
Sitkin, Melissa Thomas-Hunt, and Leigh Thompson for their
helpful sug-
gestions and recommendations on earlier versions of this article.
We thank
Barbara Carlin, Bill Walker, Rick Larrick, and Lehman Benson,
who
assisted us with data collection. We are appreciative to Leigh
Plunkett
Tost, Moira Praxedes, and Catherine Shea, who worked as
research assis-
tants on this project. We are especially thankful to our
colleagues in our
respective departments for all of their support.
Correspondence concerning this article should be addressed to
Ashleigh
Shelby Rosette, Fuqua School of Business, Duke University, 1
Towerview
Road, P.O. Box 90120, Durham, NC 27701-0120. E-mail:
[email protected]
Journal of Applied Psychology Copyright 2008 by the American
Psychological Association
2008, Vol. 93, No. 4, 758 –777 0021-9010/08/$12.00 DOI:
10.1037/0021-9010.93.4.758
758
& Brown, 2006), culture (Ensari & Murphy, 2003), and politics
(Foti, Fraser, & Lord, 1982), yet the connection between race
and
leadership prototypes has been largely ignored.
The purpose of this article is to fill that research gap and to
examine leadership prototypes as one potential explanation for
racial bias in top leadership positions. That is, top leadership
positions are most frequently occupied by White leaders as op-
posed to racial minority leaders, and expectations regarding the
prototypical characteristics of the race of the leader may help to
explain why White leaders are preferred over racial minority
leaders. By examining this type of racial bias in leadership
posi-
tions, we can offer a more in-depth understanding of leadership
categorization and leadership prototypes as applied to U.S.
busi-
ness leaders. We propose that race, and specifically “being
White,”
may be a prototypical attribute of leadership.
When asked to consider the career advancement and perfor-
mance appraisals of others, many people in the United States
believe they yield to principles of meritocracy (Castilla, in
press;
Rosette & Thompson, 2005) and practice a philosophy of color-
blindness (Reitman, 2006; Wildman, 1996). That is, they
believe
that race is not important and does not affect their workplace
evaluations of others (Rosette, 2006). In stark contrast to these
assertions, we propose that race plays a critical role in
organiza-
tional settings, particularly when leadership evaluations are
con-
sidered. In this article, we explored the connection between
leader
race and leadership prototypes and tested whether, at least in
the
United States, Whites are perceived to be prototypical business
leaders and, if so, whether more favorable evaluations of White
relative to non-White leaders could be best explained by
leadership
categorization theory.
Leadership Categorization Theory
Leadership categorization theory is largely based on traditional
categorization theory, which describes how individuals develop
categories to help themselves organize and process information
efficiently (Rosch, 1978). Categories possess very distinct
features
(Crocker, Fiske, & Taylor, 1984), summarize images and labels
by
others in the environment (Cantor & Mischel, 1979), and are
comprised of similar, yet nonidentical members (Lakoff, 1987).
Previous empirical research has demonstrated that prototypes
evolve from categories and represent an original type, form, or
instance of something that serves as a typical example or
standard
of other things in the same category (Rosch & Mervis, 1975).
Specifically, a prototype represents a central tendency or
average
characteristic of the members of a category (Rosch, 1978; Smith
&
Medin, 1981). For example, within the context of a business
organization, the characteristics “a person” and “has followers”
are
common to most leaders. Characteristics such as these help to
distinguish one category (i.e., leaders) from another category
(i.e.,
nonleaders) and are said to be prototypical characteristics. That
is,
such characteristics provide a cognitive cue to the evaluator as
to
the likelihood that an entity falls in a particular category
(Beach,
1964; Kruschke & Johansen, 1999; Martignon, Vitouch,
Takezawa, & Forster, 2003; Reed, 1972).
Utilizing the basic concepts of categorization theory, Lord and
his colleagues developed leadership categorization theory
(Lord,
1985; Lord, Foti, & Phillips, 1982; Lord & Maher, 1991). In
contrast to other leadership theories that focus on differences in
performance or influence, such as charismatic leadership
(House,
1977), transformational leadership (Bass, 1985; J. M. Burns,
1978), and visionary leadership (Bennis & Nanus, 1985; Kouzes
&
Posner, 1987), leadership categorization theory investigates
eval-
uators’ perceptions of leaders. According to the theory,
evaluators
compare a target person with already preexisting knowledge
struc-
tures called leadership prototypes, which reflect the average
char-
acteristics of leaders in a given context. The process of
comparing
a target person with a leadership prototype is called a
recognition-
based process (Lord & Maher, 1990, 1991) and can influence
evaluators’ perceptions of targets. This recognition-based
process
can lead to a match or mismatch between the target person’s
traits
and the traits that are common to the evaluators’ leadership pro-
totype. With a match, the target individual is categorized as a
leader, but with a mismatch, the target is not categorized as a
leader. When a match occurs, target individuals who are
perceived
to be more prototypical leaders have been shown to be evaluated
more favorably (Eagly & Karau, 2002; Ensari & Murphy, 2003;
Nye & Forsyth, 1991; Phillips, 1984; Phillips & Lord, 1982;
Rush
& Russell, 1988; Scott & Brown, 2006). In this work, we sought
to investigate whether a person’s race may be part of the
business
leader prototype.
Race as an Attribute of the Leader Prototype
We posit that, at least in the United States, a central character-
istic of leadership is “being White” and accordingly, that
evalua-
tors will perceive that White leaders are more prototypical busi-
ness leaders than are leaders who are racial minorities. We
argue
that it is the development of evaluators’ leadership prototypes
that
likely leads to the incorporation of race into the leader
prototype
and, consequently, to the belief that prototypical business
leaders
are White leaders. According to Rosch’s (1978) categorization
theory, prototypes develop from familiarity with examples from
categories and encompass two distinct structural principles.
Pro-
totypes develop because people learn which characteristics are
central among members of a category (first principle) and which
are not as central among members of other categories (second
principle). Lord and Maher (1991) summarized Rosch’s
prototype
development process in this way:
. . .category prototypes develop from experience with examples
of
categories. Over time, people learn which attributes are both
widely
shared among category members (being high in family
resemblance)
and relatively rare among nonmembers of a category (being
high in
cue validity). . .. Prior to the development of a category
prototype,
categories are often defined on the basis of exemplars—
concrete
examples of specific category members. For example, someone
who
has no experience with military leaders might define this
category
based on his or her knowledge of one salient military leader (for
example, Eisenhower or Patton). But as experience with military
leaders accumulates, a more general and representative
composite of
military leaders would define the category. (p. 43)
Empirical work supports this prototype development process.
Through repeated interactions with examples of a given
category,
individuals have been shown to abstract characteristics from
these
observed examples to develop a prototype (Lord, Foti, & de
Vader,
1984; Rosch & Mervis, 1975). We posit that the exemplars of
leaders to which individuals are exposed are likely to be White,
759THE WHITE STANDARD
and thus, when individuals abstract attributes that are common
to
examples of business leaders but are perhaps less common to
examples of nonleaders, they will conclude that the average
leader,
the prototypical leader, must be White.
White exemplars of leaders may originate from two sources.
First, evaluators are presently and persistently exposed to White
individuals holding prominent leadership positions. Recent
busi-
ness statistics support this assertion. In the U.S. workforce,
more
than 87% of chief executive positions (U.S. Bureau of Labor
Statistics, 2006), 84% of the seats on Fortune 100 Boards of
Directors (The Alliance for Board Diversity, 2005), and more
than
97% of Fortune 500 chief executive officer (CEO) positions
were
held by Whites (Corporate Board Initiative, 2006; Fortune,
2006;
McCoy, 2007). Given the close alliance between politics and
business, political leaders may also provide salient exemplars.
In
2007, 96% of state governors (National Governors Association,
2007), 94% of U.S. Senators (U.S. Senate Statistics, 2007), and
83% of congresspersons in the U.S. House of Representatives
were
White (U.S. House of Representatives Statistics, 2007). It also
should be noted that these percentages are above those predicted
by the proportion of White individuals in the general U.S. popu-
lation, especially when the Hispanic population is considered as
a
separate category (61%; U.S. Census Bureau, 2006).
Second, and perhaps more important, U.S. history may also
influence leadership perceptions, as historically, both in politics
and in business, prominent leaders (and perhaps, many individu-
als’ first encounters with leadership exemplars) have been
White.
For example, all 43 U.S. presidents have been White. Moreover,
the more noted historical examples of American business
success
are of White entrepreneurs: in the 19th century, Andrew
Carnegie
(steel) and John D. Rockefeller (oil); in the 20th century, Henry
Ford (automobiles), Ray Kroc (McDonalds), Conrad Hilton (ho-
tels), and Ross Perot (technology services); and in the 21st
century,
Bill Gates (computer technology) and Steven Forbes (media).
Such
historical perceptions of White individuals in leadership
positions
reinforce the assertion that being White is a primary and
probable
characteristic of leadership.
Thus, we posit that being White is a central characteristic of the
business leader prototype. Moreover, we generate two novel
over-
arching predictions based on this position. First, if being White
is
an attribute of the business leader prototype, then observers will
assume that leaders more than nonleaders are White. Second,
given that prototypical leaders are evaluated more favorably
than
nonprototypical leaders (Eagly & Karau, 2002; Ensari &
Murphy,
2003; Nye & Forsyth, 1991; Phillips, 1984; Phillips & Lord,
1982;
Rush & Russell, 1988; Scott & Brown, 2006), and because we
propose that White leaders are perceived to be more
prototypical
than non-White leaders, race may lead to biased evaluations of
leadership through the process of leader categorization. That is,
leaders who are racial minorities receive worse performance
eval-
uations than White leaders because White leaders are perceived
to
be more similar to the leader prototype. These race differences
in
the leader prototypes may help explain why leaders who are
members of racial minorities receive worse performance-related
evaluations than do White leaders (see Cox & Nkomo, 1986;
Ford,
Kraiger, & Schechtman, 1986; Greenhaus & Parasuraman, 1993;
Greenhaus, Parasuraman, & Wormley, 1990; Jones, 1986;
Powell
& Butterfield, 1997; and Waldman & Avolio, 1991, for
examples
of race differences in performance evaluations).
Certainly, there may be other explanations of differences in the
evaluations of White and non-White leaders. For example, some
studies of leadership effectiveness have demonstrated that group
prototypes play a significant role in leadership evaluations
(Hains,
Hogg, & Duck, 1997; Hogg et al., 2006; Martin & Epitropaki,
2001; Pierro, Cicero, Bonaiuto, van Knippenberg, & Kruglanski,
2005; Platow & van Knippenberg, 2001; Platow, van Knippen-
berg, Haslam, van Knippenberg, & Spears, 2006; van
Knippenberg
& van Knippenberg, 2005). The more a leader represents the
prototypical characteristics of a group to which the evaluators
belong, the more favorably that leader will be evaluated. From
this
perspective, White evaluators will rate White leaders more
favor-
ably because White leaders are more prototypical of the evalua-
tors’ racial group. By contrast, a leadership prototype
explanation
would predict that, regardless of their racial group, evaluators
will
be likely to perceive White leaders more favorably than non-
White
leaders.
Alternatively, the more negative racial stereotypes of some
minorities could also be used to explain race differences in
lead-
ership evaluations. From this perspective, Whites and Asian
Amer-
icans, who are both generally associated with positive racial
ste-
reotypes, such as being smart, industrious, and ambitious (Hurh
&
Kim, 1989; Kitano & Sue, 1975; Lee, 1994), would be evaluated
more favorably than Hispanic Americans and African
Americans,
who are frequently associated with negative racial stereotypes,
such as being lazy, ignorant, and incompetent (P. Burns &
Gimpel,
2000; Devine & Elliot, 1995; Dixon & Rosenbaum, 2004;
Krueger, 1996; Mackie, Hamilton, Susskind, & Rosselli, 1996;
Marin, 1984; Plous & Williams, 1995). Some evidence supports
this stereotype explanation. Chung-Herrera and Lankau (2005)
demonstrated that White evaluators identified a higher
correspon-
dence between the stereotypical characteristics of White and
Asian
American managers and the characteristics of a leader prototype
than between the stereotypical characteristics of African
American
and Hispanic American managers and characteristics of a leader
prototype. In other words, differences in evaluations of
managers
could be due to differences in race stereotypes rather than fit
with
the leader prototype.
However, this negative racial stereotype explanation is not
unique to leaders, as it has been shown to persist among evalua-
tions of nonleaders as well. For example, empirical studies on
aversive racism, a subtle form of racial bias that stems from
negative race stereotypes, have demonstrated a consistent bias
against racial minorities in favor of Whites in nonleadership po-
sitions (Aberson & Ettlin, 2004; Dovidio & Gaertner, 2000).
According to our leadership prototype prediction, the leader
pro-
totype includes the attribute “being White,” not merely
stereotyp-
ical characteristics that are associated with Whites in both
leader
and nonleader categories. Moreover, whereas a race stereotype
explanation suggests that White and Asian American leaders
would be evaluated more favorably than African American and
Hispanic American leaders, it is our prediction that White
leaders
will be evaluated more favorably than Asian American leaders
as
well.
Overview of Studies
Across four studies, we tested whether being White was part of
the U.S. business leader prototype and, if so, how it might
influ-
760 ROSETTE, LEONARDELLI, AND PHILLIPS
ence observers’ leadership evaluations. In the first two studies,
we
investigated whether individuals were more likely to assume
that
business leaders rather than nonbusiness leaders were White and
whether assumptions about a leader’s race were inferred from
the
leader prototype or from race base rates in the overall
organization
(i.e., the racial composition of the organization’s members;
Study
1), race base rates in organizational positions, the leader’s
business
industry, or the race of the racial minorities in the organization
(Study 2). In the final two studies, we investigated whether a
leader prototype explanation could best explain differences in
White and non-White leader evaluations by investigating the
con-
sequences of a leader’s race for evaluations of leader
effectiveness
(Study 3) and leadership potential (Study 4).
In these studies we tested our predictions with different sample
populations (undergraduates, master of business administration
[MBA] students, and graduate students), evaluating leaders in
different roles (project leader, division leader, CEO), across
dif-
ferent industries (social services, financial services), and with
different racial characteristics (White, Black, Hispanic, and
Asian). Altogether, we think the data contribute to the
connection
between leader race and a business leader prototype and have
implications for workplace diversity, performance evaluation,
and
career management.
Study 1: Base Rates and Leader Race
This study tested the two structural principles of prototype
development: whether being White was perceived as a central
characteristic to the business leader prototype (first principle)
and
whether being White was perceived as less central to a nonbusi-
ness leader category, employees (second principle). We
examined
which race characteristic observers would attribute to a target
person when that person was described as a leader or employee.
According to the literatures on category accessibility (Bruner,
1957; Kunda & Spencer, 2003) and representativeness (Kahne-
man, 2003; Kahneman & Tversky, 1973), individuals are more
likely to describe a target person in ways consistent with the
person’s category of membership. Specifically, in the absence
of
individuating information, when an observer encounters a target
that is a member of a social group, the observer may assume
that
the target has the qualities of the group prototype as opposed to
having qualities that are unique to the target (for a review, see
Kunda & Thagard, 1996). For example, an engineer may be
assumed to be a tad bit geeky and to possess a mechanical-like
writing style, even though these characteristics may or may not
accurately describe the target. Thus, if being White is more
closely
associated with the leader prototype, then observers will be
more
likely to perceive a leader rather than a nonleader to be White.
Also, we wanted to investigate the strength of the leader proto-
type by pitting the predicted recognition-based processes
specific
to prototype use against conflicting information regarding a per-
son’s statistical likelihood (also known as base rate) of being
White (Kahneman, 2003; Kahneman & Tversky, 1973). When
predicting an individual’s personal characteristics, the existing
base rates of a given characteristic have been considered
reliable
determinants of a person’s characteristics. For example, if an
organization’s members are 20% White and 80% Hispanic
Amer-
ican, then probabilistically, any given member is likely to be
Hispanic American. However, previous work has found that ob-
servers are more likely to maintain consistency between their
activated categories and trait inferences (Kahneman & Tversky,
1973), ignoring information about base rates. Thus, if being
White
is associated with the leader prototype, then there should be no
interaction between the target person’s role (employee, leader)
and
base rate information; instead, a main effect should occur
whereby
observers will consider leaders to be White more than
nonleaders
(e.g., employees), regardless of the base rate information
(Hypoth-
esis 1).
Furthermore, if being White is consistent with leader categori-
zation, observers should perceive the leader to be White more
frequently than the base rate would suggest. In the absence of
an
activated prototype, information about the organization’s base
rates is likely to be a useful determinant of the target’s
likelihood
of being White. As a consequence, if a prototype was not
activated,
then observers’ assumptions of race should reflect the base
rates;
however, if the prototype was activated, then it would be under
these conditions that assumptions of race should deviate from
base
rates. Thus, if being White is associated with the leader
prototype,
then observers will be more likely to deviate from base rates in
the
leader than in the nonleader (e.g., employee) conditions when
assessing the race of the target (Hypothesis 2). Both hypotheses
were tested in the following study.
Method
Participants and Study Design
A total of 146 undergraduate participants (68 White, 13 African
American, 21 Hispanic, 37 Asians, 6 other, 1 did not respond)
completed the study in exchange for extra credit in a business
management course. At the time of the study, 60% of the partic-
ipants were employed. Of the participants who reported not
being
currently employed, 95% had previously worked for a company
or
corporation (1 person did not respond to this question). Partici-
pants’ work experience did not predict the dependent measure in
this study, whether alone or in interaction with the experimental
manipulations, and thus, it will not be discussed further. The
study
consisted of a 2 (interviewee role: leader, employee) � 3 (race
base rate: no information, 50% White, 20% White) between-
participants design.
Procedure
Participants were instructed to read a newspaper article and
answer questions about what they read. The article described a
fictitious company project (Selcom, Inc.’s Project NOVA) and
included an interview with a business representative that
described
progress on a project as consistent with expectations (see the
manipulation script in Appendix A). We manipulated the role of
the organizational representative so that the representative was
described as either the leader of the project or as an employee
who
worked on the project. We manipulated the racial composition
of
the organization such that the organization’s workforce
composi-
tion was either 50% White or 20% White, or no mention of the
racial composition was provided. According to our leader proto-
type prediction, participants should be less likely to take into
account the base rate information when determining the race of
the
person in the business leader category than in determining the
race
761THE WHITE STANDARD
of the person in the nonbusiness leader category (employee).
For
example, in the 20% condition, we expected individuals to
atten-
uate their presumption that the leader was White less than their
presumption that the employee was White.
After reading the article, participants answered questions that
assessed the effectiveness of the interviewee role and base-rate
manipulations. Then, participants answered the question “What
do
you think is the race of the person interviewed?” Participants
could
select one of the following randomized options: Hispanic/Latin
American, Asian/Asian American/Pacific Islander, White/
Caucasian American, Black/African American, or Native Ameri-
can/Alaskan Native.
Results
All of the participants in the study correctly reported the ma-
nipulation checks for interviewee role and race base rates.
Hypoth-
esis 1 predicted that leaders would be perceived to be White
more
frequently than nonleaders regardless of the base rates. To test
this
prediction, we had participants record their decisions about the
interviewee’s race, discriminating between those who classified
the interviewee as White (1) or non-White (0). Reclassifying the
data in this way simplified analysis procedures, allowing us to
use
binary hierarchical logistic regression analysis (Kleinbaum,
1994;
see summary of the regression analysis in Table 1). The first
step
of the analysis revealed a main effect of the interviewee role
manipulation (B � �0.76, SE � 0.38, p � .05, r � .17).1 In
particular, independent of the base-rate manipulation, 72% of
the
participants perceived that the leader was White, whereas only
56% of the participants perceived that the employee was White.
In
addition, the analysis revealed a main effect in the base rate
condition (Wald � 17.01, p � .001, r � .33). Participants in the
20% condition perceived the interviewee as White less often (23
of
52 participants � 44%) than did those participants in the no-
mention condition (40 of 48 participants � 83%) or the 50%
condition (33 of 46 participants � 72%). The interaction
between
interviewee role and base rates, which was tested in the second
step of the logistic regression analysis, was not significant ( p �
.36). The presence of a base rate main effect illustrates that
participants in the 50% White and 20% White conditions
consid-
ered racial composition information when making assumptions
about the interviewee’s race, but the absence of an interaction
reveals that regardless of base rate, observers were more likely
to
perceive the leader than nonleader as being White. Thus,
Hypoth-
esis 1 was supported.
Hypothesis 2 predicted that the participants would perceive the
leader to be White more frequently than the 50% base rate or
20%
base rate would suggest (i.e., perceptions would deviate from
base
rates) but that this would not be the case for nonleaders (e.g.,
employees). That is, we expected the observed differences in
percentages to be significantly different from the base rate in
the
leader conditions but not in the employee conditions. We used Z
tests for proportion to examine this specific prediction, and Hy-
pothesis 2 was supported. In the 50% base rate condition,
partic-
ipants presumed that the leader was White significantly more
often
than the base rate would have suggested (18 of 22 participants
�
82%; Z � 2.23, p � .03), but this was not so when forming
impressions of the employee (15 of 24 participants � 63%; Z �
0.88, p � .38). A similar pattern was noted in the 20% base rate
condition (for the leader, 14 of 28 participants � 50%, Z �
2.35,
p � .02; for the employee, 9 of 24 participants � 37.5%, Z �
0.54,
p � .59). These analyses lend support to the prediction that
participants relied on a prototype to form impressions of the
interviewee’s race in the leader condition but not in the
employee
condition.
Discussion
The findings support the prediction that being White is an
attribute of the business leader prototype. First, independent of
the
organization’s race base rates, leaders more than employees
were
assumed to be White. This difference in leader perceptions pro-
vides support for the first structural principle of prototype
devel-
opment: that being White is characteristic of the business leader
prototype. Second, in support of the second structural principle,
when the nonleader category was considered, the rate at which
employees were perceived to be White did not deviate from the
race base rates in the two conditions where individuals were
1 To place effect size estimates into a common metric across
studies and
analysis procedures, we opted to use the “r family” of effect
size estimates,
where we estimated rcontrast for ANOVAs (Rosenthal, Rosnow,
& Rubin,
2000) and requivalent for logistic regression analyses
(Rosenthal & Rubin,
2003). Estimates had unsigned (and thus positive) directions
and could
range from 0 to 1.
Table 1
Binary Hierarchical Logistic Regression for Perceptions of
Leader Race Regressed on Interviewee Role and Base Rate
(Study 1)
Variable
Step 0 Step 1 Step 2
B SE Wald B SE Wald B SE Wald
Constant 0.65 0.17 13.99*** 0.11 0.33 0.11 0.00 0.38 0.00
Interviewee role �0.76 0.38 3.90* �0.51 0.57 0.81
Base rate 17.01** 10.47**
Interviewee Role � Base Rate 0.34
Note. Interviewee role and base rate were treated as categorical
variables for the analysis. The leader role condition was used as
the reference point for
the interviewee role manipulation tests, and perceptions of
leader race was coded dichotomously (1 � White, 0 � other
races). Because base rate
manipulation had three levels, its tests (either main effects tests
or tests of interactions involving this variable) did not have a
single condition that
represented a reference point; rather, the table contains the
overall test of this variable, the Wald statistic.
*p � .05. **p � .01. ***p � .001.
762 ROSETTE, LEONARDELLI, AND PHILLIPS
informed of race base rates. When Whites comprised a smaller
percentage of the employees in the organization, they were less
likely to be perceived as employees. When Whites comprised a
larger percentage of the employees in the organization, they
were
more likely to be perceived as employees. Thus, being White is
not
likely to be very central to the nonbusiness leader category.
Taken
together, these results suggest that being White is an attribute
of
the business leader prototype. These findings are consistent
with
our predictions, and we sought to build more confidence into
the
reliability and generalizability of these effects by conducting a
second study.
First, in addition to demonstrating that the structural principles
of a leadership prototype are present, once a characteristic of a
category has been identified as prototypical, inclusion of the
char-
acteristic as a prototype is also determined by comparing it to
other
stimuli (Rosch, 1973). In the case of a White leader prototype,
that
would include the consideration of other races, such as Hispanic
Americans, Asian Americans, and African Americans. Second,
U.S. businesses consist of a plethora of industries, and it is
possible
that Whites may be perceived as prototypical leaders in some
business industries but not in others. Third, our sample
consisted
of undergraduates, and although most of the participants had
work
experience and likely were familiar with perceptions of
leadership
characteristics, a second, older, and more experienced sample
would increase the generalizability of our findings.
Study 2: Racial Minorities and Industry Type
This study sought to replicate Study 1 findings and to extend
the
findings in three ways. First, this study tested whether the type
of
racial minority in the firm affected individuals’ beliefs that
being
White is a central characteristic to the business leader category.
Different stereotypes are associated with different racial minori-
ties. For example, Asian Americans are generally regarded as
the
model minority (Hurh & Kim, 1989; Kitano & Sue, 1975; Lee,
1994), whereas Hispanic Americans (P. Burns & Gimpel, 2000;
Dixon & Rosenbaum, 2004; Marin, 1984) and African
Americans
(Devine & Elliot, 1995; Krueger, 1996; Mackie et al., 1996;
Plous
& Williams, 1995) are typically associated with more negative
stereotypes. It could be that because of the negative stereotypes
associated with racial minorities such as African Americans and
Hispanic Americans that these racial groups may be particularly
incompatible with the business leader category, but when firms
comprise a significant population of less stigmatized minorities,
such as Asian Americans, individuals may be less likely to per-
ceive that being White is a characteristic of the business leader
category. Thus, on the basis of the arguments associated with
negative race stereotypes, business leaders will be perceived to
be
White more frequently than nonbusiness leaders when Hispanic
and African Americans are represented in the organization than
when Asian Americans are represented in the organization (Hy-
pothesis 3a). However, if being White is a central characteristic
of
the business leader category as we predict, the perception of
Whites as leaders more frequently than nonleaders will persist
regardless of the racial minority that is present in the
organization.
Hence, business leaders will be perceived to be White more
frequently than nonbusiness leaders when Hispanic, African,
and Asian Americans are represented in the organization (Hy-
pothesis 3b).
Second, whether a leader’s race is viewed as central to the
business leader category may be dependent on the type of
business
industry in which the leader works. Whites are especially
visible in
financial industries (GAO Report, 2006), whereas African
Amer-
icans (Dorsey, 2005; Jones, 1986; Maume, 1999) and Hispanic
Americans (Tienda & Mitchell, 2006) are often concentrated in
community relations, human resources, nonprofit, and service
sec-
tors. Hence, it may be easier for observers to recognize racial
minorities as central to the business leader category when social
service or nonprofit sectors are considered. That is, Whites will
be
perceived to be leaders in the financial services industries more
so
than in the social services industries (Hypothesis 4a). However,
if
being White is central to the business leader category as we
predict, the perception of Whites as leaders more frequently
than
nonleaders will persist regardless of the type of business
industry.
Thus, Whites will be perceived to be business leaders more so
than
business nonleaders in the financial services and social services
industries (Hypothesis 4b). These competing hypotheses were
tested in Study 2, which manipulated the type of business
industry,
the target’s role (leader or nonleader), and the racial minority
present in the organizational roles. In addition, the participants
in
this study had substantially more work experience than did the
participants in Study 1, and thus this study investigated whether
evidence collected in Study 1 would hold with this more experi-
enced sample of individuals.
Method
Participants and Study Design
A total of 167 MBA students (118 White, 14 African American,
5 Hispanic, 23 Asians, 7 other) completed the study as a course
requirement in a business management course. Although demo-
graphics for the particular participants in this study were not
attained, the participants represented 41% of their MBA class,
which in aggregate had an average age of 29 years and 5.8 years
of work experience. The study design consisted of a 2
(interviewee
role: leader, assistant) � 2 (industry type: financial, social) � 3
(racial minority included in the base rate: African American,
Hispanic American, Asian American) between-participants
factor
design.
Procedure
Participants followed the same procedures as those described in
Study 1 (see the manipulation script in Appendix B). However,
three changes were made to the materials to accommodate the
predictions. First, we manipulated the industry in which the
ficti-
tious company Selcom, Inc. operated. Selcom, Inc. was
described
either as a financial services provider or as a nonprofit social
services provider. Second, we held the level of base rates
constant.
Specifically, the base rate in this study remained the same
across
all of the conditions. Given that the strongest test of the White
leader prototype prediction in Study 1 occurred when only 20%
of
the workforce was White, conservatively, we kept the base rate
of
20% constant across all the conditions. Moreover, replicating
the
leader prototype effect under such extreme base rate conditions
would be a more revealing test than if we used a more balanced
base rate. We did, however, manipulate the type of racial
minority
763THE WHITE STANDARD
included in the base rate. The racial minority was described as
80%
Asian/Asian American, 80% Hispanic/Latin American, or 80%
Black/African American.
Third, instead of referencing base rates for the entire organiza-
tion (as we did in Study 1), the racial minority manipulation
was
situated in the context of the interviewee role. For example, in
the
Asian leader condition, the racial composition was described as
“Of the project leaders employed by Selcom, 20% are White/
Caucasian whereas 80% are Asian/Asian American.” In the
Asian
assistant condition, the racial composition was described as “Of
the project assistants employed by Selcom, 20% are White/
Caucasian whereas 80% are Asian/Asian American.” We did
this
so that participants would have specific base-rate information
about the organization position that they were evaluating as op-
posed to more general information about the overall workforce.
The participants answered the same question from Study 1:
“What
do you think is the race of the person interviewed?” Participants
could select one of the following randomized options: Hispanic/
Latin American, Asian/Asian American/Pacific Islander, White/
Caucasian American, Black/African American, or Native Ameri-
can/Alaskan Native.
Results
A total of 157 of the 167 participants (94%) correctly reported
manipulation checks on interviewee role, industry type, and
racial
minority. We assessed manipulation checks for interviewee role
and industry type before assessing the key dependent variable,
whereas the manipulation check for the racial minority included
in
the base rate was assessed after the key dependent variable.
This
was done so as not to cue participants that the goal of the study
may be race related. Analyses conducted with and without the
10
individuals who failed one or more manipulation checks
revealed
the same outcomes across samples. Thus, the analyses presented
here are on the full sample.
Just as in Study 1, responses to the interviewee race question
were recoded as White (1) or non-White (0). Using standard
procedures (Kleinbaum, 1994), we submitted this dichotomous
variable to a binary hierarchical logistic regression analysis
with
interviewee role, industry type, and racial minority as between-
participants factors (see the regression analysis in Table 2).
Anal-
ysis revealed a significant main effect on interviewee role (B �
�0.65, SE � 0.34, p � .05, r � .15). Participants were more
likely
to believe that leaders (34 of 82 participants � 42%) rather than
employees were White (23 of 85 participants � 28%). The anal-
ysis yielded no other main effects or interactions ( ps � .14).
Hence, leadership perceptions did not vary by the third factor,
racial minority group in the base rate, confirming Hypothesis
3b.
Similarly, leadership perceptions did not vary by the type of
business industry, confirming Hypothesis 4b.
In further support of our presumption that being White is a
prototypical characteristic of leadership, participants in the
leader
conditions presumed that the leader was White significantly
more
often than the 20% base rate would have suggested (Z � 2.98, p
�
.003), but this was not the case when the interviewee was an
employee (Z � 1.03, p � .28).
Discussion
Taken together, the results of Studies 1 and 2 support our first
prediction that a characteristic of the business leadership
prototype
is being White. However, perhaps the effect could be due to the
group prototype explanation (Hogg, 2001). If so, then the
partic-
ipant’s race would moderate the extent to which the leader
would
be perceived as White. That is, non-White observers would be
less
likely to perceive a leader prototype effect than White
observers,
and instead they would assume that leaders just as much as
employees were White. To test this alternative, we conducted
post
hoc analysis with the participants from Studies 1 and 2. If the
effects were due to a group prototype effect, then the interaction
Table 2
Binary Hierarchical Logistic Regression for Perceptions of
Leader Race Regressed on the Type of Racial Minority Included
in the
Base Rate, Interviewee Role, and Industry Type (Study 2)
Variable
Step 0 Step 1 Step 2 Step 3
B SE Wald B SE Wald B SE Wald B SE Wald
Constant �0.66 0.16 16.23*** �0.05 0.37 0.02 �0.20 0.55 0.13
�0.56 0.63 0.80
Racial minority 2.78 0.69 0.57
Interviewee role �0.65 0.34 3.64* �0.19 0.66 0.09 0.43 0.81
0.28
Industry �0.24 0.34 0.48 �0.20 0.64 0.10 0.36 0.77 0.22
Interviewee Role � Racial Minority 0.71 2.26
Industry � Racial Minority 0.22 0.45
Industry � Interviewee Role �0.34 0.68 0.25 �1.53 1.14 1.81
Industry � Interviewee Role � Racial
Minority 1.84
Note. Interviewee role, racial minority, and industry were
treated as categorical variables for the analysis. The leader role
was used as the reference point
for the interviewee role manipulation tests, social services
industry was used as a reference point for the industry
manipulation, and perceptions of leader
race was coded dichotomously (1 � White, 0 � other races).
Because the racial minority manipulation had three levels, its
tests (either main effects tests
or tests of interactions involving this variable) did not have a
single condition that represented a reference point; rather, the
table contains the overall test
of this variable, the Wald statistic. The racial minority group
factor includes Asians/Asian Americans, Hispanics/Latin
Americans, and Blacks/African
Americans.
*p � .05. ***p � .001.
764 ROSETTE, LEONARDELLI, AND PHILLIPS
between the participant’s race and interviewee role should be
significant. That is, Whites should be more likely to perceive
the
leader as opposed to the employee to be White, whereas racial
minorities would be equally likely to consider the leader and
employee to be White. By contrast, our leader prototype
prediction
would argue that being White is an attribute of the U.S.
business
leader prototype, and such prototypes are evident regardless of
the
observer’s race. Hence, the interaction between participant’s
race
and interviewee role would not be significant.
Participants’ assessments of interviewees’ race were submitted
to a logistic regression analysis, with interviewee role and
partic-
ipant race (White, non-White) as predictors. Consistent with
pre-
dictions, the analysis revealed a main effect of interviewee role
(B � �0.68, SE � 0.23, p � .004, r � .17), where leaders were
perceived to be White (57%) more than nonleaders (41%). The
analysis also revealed a main effect of participant race (B �
0.61,
SE � 0.24, p � .01, r � .15). White participants were less likely
to perceive that the interviewee (regardless of role) was White
(81
of 186 participants � 43%) than were racial minorities (72 of
126
participants � 57%). However, the two-way interaction between
interviewee role and participant’s race was not significant (B �
�0.72, SE � 0.48, p � .12); White and non-White participants
both perceived leaders more than nonleaders as White.
We also conducted the logistic regression analysis with partic-
ipant’s race as a five-level variable (White, Black, Hispanic,
Asian, and other) and interviewee role as between-subjects
factors.
This analysis revealed no significant effects of participant’s
race,
either alone or in interaction with interviewee role ( ps � .05).
Finally, we conducted a set of post hoc comparisons for each of
the
five participant race categories to determine whether any
pairwise
differences were revealed. Given that a five-level variable pro-
duces 10 different pairwise comparisons, 10 significance tests
were to be evaluated, which greatly increases the family-wise
error
rate. Thus, to reduce the risk of making a Type I error (i.e.,
rejecting the null hypothesis when it should not be rejected), we
set
Alpha using a Bonferroni correction (.05/10 � .005; Abdi,
2007).
Thus, effects would be considered significant if the p values fell
below .005. All tests involving pairwise comparisons of race
and
the interactions between pairwise race comparisons and inter-
viewee role failed to reach this level of significance. In fact, all
but
one comparison ( p � .02) had significance levels greater than p
�
.05. This evidence is consistent with our prediction that the per-
ception that leaders are White is a function of leader
categorization
processes rather than of a group prototype.
In sum, the first two studies lend support to the prediction that
being White is a characteristic of the leader prototype. The next
two studies sought to test our second overarching prediction, to
investigate the potential implications of leader race for
leadership
evaluations and to see whether a leader prototype explanation
could account for these effects. Specifically, we evaluated
whether
leader categorization could best explain perceptions of leader
effectiveness (Study 3) and leadership potential (Study 4).
Study 3: Evaluations of White and Non-White Leaders
Previous research has demonstrated that White managers are
considered to have greater career advancement opportunities
than
African American managers (Greenhaus & Parasuraman, 1993;
Maume, 1999). For example, in a comprehensive longitudinal
study across an array of industries, Maume (1999) showed that
when personal and job-related factors were controlled, White
men
were 52% more likely to be promoted in their careers than
African
American men. Maume described the advancement of White
men
as glass escalators and that of African American men as glass
ceilings. We sought to investigate whether race differences be-
tween Whites, African Americans, and other racial minorities in
evaluations of leadership effectiveness could be explained by a
White leader prototype.
We predicted that observers, when evaluating profiles of leaders
in organizations, would perceive White targets to be more
effective
leaders than racial minority targets and that this perception
would
be due to leader categorization. That is, the favorable
evaluations
of Whites would occur because being White is more consistent
with other pertinent prototypical leadership characteristics than
being a racial minority. This prediction is derived from the
recognition-based processes described in leadership
categorization
theory (Lord & Maher, 1990, 1991), whereby leaders are
evaluated
more favorably when the leader is perceived to be compatible
with
prototypical rather than nonprototypical characteristics, a
predic-
tion that has received a good deal of empirical support (Foti et
al.,
1982; Foti & Lord, 1987; Lord et al., 1986; Phillips, 1984),
especially when salient identity characteristics, such as gender,
have been considered (Eagly & Karau, 2002; Heilman et al.,
1989;
Lyness & Heilman, 2006; Nye & Forsyth, 1991; Schein, 1973;
Scott & Brown, 2006). However, prototypical characteristics
may
not influence observers’ perceptions if they are considered to be
uninformative (Kunda & Spencer, 2003), such as when individu-
ating information about specific events and circumstances are
present (Leyens, Yzerbyt, & Schadron, 1992; Yzerbyt,
Schadron,
Leyens, & Rocher, 1994). That is, in addition to prototypical
and
nonprototypical characteristics, leader evaluations often entail
in-
dividualized analyses or summaries of the leader’s performance,
and such specific information may increase or decrease the rele-
vance of the prototype in leader evaluations.
At first glance, it may be hard to believe that observers may
rely
on leader categorization processes at all when individualized in-
formation about the leader’s performance record is available.
However, existing theory and evidence suggests that the leader
prototype may still affect observers’ impressions as long as it
does
not disrupt comprehension or, more specifically, conflict with
other information they have (Kunda & Spencer, 2003; see also
Kunda, Davies, Hoshino-Browne, & Jordan, 2003). That is,
when
a target’s categorization conflicts with individualized
information
that observers have about a target, observers will not use proto-
types and instead will rely only on the available individualized
information (Leyens et al., 1992; Yzerbyt et al., 1994). In
contrast,
prototypes are more likely to affect observers’ evaluations of
the
target when the prototype categorization is perceived to confirm
the individualized information the observers have about the
target
person; thus, the prototype facilitates comprehension (Kunda &
Spencer, 2003).
As applied to our work, we predict that the leader prototype will
lead to higher leader effectiveness ratings of White relative to
non-White leaders, but only when the leader prototype confirms
and reinforces individualized information about the leader’s
per-
formance record, namely, when the leader has led the
organization
to success. Some evidence supports the idea that leadership pro-
totypes are compatible with successful team and organizational
765THE WHITE STANDARD
performances, as leadership effectiveness ratings are the highest
when groups and organizations have performed successfully
(Meindl & Ehrlich, 1987; Nye, 2002; Rush, Phillips, & Lord,
1981; Weber, Camerer, Rottenstreich, & Knez, 2001), and it is
easier to associate success with a prototypical leader than with a
nonprototypical leader and to subsequently infer leadership
effec-
tiveness (Ensari & Murphy, 2003; Phillips & Lord, 1981, 1982).
However, when successful outcomes are considered, perceived
responsibility for the performance becomes an elementary part
of
the evaluative process (Meindl & Ehrlich, 1987; Meindl et al.,
1985). When managers are viewed as responsible for successful
performances, then the perception that they are typical leaders
is
enhanced; but, if they are perceived not to be responsible for
successful performances or responsible for poor performances,
leader perceptions are lowered (Lord & Maher, 1991).
Therefore,
a White leader who is responsible for the success of the group
or
organization should be evaluated favorably because all three
fac-
tors—race, organizational performance, and the appropriate
attri-
butions—are all well-matched leadership characteristics.
Conversely, when the leader is not given credit for organiza-
tional success (i.e., it is attributed to external causes) or the
leader’s organization performs poorly, then the leader prototype
is
incompatible with the individualized information and it will not
be
used. Under such performance conditions, White and non-White
leaders will be rated equivalently. Thus, consistent with leader
categorization, we predict that there should not be differences
in
evaluations between White and non-White leaders except when
successful performances are attributed to the leader.
White leaders may be rated more favorably than non-White
leaders for reasons other than leader categorization. One
alterna-
tive prediction that likely comes to mind stems from the
negative
stereotypes that are frequently associated with racial minority
groups. For example, African Americans are often stereotyped
to
be less determined and less competent than Whites. It is
possible
that a White leader may be evaluated more positively than an
African American leader because of these negative stereotypes.
However, if the negative stereotype explanation is valid and
given
the existing research on comprehension and individuating infor-
mation (Kunda & Spencer, 2003), we would expect the emphasis
to be on the negative evaluation of non-White leaders (e.g.,
Afri-
can, Hispanic, Asian American) as opposed to the positive
evalu-
ations of White leaders. Whereas the White prototype
explanation
would be more likely to occur under conditions of success, the
negative stereotype explanation would be more likely to occur
under conditions of failure. That is, non-White leaders would be
evaluated less favorably than White leaders only when the nega-
tive stereotype reinforced information about the leader’s perfor-
mance record, specifically, that the non-White leader was
respon-
sible for organizational failure. Thus, on the basis of the
negative
stereotype explanation, we predict a three-way interaction
between
race, organizational performance, and performance attributions:
Non-White leaders will be evaluated less favorably than White
leaders, but only when they are blamed for unsuccessful organi-
zational performance (Hypothesis 5a). However, on the basis of
our proposed White business leader prototype, we predict a
com-
peting three-way interaction: White leaders will be evaluated
more
favorably than non-White leaders, but only when they are given
credit for successful organizational performances (Hypothesis
5b).
Method
Participants
A total of 479 undergraduates (270 women, 209 men) partici-
pated in the study in exchange for course extra credit or $10. Of
these participants, 131 were White, 75 were Black, 125 were
Asian, 115 were Hispanic, and 33 classified their race as
“other.”
Study Design
The study consisted of a 2 (organizational performance: failure,
success) � 2 (performance attribution: internal, external) � 2
(leader race: African American, White) between-subjects
factorial
design. The decision to focus primarily on African Americans in
this study as opposed to other racial minorities does not imply
that
one minority group is more important than another. It does,
how-
ever, reflect that in the context of racial bias, social science
research contrasts African Americans—more so than any other
racial minority in the United States—to Whites.
Procedure
Participants were told that they were to complete a task called
“Reading between the Lines” and that the ostensible goal of the
study was to examine how people make inferences about the
newspaper articles they read. After reading the article,
participants
answered some questions about the article’s content. The article
was supposedly about a company called Dosagen, its CEO, and
the
recent performance of the company. The article contained the
experimental manipulations of organizational performance,
perfor-
mance attribution, and leader race. After reading one of the
eight
versions of the article, the participants completed the
postexperi-
mental questionnaire, were debriefed, and then were dismissed
(see the manipulation script in Appendix C).
Organizational performance. The corporation’s performance
was manipulated as being either successful or unsuccessful. In
addition, the company’s earnings were described as having in-
creased (i.e., successful performance) or decreased (i.e., unsuc-
cessful performance), and a graph noting a percentage change in
earnings over the past 5 months was also included. For
successful
performance, the graph displayed a steady increase in company
earnings over a 5-month period. For unsuccessful performance,
the
graph displayed a steady decline over a 5-month period.
Attributions. Quotes provided by an industry analyst in the
article manipulated attributions for organizational performance.
Internal attributions were manipulated by placing the credit or
the
blame for the performance on the CEO. Accordingly, the impli-
cation was that the CEO’s abilities, behaviors, and decisions
accounted for the company’s performance. External attributions
were manipulated by assigning credit or blame for the
performance
on the marketplace. Hence, the economic context of the industry
accounted for the company’s performance and not the CEO. The
primary sentence included in the text of the newspaper article
that
manipulated attributions read as follows: “The performance of
the
company should be attributed to the performance of the [CEO/
marketplace], not to the performance of the
[marketplace/CEO].”
Race of the CEO. The race of the CEO was manipulated by the
name and a picture of the CEO. According to research
conducted
by Bertrand and Mullainathan (2004), Todd is a “White-
sounding”
766 ROSETTE, LEONARDELLI, AND PHILLIPS
name, whereas Tyrone is an “African American-sounding”
name.
To determine that Tyrone was principally used as an African
American name and that Todd was principally used as a White
name, Bertrand and Mullainathan used name-frequency data cal-
culated from birth certificates. They then tabulated the names
by
race to determine which names were distinctly African
American
and which were distinctly White. These two names, Todd and
Tyrone, had two of the highest frequencies for the names tested
in
their respective categories, White names and African American
names. In addition, they conducted a survey in various public
areas
to assess the racial traits of the given names. The names led
respondents to attribute Todd as White and Tyrone as African
American. These two racially identifying names were paired
with
the neutral-sounding last name Smith.
To make the race of the CEO more salient, a headshot of a CEO
dressed in a suit was also provided. To ensure that the
photographs
of the African American and White CEOs differed in terms of
race
but were similar on other potentially critical dimensions that we
thought could bias participants’ evaluations of the leaders, we
conducted a pilot test. Thus, 25 participants from the same
sample
population as the participant pool evaluated 10 photographs of
male faces (5 African American, 5 White) on race (to confirm
differences in race), age (to ensure comparability), and physical
attractiveness and emotional expression (to confirm that the se-
lected photos would be equally attractive and exhibit similar
emotional expressions). Of the 10 photographs, two were
selected
because they were clearly recognizable as African American and
White, were considered similar in age, and were not different in
ratings of physical attractiveness or emotional expression ( ps �
.57).
Leadership Effectiveness Measure
Participants were asked to evaluate the CEO on intelligence,
competence, confidence, and competitiveness (e.g., “I think the
CEO is competent”). According to Kirkpatrick and Locke
(1991)
and Lord et al. (1984), these are characteristics that have been
shown to represent effective leadership. These four items were
measured on a 7-point Likert-type scale anchored by 1 (strongly
disagree) and 7 (strongly agree). The four items shared a
univar-
iate factor structure, and interitem consistency was high (Cron-
bach’s � � .88). Thus, item ratings were averaged together,
creating a single composite leadership evaluation score, where
higher scores indicated more effective leadership. Scores ranged
from 1 to 7 (M � 4.72, SD � 1.13).
Results
Manipulation Checks
Prior to assessing the primary dependent variable, leadership
effectiveness, participants responded to two manipulation
checks
to confirm their awareness of the organizational performance
and
performance attribution manipulations. Responses confirmed
that
99% and 97% of the sample correctly reported the
organization’s
performance and the performance attribution made by the
industry
analyst, respectively, as reported in the news article. After
partic-
ipants answered the leadership effectiveness questions, a final
manipulation check evaluated participants’ awareness of the
CEO’s race with the question “What is the race of Mr. Smith,
the
CEO?” The participants were given six choices: (a)
Black/African
American, (b) Hispanic/Latin American, (c) Asian/Asian Ameri-
can/Pacific Islander, (d) Native American/Alaskan Native, (e)
White/Caucasian American, or (f) Other. This question was
placed
near the end of the postexperimental questionnaire so as not to
bias
the measures of interest. Of the 479 students who participated in
the study, 94% correctly identified the leader’s race. Given the
high reliability on the manipulation checks, we included all re-
spondents in our final analysis. In addition, analyses removing
manipulation check failures revealed the same outcomes.
Leadership Effectiveness
Scores were submitted to a three-way analysis of variance
(ANOVA) with organizational performance, attribution, and
leader race as between-participants factors. Analysis revealed a
main effect for organizational performance, F(1, 471) � 270.86,
p � .001, r � .60, whereby leaders were considered more
effective
after an organization’s success (M � 5.40, SD � 0.96) than
failure
(M � 4.09, SD � 0.89). Analysis also revealed a main effect of
race, F(1, 471) � 3.92, p � .05, r � .09, where White leaders
were
considered more effective (M � 4.78, SD � 1.13) than African
American leaders (M � 4.67, SD � 1.13). These main effects
were
qualified by two-way interactions between performance and
attri-
bution, F(1, 471) � 39.92, p � .001, r � .28, and another
between
leader race and attribution, F(1, 471) � 3.95, p � .05, r � .09.
These in turn were qualified by a significant three-way
interaction,
F(1, 471) � 6.68, p � .01, r � .12. See the ANOVA results in
Table 3.
The three-way interaction is presented in Figure 1. The top
panel
contains mean leader effectiveness ratings following organiza-
tional success, and the bottom panel contains ratings after
organi-
zational failure. To localize the effects of this three-way
interac-
tion, we conducted two-way interaction contrasts (Keppel,
1991)
to determine whether interactions between leader race and
attribu-
tion occurred within the failure condition, as predicted by
Hypoth-
esis 5a, or within the success condition, as predicted by
Hypothesis
5b. Within the success condition, analysis revealed a significant
interaction between attribution and leader race, F(1, 471) �
10.09,
p � .01. Whereas African American (M � 5.19, SD � 0.94) and
Table 3
Analysis of Variance With Leadership Effectiveness on
Organizational Performance, Attributions, and CEO’s Race as
Between-Subjects Factors (Study 3)
Variable F(1, 471) r
Intercept 13,757*** .98
Performance 270.86*** .60
Attribution 2.94 .08
Leader’s race 3.92* .09
Performance � Attribution 39.92*** .28
Performance � Leader’s Race 0.16 .00
Attribution � Leader’s Race 3.95* .09
Performance � Attribution � Leader’s Race 6.68** .12
Note. The racial minority in this study was African Americans.
CEO �
chief executive officer.
*p � .05. **p � .01. ***p � .001.
767THE WHITE STANDARD
After Organizational Success
5.01
(0.98)
5.19
(0.94)
6.04
(0.62)
5.47
(0.95)
3
3.5
4
4.5
5
5.5
6
6.5
Racial minority White
Leader Race
L
e
a
d
e
r
E
ff
e
c
ti
v
e
n
e
s
s
External Internal
After Organizational Failure
4.37
(0.79)
4.20
(0.90) 3.97
(0.89)
3.87
(0.92)
3
3.5
4
4.5
5
5.5
6
6.5
Racial minority White
Leader Race
L
e
a
d
e
r
E
ff
e
c
ti
v
e
n
e
s
s
External Internal
Figure 1. Mean ratings (and standard deviations) of leader
effectiveness by organizational performance,
performance attribution, and leader race (Study 3). The racial
minority in this study was African Americans.
768 ROSETTE, LEONARDELLI, AND PHILLIPS
White leaders (M � 5.01, SD � 0.98) were perceived to be
equally
effective when an external attribution was given for the
organiza-
tion’s success, F(1, 471) � 1.24, ns, White leaders (M � 6.04,
SD � 0.62) were considered more effective than African
American
leaders (M � 5.47, SD � 0.95) when leaders were credited with
the organization’s success, F(1, 471) � 10.85, p � .001. Thus,
Hypothesis 5b was supported. By contrast, within the failure
condition, analysis here yielded no Leader Race � Attribution
interaction (F � 1). Rather, analysis yielded only an attribution
simple effect, F(1, 471) � 10.99, p � .001, where a leader’s
ratings were higher when organizational failure was blamed on
the
marketplace rather than on him. Thus, Hypothesis 5a was not
supported. White leaders were evaluated more favorably than
non-White leaders, but only when successful organizational per-
formance was attributed to the leader.
Participant’s Race as a Moderator?
According to a group prototype model of leader effectiveness
(Hogg, 2001) or more generally, a social identification
explanation
(Tajfel & Turner, 1986), it is possible that individuals would be
more likely to favor leaders from their own race over those from
other races. If so, then White observers would replicate existing
effects reported in the top panel of Figure 1, whereas African
American participants would be more likely to rate African
Amer-
ican leaders more favorably than White leaders. Thus,
leadership
effectiveness was resubmitted to the same ANOVA, but with
participants’ race as a fourth between-participants factor.
Analysis
revealed that none of the effects involving participants’ race
was
significant on leadership effectiveness (Fs � 1.49, ps � .20).
The
means reported in Figure 1 were consistent across participant
race.
Discussion
Overall, the evidence in Study 3 is consistent with predictions
derived from the leader categorization literature that have
shown
that prototypical leaders are evaluated more favorably than non-
prototypical leaders after a clearly successful performance
(Ensari
& Murphy, 2003). We found that White leaders were evaluated
more favorably than African American leaders, but only when
they
were viewed as responsible for their organization’s successful
performance, not when success was attributed to external expla-
nations (such as the marketplace) or when the leader’s organiza-
tion had failed. These findings suggest that the difference in
evaluations between White and non-White leaders came about
because of a White leader prototype as opposed to negative ste-
reotypes toward African Americans. It also suggests that leader
race will affect observers’ evaluations when these evaluations
could matter most to the leader’s career advancement,
specifically
when the leader has accumulated a record of success.
In addition, in further support that being White is an attribute of
the leader prototype, we demonstrated that racial bias was not
merely limited to a group-derived prototype on the part of
White
observers. Rather, observers were more likely to evaluate
success-
ful White leaders more favorably than successful African
Ameri-
can leaders regardless of the observers’ race. The findings pre-
sented here provide support that Whites more than non-Whites
are
viewed as prototypical leaders and that these perceptions
affected
leadership evaluations. However, we conducted a fourth study
to
determine whether our findings were more generalizable and to
specifically assess evaluator’s perceptions of leadership
potential,
not merely leadership effectiveness.
Study 4: Leadership Potential of White and Non-White
Leaders
The question posed in the first paragraph of the introduction
asks “What is preventing well-trained racial minorities from ad-
vancing within the organizational hierarchy to become leaders
in
U.S. companies?” To explicitly answer this question, we sought
to
demonstrate that racial bias due to leader categorization does
not
occur only once Whites and racial minorities are in leadership
positions, as demonstrated in Study 3, but also when they are
being
considered for career advancement opportunities. Thus, the
central
purpose of Study 4 was to test Hypothesis 5b, with leadership
potential as the variable of interest. That is, we sought to
replicate
Study 3’s findings and to examine evaluations of midlevel
leaders
who are considered for top leadership positions.
Also, we set out to accomplish three additional goals. First, we
sought to rule out the possibility that participants in Study 3
were
making their evaluations on the basis of characteristics
attributed
to names. Consistent with the research of Bertrand and Mullain-
athan (2004), we chose to use names that are typically
associated
with racial minorities and Whites to manipulate race. However,
according to Kasof (1993), names that are based on
demographics
can form impressions and communicate information such as at-
tractiveness, age, and even intellect. Accordingly, the names
used
to manipulate race may have communicated attributes other than
race. Second, Study 3 focused on only one racial minority
group,
African Americans. Although much of the research that
examines
racial bias contrasts Whites with African Americans, to demon-
strate that a White prototype of leadership persists in U.S.
business
settings, it would be useful to consider evaluations of White
leaders relative to leaders who belong to alternative racial
groups,
such as Asian and Hispanic Americans. Third, to increase the
generalizability of our findings, we recruited a more
experienced
sample for participation in this study.
Method
Participants and Study Design
A total of 151 graduate students (106 Whites, 19 Hispanics, 14
Blacks, and 12 Asians and others) completed the study as a
course
requirement in a business management course or in exchange
for
snacks and a break from the Basketball Ticket Campout.
Campout
is a weekend-long event where students “camp out” so that they
may be included in a lottery system for basketball tickets. There
were no differences in the analysis between the data collected in
conjunction with the management course and the data collected
at
the campout. Thus, the two sites are not discussed further. The
participants (90 men, 61 women) had an average age of 27.33
years (SD � 2.78) and 4.53 years of work experience (SD �
2.81).
Similar to Study 3, the study consisted of an Organizational
Performance (failure, success) � Performance Attribution
(inter-
nal, external) � Leader Race (White, Hispanic, Asian) between-
participants design.
769THE WHITE STANDARD
Procedure
Participants were told that they were participating in a study
called “Performance Evaluations” and that the goal of the study
was to evaluate personnel who were candidates for top positions
within an organization. Participants were instructed to read a
personnel summary that included a brief profile and
performance
summary of a consulting services team leader employed in a
fictitious company, Buygen, Inc. (see the manipulation script in
Appendix D). Next, they were instructed to evaluate whether the
team leader described in the profile had the potential to succeed
if
promoted to a more senior management position, specifically, a
division leader within the organization. After reading the profile
and performance summary, participants completed an evaluation
of the target person described in the personnel summary that
included manipulation checks and a measure of leadership
poten-
tial.
Manipulations. The manipulations for organizational perfor-
mance and attributions were similar to the manipulations in
Study
3. First, the consulting team’s performance was manipulated as
either successful or unsuccessful. The team’s performance was
described as having increased or decreased. Second, comments
in
the performance appraisal were used to manipulate attributions
to
the team’s performance. The primary sentence in the
performance
appraisal that manipulated internal and external attributions
read as follows: “Last year’s appraisal noted that the team’s
performance was due to the performance of the [marketplace/
team leader], not to the [team leader/marketplace], and stated
that ‘it is the [availability of high profile clients in the market-
place/team leader’s management skills] that explains the team’s
performance record.’”
Unlike in Study 3, where we used a picture and a name to
manipulate the race of the leader, in Study 4 we manipulated the
race of the team leader by a line-item description in the
personnel
file. Under the label race, the target was described as White/
European American/Caucasian, Asian/Asian American, or
Hispan-
ic/Latin American. A pilot test revealed that when only this race
label was used to manipulate race (e.g., no picture or name as in
Study 3) and when the manipulation check for leader race was
assessed after the dependent variable of interest, a significant
number of participants (approximately 20%; 16 out of 84 pilot
test
participants) failed the leader race manipulation check. Thus, to
make the leader race salient, the leader race manipulation check
(as
well as the organizational performance and attribution
manipula-
tion checks) were assessed prior to measuring leadership
potential.
Leadership potential. We designed the leadership potential
measure to evaluate participants’ evaluations of the team
leader’s
career expectations in the role of the division leader and used
the
following three items: “He has the competence to perform effec-
tively in the division leader role,” “He has what it takes to lead
others in a division successfully,” and “He will be an effective
division leader.” Participants rated their level of agreement
using
a 7-point response scale (1 � strongly disagree, 7 � strongly
agree). The items shared a univariate factor structure, and inter-
item consistency was high (Cronbach’s � � .89). Responses
were
thus averaged together and ranged from 1 to 7 (M � 4.17, SD �
1.06).
Results
Participants responded to three manipulation checks to confirm
the team’s performance, attributions made to the team leader,
and
the leader’s race. A total of 97% of the participants correctly
reported the team’s performance, 99% correctly reported the
attri-
butions made to the leader, and 95% correctly reported the
leader’s
race in the manipulation check. Given the robustness of the ma-
nipulations, the total sample was included in the analysis.
Further,
the results were the same when the manipulation failures were
not
included.
Participant’s race did not significantly influence the findings
when included as a covariate or as a fourth factor; hence, it will
not
be discussed further. In addition, planned comparison tests in
which we used the entire sample that contrasted target Hispanic
leaders with target Asian leaders in each of the performance and
attribution conditions (i.e., internal/success, external/success,
in-
ternal/failure, external/failure) yielded no significant
differences.
Thus, the Hispanic and Asian conditions were collapsed into
one
racial minority condition.
The leadership potential scores were submitted to an ANOVA
with organizational performance, performance attributions, and
leader race as between-participants factors (see ANOVA results
in
Table 4). Analysis revealed a significant main effect of
organiza-
tional performance, F(1, 142) � 66.86, p � .001, r � .57; a
significant two-way interaction between organizational perfor-
mance and attributions, F(1, 142) � 38.23, p � .001, r � .46;
and
a significant interaction between attribution and leader’s race,
F(1,
142) � 2.08, p � .05, r � .12. These effects were qualified by a
three-way interaction, F(1, 142) � 4.50, p � .04, r � .18.
Means
and standard deviations are presented in Figure 2. Consistent
with
Study 3, within the success conditions, the interaction contrast
was
significant, F(1, 142) � 6.26, p � .01, r � .32, whereas the
interaction contrast for failure was not significant, F(1, 142) �
1.18, ns, r � .05. Moreover, simple effect comparisons revealed
that White leaders (M � 5.15, SD � 0.99) received more
favorable
evaluations than did racial minority leaders (M � 4.45, SD �
0.65), a significant difference, F(1, 142) � 6.53, p � .01, r �
.21,
when success was internally attributed. However, White leaders
(M � 4.00, SD � 0.79) were not evaluated more favorably than
Table 4
Analysis of Variance With Leadership Potential on
Organizational Performance, Attributions, and CEO’s Race as
Between-Subjects Factors (Study 4)
Variable F(1, 142) r
Intercept 370.57*** .85
Participant’s race 0.90 .08
Performance 66.86*** .57
Attribution 1.61 .10
Leader’s race 0.08 .03
Performance � Attribution 38.23*** .46
Performance � Leader’s Race 1.98 .12
Attribution � Leader’s Race 2.08* .12
Performance � Attribution � Leader’s Race 4.50* .18
Note. The racial minorities in this study were Hispanic
Americans and
Asian Americans. CEO � chief executive officer.
*p � .05. ***p � .001.
770 ROSETTE, LEONARDELLI, AND PHILLIPS
After Organizational Success
4.00
(0.79)
4.25
(0.46)
5.15
(0.99)
4.45
(0.65)
2
2.5
3
3.5
4
4.5
5
5.5
6
Racial Minority White
Leader Race
L
e
a
d
e
r
P
o
te
n
ti
a
l
External Internal
After Organizational Failure
3.81
(0.57)
3.90
(0.88)
2.75
(1.15)
3.01
(0.86)
2
2.5
3
3.5
4
4.5
5
5.5
6
Racial Minority White
Leader Race
L
e
a
d
e
r
P
o
te
n
ti
a
l
External Internal
Figure 2. Mean ratings (and standard deviations) of leader
potential by organizational performance, perfor-
mance attribution, and leader race (Study 4). The racial
minorities in this study were Hispanic Americans and
Asian Americans.
771THE WHITE STANDARD
racial minorities (M � 4.25, SD � 0.46), F(1, 142) � 0.89, ns,
when success was externally attributed. Hypothesis 5b was thus
supported: White leaders were rated more favorably than non-
White leaders only when the team was successful and the leader
deemed responsible for the success.
Discussion
These findings support the idea that racial bias in the leader
prototype can influence evaluations of leaders and their
likelihood
of career advancement. Taken together with Study 3 findings,
these findings demonstrate that the career prospects of White
targets were evaluated as higher than the prospects for African
American, Hispanic American, and Asian American targets.
Race
differences occurred only when the leader was given credit for
organizational success, evidence that is consistent with the lead-
ership prototype prediction. It is precisely under these
conditions,
when leaders are held responsible for their organization’s
success-
ful performance, that leaders should be able to capitalize on
their
accomplishments and use their excellent achievements as
stepping
stones to advance their career and as evidence of their ability to
handle additional responsibilities. However, it appears that
White
leaders may be advantaged when such career advancement
oppor-
tunities are considered.
General Discussion
On the basis of leadership categorization theory, we predicted
that Whites would be viewed as more prototypical leaders than
racial minorities in U.S. business settings because the
leadership
prototype included the presumption that prototypical leaders
were
White. Across four studies, the evidence supported this
overarch-
ing prediction. First, being White met the two structural
principles
of prototype development as prescribed by traditional
categoriza-
tion theory (Rosch, 1978) and leadership categorization theory
(Lord & Maher, 1991). Being White was found to be more
central
to the business leader category and less central to the
nonbusiness
leader category (employees). This finding persisted regardless
of
the base rate of the work force, of the base rate of the racial
minority that comprised the majority of the organization’s posi-
tions, and of when the organization was situated in a financial
services industry and a social services industry. Second, our
find-
ings revealed White individuals were perceived as more
effective
leaders and more likely to succeed than non-Whites but that
these
differences occurred only when these leaders were viewed as
responsible for an organization’s success. These findings
persisted
regardless of whether the comparison leader race was African,
Hispanic, or Asian American, regardless of the participants’
race
and across participants with both high and low levels of work
experience. We interpret these noted differences to be
consistent
with a leadership prototype explanation of race differences.
These findings advance organizational research in two impor-
tant ways. First, not only do these studies corroborate existing
categorization processes of leadership and inferential views of
leadership effectiveness, but they introduce the idea that a
leader’s
race, and not merely the stereotypical traits associated with
race,
could influence the evaluative process. Previous research has
shown that leadership categorization and inferential processes
of
leadership provide efficient heuristics for appraising leaders be-
cause evaluators only have to compare a target leader with an
existing knowledge base that includes prototypical traits and
con-
siders salient performance outcomes (Lord & Maher, 1991). Our
findings suggest that the cognitive economy afforded by this
simplistic evaluative process provides a way to efficiently and
perhaps unintentionally evaluate White leaders as more likely to
succeed and as more effective than racial minority leaders.
Thus,
we provide evidence that indeed there may be a White standard
to
which members of racial minorities are compared when
leadership
perceptions and leadership evaluations are considered.
Second, our findings offer a more in-depth understanding of
racial bias in leadership evaluations than what may be presumed
by alternative perspectives, such as negative racial minority ste-
reotype or group prototype explanations. Our findings are
consis-
tent with the overarching tenets of a negative stereotype
explana-
tion because White leaders were evaluated more favorably than
racial minority leaders. However, the results of Studies 3 and 4
suggest that the racial bias occurred because of a favorable
leader
prototype as opposed to a negative racial stereotype. It may be
that
negative racial stereotypes are less relevant in business
contexts.
For example, some research finds that under certain conditions,
African American businessmen are considered to be a positive
subtype of a broader, global African American racial stereotype
(Devine & Baker, 1991). Further, empirical evidence based on
current stereotype-based theories of subtle bias, such as
aversive
racism, suggest that negative bias against racial minority
groups,
such as African Americans, is more likely to occur when it is
not
clear what sort of evaluation is normative and when evaluations
that stem from negative stereotypes can be justified or
rationalized
(Aberson & Ettlin, 2004; Dovidio & Gaertner, 2000; Frey &
Gaertner, 1986; Murphy-Berman, Berman, & Campbell, 1998).
These vague conditions are less likely to be present when
leaders
are evaluated because the situational norms for performance ap-
praisals and evaluations are more apt to be obvious and salient.
We
showed that it is when these norms are strong and evident that a
White leader prototype will influence leadership ratings, such as
when successful performance outcomes occur and attributions
for
performance are clear.
In addition, our findings offer a more extensive explanation of
racial bias than would likely be proposed by a group prototype
explanation (Hogg, 2001). Contrary to group prototype studies,
in
our study the bias in favor of White leaders was evident in
observers who belonged to other racial groups, including Asian,
Hispanic, and African Americans. Accordingly, African Ameri-
cans and Hispanic Americans were just as likely as Whites and
Asian Americans to evaluate White leaders as more effective
and
as more likely to have favorable career opportunities.
We must, however, note study limitations that could potentially
hinder the generalizability of our findings. First, in Studies 3
and
4, we focused only on male leaders and did not include an
evaluation of White female leaders or racial minority female
leaders. Considerable research has examined how gender differ-
ences contribute to a male prototype of leadership (Brenner et
al.,
1989; Eagly & Karau, 2002; Heilman et al., 1989; Nye &
Forsyth,
1991; Schein, 1973; Scott & Brown, 2006); thus, future research
should consider how gender differences and racial differences
intersect to possibly form a specific White male prototype of
leadership. Second, our research was limited to the evaluation
of
fictitious leaders. Evaluations of actual leaders in top
management
772 ROSETTE, LEONARDELLI, AND PHILLIPS
positions in organizations could differ, as leaders in
organizational
settings have reputations and social relationships that may
affect
how they are perceived by observers. Third, the participants in
our
studies were students. The use of student participants may limit
the
generalizability of our findings. Our findings were consistent
across student samples with little work experience and graduate
student samples with a moderate amount of work experience
(i.e.,
an average of 4 to 6 years) who presumably would have been
exposed to actual leaders in their occupations prior to attending
graduate school. However, the findings may differ for sample
populations in which the evaluators have a substantial amount
of
work experience.
Managerial Implications
In addition to contributing to organizational research, our find-
ings may have managerial implications as well. Because organi-
zational rewards and promotion to leadership roles are awarded
on
the basis of leadership evaluations and because our findings
sug-
gest that leadership evaluations are more likely to favor Whites
than racial minorities, it follows that Whites may be more likely
to
be promoted to leadership positions more frequently than racial
minorities. Accordingly, a multiplier effect may persist such
that
positive evaluations are given to White leaders, White leaders
continue to be the prototype for effective leadership, and corre-
spondingly, racial minority leaders are continually
disadvantaged.
In order to disrupt this perpetual cycle, managers and organiza-
tional members have to be made aware of the cognitive biases
that
persist in leadership evaluations that may favor Whites and
hinder
racial minorities. Awareness alone may not “correct” the bias
against racial minority leaders and in favor of White leaders,
but it
may lead to a better understanding of the perceived differences.
Without a thorough understanding of the skewed view of
effective
leadership, racial minorities will continue to be
underrepresented
in top leadership positions.
What should managers do when administering leadership eval-
uations? When continued racial disparity in positions of
leadership
persists in their organizations, managers should take a proactive
stance, gauge the evaluative process, and ask the difficult ques-
tions, such as why are Whites congregated in leadership
positions
and minorities are not? Do racial minorities in lower organiza-
tional positions have similar qualifications as do Whites who
were
promoted to top management? Is it possible to institute a blind
review process that omits or substantially reduces racial
consider-
ations? If racial minorities consistently attain objective achieve-
ments, but those accomplishments are not reflected by good
lead-
ership ratings or positive leadership perceptions, managers
should
attempt to rectify this disconnect and consider the presence of
cognitive biases that may favor Whites over racial minorities.
Conclusion
This study makes clear that the attitudes toward racial minority
leaders and White leaders are complex and merit further investi-
gation. Our results challenge the assumption that racial
differences
are no longer a critical issue in today’s organizations (Hurley,
Fagenson-Eland, & Sonnenfeld, 1997). Although opaque racial
barriers may no longer exist in U.S. organizations, transparent
barriers likely persist that prevent racial minorities from rising
to
the most esteemed positions of leadership in corporate environ-
ments.
References
Abdi, H. (2007). Bonferroni and Sidak corrections for multiple
compari-
sons. In N. J. Salkind (Ed.), Encyclopedia of measurement and
statistics
(pp. 103–107). Thousand Oaks, CA: Sage.
Aberson, C. L., & Ettlin, T. E. (2004). The aversive racism
paradigm and
responses favoring African-Americans: Meta-analytic evidence
of two
types of favoritism. Social Justice Research, 17(1), 25– 46.
The Alliance for Board Diversity. (2005). Women and
minorities on
Fortune 100 boards. Retrieved March 1, 2007, from http://www.
catalystwomen.org/files/full/ABD%20report.pdf
Bass, B. M. (1985). Leadership and performance beyond
expectations.
New York: Free Press.
Beach, L. R. (1964). Cue probabilism and inference behavior.
Psycholog-
ical Monographs: General and Applied, 78(5), 1–20.
Bennis, W., & Nanus, B. (1985). Leaders: The strategies for
taking charge.
New York: Harper & Row.
Bertrand, M., & Mullainathan, S. (2004). Are Emily and Greg
more
employable than Lakisha and Jamal? A field experiment on
labor market
discrimination. The American Economic Review, 94(4), 991–
1013.
Brenner, O. C., Tomkiewicz, J., & Schein, V. E. (1989). The
relationship
between sex role stereotypes and requisite management
characteristics
revisited. Academy of Management Journal, 32, 662– 669.
Bruner, J. S. (1957). Going beyond the information given. In J.
S. Bruner,
L. Festinger, F. Heider, K. F. Muenzinger, C. E. Osgood, & D.
Rapaport
(Eds.), Contemporary approaches to cognition (pp. 41– 69).
Cambridge,
MA: Harvard University Press.
Burns, J. M. (1978). Leadership. New York: Harper & Row.
Burns, P., & Gimpel, J. (2000). Economic insecurity, prejudicial
stereo-
types, and public opinion on immigration policy. Political
Science
Quarterly, 115(2), 201–225.
Calder, B. J. (1977). An attribution theory of leadership. In B.
Staw & G.
Salancik (Eds.), New directions in organizational behavior (pp.
179 –
204). Chicago: St. Clair Press.
Cantor, N., & Mischel, W. (1979). Prototypes in person
perception. In L.
Berkowitz (Ed.), Advances in experimental social psychology
(Vol. 12,
pp. 3–52). New York: Academic Press.
Castilla, E. (in press). Gender, race, and meritocracy in
organizational
careers. American Journal of Sociology.
Chung-Herrera, B., & Lankau, M. (2005). Are we there yet? An
assessment
of fit between stereotypes of minority managers and the
successful-
manager prototype. Journal of Applied Social Psychology,
35(10),
2029 –2056.
Connelly, M., Gilbert, J., Zaccaro, S., Threlfall, K., Marks, M.,
& Mum-
ford, M. (2000). Exploring the relationship of leadership skills
and
knowledge to leader performance. Leadership Quarterly, 11(1),
65– 86.
Corporate Board Initiative. (2006). 2005 update on the
Committee of 100’s
Asian & Asian Pacific American (APA) corporate board report
card.
Retrieved March 2, 2007, from http://www.committee100.org/
initiatives/corporate_board/C-100_Corporate_Board_Update.pdf
Cox, T., & Nkomo, S. (1986). Differential performance
appraisal criteria:
A field study of Black and White managers. Group &
Organization
Studies, 11(1–2), 101–120.
Crocker, J., Fiske, S. T., & Taylor, S. (1984). Schematic bases
of belief
change. In R. Eiser (Ed.), Attitudinal judgment (pp. 197–226).
New
York: Springer.
Devine, P. G., & Baker, S. M. (1991). Measurement of racial
stereotype
subtyping. Personality and Social Psychology Bulletin, 17, 44 –
50.
Devine, P. G., & Elliot, A. J. (1995). Are racial stereotypes
really fading?
The Princeton trilogy revisited. Personality and Social
Psychology Bul-
letin, 21, 1139 –1150.
773THE WHITE STANDARD
DeVries, R. (2000). When leaders have character: Need for
leadership,
performance, and the attribution of leadership. Journal of Social
Behav-
ior and Personality, 15(3), 413– 430.
Dixon, J., & Rosenbaum, M. (2004). Nice to know you? Testing
contact,
cultural, and group threat theories of anti-Black and anti-
Hispanic ste-
reotypes. Social Science Quarterly, 85(2), 2004.
Dorsey, N. (2005). The art of inclusion: Success stories of
African Amer-
icans in the nonprofit sector. Retrieved from Dissertation.com.
Dovidio, J., & Gaertner, S. (2000). Aversive racism in selection
decisions:
1989 and 1999. Psychological Science, 11(4), 315–319.
Eagly, A., & Karau, S. (2002). Role congruity theory of
prejudice toward
female leaders. Psychological Review, 109(3), 573–598.
Ensari, N., & Murphy, S. E. (2003). Cross-cultural variations in
leadership
perceptions and attribution of charisma to the leader.
Organizational
Behavior and Human Decision Processes, 92, 52– 66.
Ford, J., Kraiger, K., & Schechtman, S. (1986). Study of race
effects in
objective indices and subjective evaluations of performance: A
meta-
analysis of performance criteria. Psychological Bulletin, 99,
330 –337.
Fortune. (2006). Key Fortune 500 findings. Retrieved March 1,
2007, from
http://www.timeinc.net/fortune/information/presscenter/fortune/
press_releases/20060403_fortune500.html
Foti, R., Fraser, S., & Lord, R. (1982). Effects of leadership
labels and
prototypes on perception of political leaders. Journal of Applied
Psy-
chology, 67(3), 326 –333.
Foti, R., & Lord, R. (1987). Prototypes and scripts: The effects
of alter-
native methods of processing information on rating accuracy.
Organi-
zational Behavior and Human Decision Making Processes, 39,
318 –
340.
Frey, D., & Gaertner, S. L. (1986). Helping and the avoidance
of inappro-
priate interracial behavior: A strategy which perpetuates a
nonprejudiced
self-image. Journal of Personality and Social Psychology, 50,
1083–
1090.
GAO Report. (2006). Financial services industry: Overall trends
in
management-level diversity initiatives, 1993–2004. (GAO
Report No.
06 – 843T). Washington, DC: U.S. Government Accountability
Office.
Greenhaus, J., & Parasuraman, S. (1993). Job performance
attributions and
career advancement prospects: An examination of gender and
race
effects. Organizational Behavior and Human Decision
Processes, 55(2),
273–297.
Greenhaus, J., Parasuraman, S., & Wormley, W. (1990). Effects
of race on
organizational experiences, job performance evaluations, and
career
outcomes. Academy of Management Journal, 33(1), 64 – 87.
Hains, S. C., Hogg, M. A., & Duck, J. M. (1997). Self-
categorization and
leadership: Effects of group prototypicality and leader
stereotypicality.
Personality and Social Psychology Bulletin, 23(10), 1087–1099.
Heilman, M., Block, C., Martell, R., & Simon, M. (1989). Has
anything
changed? Current characterizations of men, women, and
managers.
Journal of Applied Psychology, 74(6), 935–942.
Hogg, M. (2001). A social identity theory of leadership.
Personality and
Social Psychology Review, 5(3), 184 –200.
Hogg, M., Fielding, K., Johnson, D., Masser, B., Russell, E., &
Svensson,
A. (2006). Demographic category membership and leadership in
small
groups: A social identity analysis. Leadership Quarterly, 17(4),
335–
350.
Hollander, E. P. (1960). Competence and conformity in the
acceptance of
influence. Journal of Abnormal and Social Psychology, 61, 365–
369.
House, R. J. (1977). A 1976 theory of charismatic leadership. In
J. G. Hunt
& L. L. Larson (Eds.), Leadership: The cutting edge (pp. 189 –
207).
Carbondale, IL: Southern Illinois University Press.
Hurh, W. M., & Kim, K. C. (1989). The “success” image of
Asian
Americans: Its validity, and its practical and theoretical
implications.
Ethnic and Racial Studies, 12, 512–538.
Hurley, A. E., Fagenson-Eland, E. A., & Sonnenfeld, J. A.
(1997). Does
cream always rise to the top? An investigation of career
attainment
determinants. Organizational Dynamics, 26(2), 65–71.
Jones, E. W. (1986). Black managers: The dream deferred.
Harvard
Business Review, 64, 84 –93.
The White Standard Racial Bias in Leader CategorizationAs.docx

More Related Content

Similar to The White Standard Racial Bias in Leader CategorizationAs.docx

1957Leadership and CommunicationRyouchinGetty Image.docx
1957Leadership and CommunicationRyouchinGetty Image.docx1957Leadership and CommunicationRyouchinGetty Image.docx
1957Leadership and CommunicationRyouchinGetty Image.docxfelicidaddinwoodie
 
College Role of Gender in Leadership Analysis.docx
College Role of Gender in Leadership Analysis.docxCollege Role of Gender in Leadership Analysis.docx
College Role of Gender in Leadership Analysis.docxstudywriters
 
Niels Jansen Transformational Leadership
Niels Jansen Transformational LeadershipNiels Jansen Transformational Leadership
Niels Jansen Transformational LeadershipNiels Jansen
 
Vol.(0123456789)1 3 journal of business ethics (2019) 160
Vol.(0123456789)1 3 journal of business ethics (2019) 160Vol.(0123456789)1 3 journal of business ethics (2019) 160
Vol.(0123456789)1 3 journal of business ethics (2019) 160ojas18
 
Running head ANNOTATED BIBLIOGRAPHY 1ANNOTA.docx
Running head ANNOTATED BIBLIOGRAPHY           1ANNOTA.docxRunning head ANNOTATED BIBLIOGRAPHY           1ANNOTA.docx
Running head ANNOTATED BIBLIOGRAPHY 1ANNOTA.docxSUBHI7
 
Lesson Four Leadership Behaviors and their Ethical Implications.docx
Lesson Four Leadership Behaviors and their Ethical Implications.docxLesson Four Leadership Behaviors and their Ethical Implications.docx
Lesson Four Leadership Behaviors and their Ethical Implications.docxsmile790243
 
Perception of civil servants on performance : An Emperical Analysis of Indone...
Perception of civil servants on performance : An Emperical Analysis of Indone...Perception of civil servants on performance : An Emperical Analysis of Indone...
Perception of civil servants on performance : An Emperical Analysis of Indone...inventionjournals
 
Group Behavior in OrganizationsAt an organizational level,.docx
Group Behavior in OrganizationsAt an organizational level,.docxGroup Behavior in OrganizationsAt an organizational level,.docx
Group Behavior in OrganizationsAt an organizational level,.docxgilbertkpeters11344
 
Briefly described your healthcare organization, including its cult.docx
Briefly described your healthcare organization, including its cult.docxBriefly described your healthcare organization, including its cult.docx
Briefly described your healthcare organization, including its cult.docxjasoninnes20
 
Leadership Styles: Political Leadership Of Syria
Leadership Styles: Political Leadership Of SyriaLeadership Styles: Political Leadership Of Syria
Leadership Styles: Political Leadership Of Syriainventionjournals
 
Business Executives’ Perceptions of Ethical Leadershipand It.docx
Business Executives’ Perceptions of Ethical Leadershipand It.docxBusiness Executives’ Perceptions of Ethical Leadershipand It.docx
Business Executives’ Perceptions of Ethical Leadershipand It.docxRAHUL126667
 
Business Executives’ Perceptions of Ethical Leadershipand It.docx
Business Executives’ Perceptions of Ethical Leadershipand It.docxBusiness Executives’ Perceptions of Ethical Leadershipand It.docx
Business Executives’ Perceptions of Ethical Leadershipand It.docxfelicidaddinwoodie
 
18 Volume 18, Issue 1, March 2017 Review of.docx
18    Volume 18, Issue 1, March 2017                 Review of.docx18    Volume 18, Issue 1, March 2017                 Review of.docx
18 Volume 18, Issue 1, March 2017 Review of.docxdrennanmicah
 
1st submission.docx
1st submission.docx1st submission.docx
1st submission.docxboto81
 
A Review Of Transformational Leadership Models
A Review Of Transformational Leadership ModelsA Review Of Transformational Leadership Models
A Review Of Transformational Leadership ModelsRobert Marbun
 
Leadership in OrganizationsIntroductionLeadership is conside.docx
Leadership in OrganizationsIntroductionLeadership is conside.docxLeadership in OrganizationsIntroductionLeadership is conside.docx
Leadership in OrganizationsIntroductionLeadership is conside.docxsmile790243
 
A Social Identity Theory of LeadershipMichael A. HoggSch.docx
A Social Identity Theory of LeadershipMichael A. HoggSch.docxA Social Identity Theory of LeadershipMichael A. HoggSch.docx
A Social Identity Theory of LeadershipMichael A. HoggSch.docxransayo
 
Followership & Leadership - Copy
Followership & Leadership - CopyFollowership & Leadership - Copy
Followership & Leadership - CopyClinton Davidson
 
DwightEvaluation       Leadership style assessments certainl.docx
DwightEvaluation       Leadership style assessments certainl.docxDwightEvaluation       Leadership style assessments certainl.docx
DwightEvaluation       Leadership style assessments certainl.docxbrownliecarmella
 
A Case Study Of Leadership Development And Organizational Change
A Case Study Of Leadership Development And Organizational ChangeA Case Study Of Leadership Development And Organizational Change
A Case Study Of Leadership Development And Organizational ChangeJessica Henderson
 

Similar to The White Standard Racial Bias in Leader CategorizationAs.docx (20)

1957Leadership and CommunicationRyouchinGetty Image.docx
1957Leadership and CommunicationRyouchinGetty Image.docx1957Leadership and CommunicationRyouchinGetty Image.docx
1957Leadership and CommunicationRyouchinGetty Image.docx
 
College Role of Gender in Leadership Analysis.docx
College Role of Gender in Leadership Analysis.docxCollege Role of Gender in Leadership Analysis.docx
College Role of Gender in Leadership Analysis.docx
 
Niels Jansen Transformational Leadership
Niels Jansen Transformational LeadershipNiels Jansen Transformational Leadership
Niels Jansen Transformational Leadership
 
Vol.(0123456789)1 3 journal of business ethics (2019) 160
Vol.(0123456789)1 3 journal of business ethics (2019) 160Vol.(0123456789)1 3 journal of business ethics (2019) 160
Vol.(0123456789)1 3 journal of business ethics (2019) 160
 
Running head ANNOTATED BIBLIOGRAPHY 1ANNOTA.docx
Running head ANNOTATED BIBLIOGRAPHY           1ANNOTA.docxRunning head ANNOTATED BIBLIOGRAPHY           1ANNOTA.docx
Running head ANNOTATED BIBLIOGRAPHY 1ANNOTA.docx
 
Lesson Four Leadership Behaviors and their Ethical Implications.docx
Lesson Four Leadership Behaviors and their Ethical Implications.docxLesson Four Leadership Behaviors and their Ethical Implications.docx
Lesson Four Leadership Behaviors and their Ethical Implications.docx
 
Perception of civil servants on performance : An Emperical Analysis of Indone...
Perception of civil servants on performance : An Emperical Analysis of Indone...Perception of civil servants on performance : An Emperical Analysis of Indone...
Perception of civil servants on performance : An Emperical Analysis of Indone...
 
Group Behavior in OrganizationsAt an organizational level,.docx
Group Behavior in OrganizationsAt an organizational level,.docxGroup Behavior in OrganizationsAt an organizational level,.docx
Group Behavior in OrganizationsAt an organizational level,.docx
 
Briefly described your healthcare organization, including its cult.docx
Briefly described your healthcare organization, including its cult.docxBriefly described your healthcare organization, including its cult.docx
Briefly described your healthcare organization, including its cult.docx
 
Leadership Styles: Political Leadership Of Syria
Leadership Styles: Political Leadership Of SyriaLeadership Styles: Political Leadership Of Syria
Leadership Styles: Political Leadership Of Syria
 
Business Executives’ Perceptions of Ethical Leadershipand It.docx
Business Executives’ Perceptions of Ethical Leadershipand It.docxBusiness Executives’ Perceptions of Ethical Leadershipand It.docx
Business Executives’ Perceptions of Ethical Leadershipand It.docx
 
Business Executives’ Perceptions of Ethical Leadershipand It.docx
Business Executives’ Perceptions of Ethical Leadershipand It.docxBusiness Executives’ Perceptions of Ethical Leadershipand It.docx
Business Executives’ Perceptions of Ethical Leadershipand It.docx
 
18 Volume 18, Issue 1, March 2017 Review of.docx
18    Volume 18, Issue 1, March 2017                 Review of.docx18    Volume 18, Issue 1, March 2017                 Review of.docx
18 Volume 18, Issue 1, March 2017 Review of.docx
 
1st submission.docx
1st submission.docx1st submission.docx
1st submission.docx
 
A Review Of Transformational Leadership Models
A Review Of Transformational Leadership ModelsA Review Of Transformational Leadership Models
A Review Of Transformational Leadership Models
 
Leadership in OrganizationsIntroductionLeadership is conside.docx
Leadership in OrganizationsIntroductionLeadership is conside.docxLeadership in OrganizationsIntroductionLeadership is conside.docx
Leadership in OrganizationsIntroductionLeadership is conside.docx
 
A Social Identity Theory of LeadershipMichael A. HoggSch.docx
A Social Identity Theory of LeadershipMichael A. HoggSch.docxA Social Identity Theory of LeadershipMichael A. HoggSch.docx
A Social Identity Theory of LeadershipMichael A. HoggSch.docx
 
Followership & Leadership - Copy
Followership & Leadership - CopyFollowership & Leadership - Copy
Followership & Leadership - Copy
 
DwightEvaluation       Leadership style assessments certainl.docx
DwightEvaluation       Leadership style assessments certainl.docxDwightEvaluation       Leadership style assessments certainl.docx
DwightEvaluation       Leadership style assessments certainl.docx
 
A Case Study Of Leadership Development And Organizational Change
A Case Study Of Leadership Development And Organizational ChangeA Case Study Of Leadership Development And Organizational Change
A Case Study Of Leadership Development And Organizational Change
 

More from ssusera34210

As described in Lecture Note 1, geography is a part of everyday life.docx
As described in Lecture Note 1, geography is a part of everyday life.docxAs described in Lecture Note 1, geography is a part of everyday life.docx
As described in Lecture Note 1, geography is a part of everyday life.docxssusera34210
 
As an extra credit, Must discuss at least one (1) o.docx
As an extra credit, Must discuss at least one (1) o.docxAs an extra credit, Must discuss at least one (1) o.docx
As an extra credit, Must discuss at least one (1) o.docxssusera34210
 
As an institution, Walden has long supported days of service and.docx
As an institution, Walden has long supported days of service and.docxAs an institution, Walden has long supported days of service and.docx
As an institution, Walden has long supported days of service and.docxssusera34210
 
As computer and internet technologies have advanced and become m.docx
As computer and internet technologies have advanced and become m.docxAs computer and internet technologies have advanced and become m.docx
As computer and internet technologies have advanced and become m.docxssusera34210
 
As cultural and literary scholar Louis Henry Gates  claims, Repetit.docx
As cultural and literary scholar Louis Henry Gates  claims, Repetit.docxAs cultural and literary scholar Louis Henry Gates  claims, Repetit.docx
As cultural and literary scholar Louis Henry Gates  claims, Repetit.docxssusera34210
 
As an African American male, social issues are some that seem to.docx
As an African American male, social issues are some that seem to.docxAs an African American male, social issues are some that seem to.docx
As an African American male, social issues are some that seem to.docxssusera34210
 
As a work teamDecide on the proto personas each team member .docx
As a work teamDecide on the proto personas each team member .docxAs a work teamDecide on the proto personas each team member .docx
As a work teamDecide on the proto personas each team member .docxssusera34210
 
As an astute social worker and professional  policy advocate, on.docx
As an astute social worker and professional  policy advocate, on.docxAs an astute social worker and professional  policy advocate, on.docx
As an astute social worker and professional  policy advocate, on.docxssusera34210
 
As a special education professional, it is important to be aware of .docx
As a special education professional, it is important to be aware of .docxAs a special education professional, it is important to be aware of .docx
As a special education professional, it is important to be aware of .docxssusera34210
 
As an incoming CEO, how would you have approached the senior leaders.docx
As an incoming CEO, how would you have approached the senior leaders.docxAs an incoming CEO, how would you have approached the senior leaders.docx
As an incoming CEO, how would you have approached the senior leaders.docxssusera34210
 
As a prison administrator (wardensuperintendent), what would your r.docx
As a prison administrator (wardensuperintendent), what would your r.docxAs a prison administrator (wardensuperintendent), what would your r.docx
As a prison administrator (wardensuperintendent), what would your r.docxssusera34210
 
As a helpful tool for schools, organizations, and agencies working w.docx
As a helpful tool for schools, organizations, and agencies working w.docxAs a helpful tool for schools, organizations, and agencies working w.docx
As a helpful tool for schools, organizations, and agencies working w.docxssusera34210
 
ArticleInterspecies ChimerismwithMammalian Pluripotent.docx
ArticleInterspecies ChimerismwithMammalian Pluripotent.docxArticleInterspecies ChimerismwithMammalian Pluripotent.docx
ArticleInterspecies ChimerismwithMammalian Pluripotent.docxssusera34210
 
As a future leader in the field of health care administration, you m.docx
As a future leader in the field of health care administration, you m.docxAs a future leader in the field of health care administration, you m.docx
As a future leader in the field of health care administration, you m.docxssusera34210
 
Article  Title  and  Date  of  the  Article   .docx
Article  Title  and  Date  of  the  Article   .docxArticle  Title  and  Date  of  the  Article   .docx
Article  Title  and  Date  of  the  Article   .docxssusera34210
 
Article The Effects of Color on the Moods of College .docx
Article The Effects of Color on the Moods  of College .docxArticle The Effects of Color on the Moods  of College .docx
Article The Effects of Color on the Moods of College .docxssusera34210
 
Art  museums  and art  galleries  are two different types of entitie.docx
Art  museums  and art  galleries  are two different types of entitie.docxArt  museums  and art  galleries  are two different types of entitie.docx
Art  museums  and art  galleries  are two different types of entitie.docxssusera34210
 
As a clinical social worker it is important to understand group .docx
As a clinical social worker it is important to understand group .docxAs a clinical social worker it is important to understand group .docx
As a clinical social worker it is important to understand group .docxssusera34210
 
artsArticleCircling Round Vitruvius, Linear Perspectiv.docx
artsArticleCircling Round Vitruvius, Linear Perspectiv.docxartsArticleCircling Round Vitruvius, Linear Perspectiv.docx
artsArticleCircling Round Vitruvius, Linear Perspectiv.docxssusera34210
 
Artists are often involved in national social movements that result .docx
Artists are often involved in national social movements that result .docxArtists are often involved in national social movements that result .docx
Artists are often involved in national social movements that result .docxssusera34210
 

More from ssusera34210 (20)

As described in Lecture Note 1, geography is a part of everyday life.docx
As described in Lecture Note 1, geography is a part of everyday life.docxAs described in Lecture Note 1, geography is a part of everyday life.docx
As described in Lecture Note 1, geography is a part of everyday life.docx
 
As an extra credit, Must discuss at least one (1) o.docx
As an extra credit, Must discuss at least one (1) o.docxAs an extra credit, Must discuss at least one (1) o.docx
As an extra credit, Must discuss at least one (1) o.docx
 
As an institution, Walden has long supported days of service and.docx
As an institution, Walden has long supported days of service and.docxAs an institution, Walden has long supported days of service and.docx
As an institution, Walden has long supported days of service and.docx
 
As computer and internet technologies have advanced and become m.docx
As computer and internet technologies have advanced and become m.docxAs computer and internet technologies have advanced and become m.docx
As computer and internet technologies have advanced and become m.docx
 
As cultural and literary scholar Louis Henry Gates  claims, Repetit.docx
As cultural and literary scholar Louis Henry Gates  claims, Repetit.docxAs cultural and literary scholar Louis Henry Gates  claims, Repetit.docx
As cultural and literary scholar Louis Henry Gates  claims, Repetit.docx
 
As an African American male, social issues are some that seem to.docx
As an African American male, social issues are some that seem to.docxAs an African American male, social issues are some that seem to.docx
As an African American male, social issues are some that seem to.docx
 
As a work teamDecide on the proto personas each team member .docx
As a work teamDecide on the proto personas each team member .docxAs a work teamDecide on the proto personas each team member .docx
As a work teamDecide on the proto personas each team member .docx
 
As an astute social worker and professional  policy advocate, on.docx
As an astute social worker and professional  policy advocate, on.docxAs an astute social worker and professional  policy advocate, on.docx
As an astute social worker and professional  policy advocate, on.docx
 
As a special education professional, it is important to be aware of .docx
As a special education professional, it is important to be aware of .docxAs a special education professional, it is important to be aware of .docx
As a special education professional, it is important to be aware of .docx
 
As an incoming CEO, how would you have approached the senior leaders.docx
As an incoming CEO, how would you have approached the senior leaders.docxAs an incoming CEO, how would you have approached the senior leaders.docx
As an incoming CEO, how would you have approached the senior leaders.docx
 
As a prison administrator (wardensuperintendent), what would your r.docx
As a prison administrator (wardensuperintendent), what would your r.docxAs a prison administrator (wardensuperintendent), what would your r.docx
As a prison administrator (wardensuperintendent), what would your r.docx
 
As a helpful tool for schools, organizations, and agencies working w.docx
As a helpful tool for schools, organizations, and agencies working w.docxAs a helpful tool for schools, organizations, and agencies working w.docx
As a helpful tool for schools, organizations, and agencies working w.docx
 
ArticleInterspecies ChimerismwithMammalian Pluripotent.docx
ArticleInterspecies ChimerismwithMammalian Pluripotent.docxArticleInterspecies ChimerismwithMammalian Pluripotent.docx
ArticleInterspecies ChimerismwithMammalian Pluripotent.docx
 
As a future leader in the field of health care administration, you m.docx
As a future leader in the field of health care administration, you m.docxAs a future leader in the field of health care administration, you m.docx
As a future leader in the field of health care administration, you m.docx
 
Article  Title  and  Date  of  the  Article   .docx
Article  Title  and  Date  of  the  Article   .docxArticle  Title  and  Date  of  the  Article   .docx
Article  Title  and  Date  of  the  Article   .docx
 
Article The Effects of Color on the Moods of College .docx
Article The Effects of Color on the Moods  of College .docxArticle The Effects of Color on the Moods  of College .docx
Article The Effects of Color on the Moods of College .docx
 
Art  museums  and art  galleries  are two different types of entitie.docx
Art  museums  and art  galleries  are two different types of entitie.docxArt  museums  and art  galleries  are two different types of entitie.docx
Art  museums  and art  galleries  are two different types of entitie.docx
 
As a clinical social worker it is important to understand group .docx
As a clinical social worker it is important to understand group .docxAs a clinical social worker it is important to understand group .docx
As a clinical social worker it is important to understand group .docx
 
artsArticleCircling Round Vitruvius, Linear Perspectiv.docx
artsArticleCircling Round Vitruvius, Linear Perspectiv.docxartsArticleCircling Round Vitruvius, Linear Perspectiv.docx
artsArticleCircling Round Vitruvius, Linear Perspectiv.docx
 
Artists are often involved in national social movements that result .docx
Artists are often involved in national social movements that result .docxArtists are often involved in national social movements that result .docx
Artists are often involved in national social movements that result .docx
 

Recently uploaded

Z Score,T Score, Percential Rank and Box Plot Graph
Z Score,T Score, Percential Rank and Box Plot GraphZ Score,T Score, Percential Rank and Box Plot Graph
Z Score,T Score, Percential Rank and Box Plot GraphThiyagu K
 
Grant Readiness 101 TechSoup and Remy Consulting
Grant Readiness 101 TechSoup and Remy ConsultingGrant Readiness 101 TechSoup and Remy Consulting
Grant Readiness 101 TechSoup and Remy ConsultingTechSoup
 
Interactive Powerpoint_How to Master effective communication
Interactive Powerpoint_How to Master effective communicationInteractive Powerpoint_How to Master effective communication
Interactive Powerpoint_How to Master effective communicationnomboosow
 
The Most Excellent Way | 1 Corinthians 13
The Most Excellent Way | 1 Corinthians 13The Most Excellent Way | 1 Corinthians 13
The Most Excellent Way | 1 Corinthians 13Steve Thomason
 
Software Engineering Methodologies (overview)
Software Engineering Methodologies (overview)Software Engineering Methodologies (overview)
Software Engineering Methodologies (overview)eniolaolutunde
 
APM Welcome, APM North West Network Conference, Synergies Across Sectors
APM Welcome, APM North West Network Conference, Synergies Across SectorsAPM Welcome, APM North West Network Conference, Synergies Across Sectors
APM Welcome, APM North West Network Conference, Synergies Across SectorsAssociation for Project Management
 
Presentation by Andreas Schleicher Tackling the School Absenteeism Crisis 30 ...
Presentation by Andreas Schleicher Tackling the School Absenteeism Crisis 30 ...Presentation by Andreas Schleicher Tackling the School Absenteeism Crisis 30 ...
Presentation by Andreas Schleicher Tackling the School Absenteeism Crisis 30 ...EduSkills OECD
 
SOCIAL AND HISTORICAL CONTEXT - LFTVD.pptx
SOCIAL AND HISTORICAL CONTEXT - LFTVD.pptxSOCIAL AND HISTORICAL CONTEXT - LFTVD.pptx
SOCIAL AND HISTORICAL CONTEXT - LFTVD.pptxiammrhaywood
 
Measures of Dispersion and Variability: Range, QD, AD and SD
Measures of Dispersion and Variability: Range, QD, AD and SDMeasures of Dispersion and Variability: Range, QD, AD and SD
Measures of Dispersion and Variability: Range, QD, AD and SDThiyagu K
 
JAPAN: ORGANISATION OF PMDA, PHARMACEUTICAL LAWS & REGULATIONS, TYPES OF REGI...
JAPAN: ORGANISATION OF PMDA, PHARMACEUTICAL LAWS & REGULATIONS, TYPES OF REGI...JAPAN: ORGANISATION OF PMDA, PHARMACEUTICAL LAWS & REGULATIONS, TYPES OF REGI...
JAPAN: ORGANISATION OF PMDA, PHARMACEUTICAL LAWS & REGULATIONS, TYPES OF REGI...anjaliyadav012327
 
9548086042 for call girls in Indira Nagar with room service
9548086042  for call girls in Indira Nagar  with room service9548086042  for call girls in Indira Nagar  with room service
9548086042 for call girls in Indira Nagar with room servicediscovermytutordmt
 
Student login on Anyboli platform.helpin
Student login on Anyboli platform.helpinStudent login on Anyboli platform.helpin
Student login on Anyboli platform.helpinRaunakKeshri1
 
CARE OF CHILD IN INCUBATOR..........pptx
CARE OF CHILD IN INCUBATOR..........pptxCARE OF CHILD IN INCUBATOR..........pptx
CARE OF CHILD IN INCUBATOR..........pptxGaneshChakor2
 
Activity 01 - Artificial Culture (1).pdf
Activity 01 - Artificial Culture (1).pdfActivity 01 - Artificial Culture (1).pdf
Activity 01 - Artificial Culture (1).pdfciinovamais
 
A Critique of the Proposed National Education Policy Reform
A Critique of the Proposed National Education Policy ReformA Critique of the Proposed National Education Policy Reform
A Critique of the Proposed National Education Policy ReformChameera Dedduwage
 
Sanyam Choudhary Chemistry practical.pdf
Sanyam Choudhary Chemistry practical.pdfSanyam Choudhary Chemistry practical.pdf
Sanyam Choudhary Chemistry practical.pdfsanyamsingh5019
 
Introduction to Nonprofit Accounting: The Basics
Introduction to Nonprofit Accounting: The BasicsIntroduction to Nonprofit Accounting: The Basics
Introduction to Nonprofit Accounting: The BasicsTechSoup
 
Beyond the EU: DORA and NIS 2 Directive's Global Impact
Beyond the EU: DORA and NIS 2 Directive's Global ImpactBeyond the EU: DORA and NIS 2 Directive's Global Impact
Beyond the EU: DORA and NIS 2 Directive's Global ImpactPECB
 
Separation of Lanthanides/ Lanthanides and Actinides
Separation of Lanthanides/ Lanthanides and ActinidesSeparation of Lanthanides/ Lanthanides and Actinides
Separation of Lanthanides/ Lanthanides and ActinidesFatimaKhan178732
 
Kisan Call Centre - To harness potential of ICT in Agriculture by answer farm...
Kisan Call Centre - To harness potential of ICT in Agriculture by answer farm...Kisan Call Centre - To harness potential of ICT in Agriculture by answer farm...
Kisan Call Centre - To harness potential of ICT in Agriculture by answer farm...Krashi Coaching
 

Recently uploaded (20)

Z Score,T Score, Percential Rank and Box Plot Graph
Z Score,T Score, Percential Rank and Box Plot GraphZ Score,T Score, Percential Rank and Box Plot Graph
Z Score,T Score, Percential Rank and Box Plot Graph
 
Grant Readiness 101 TechSoup and Remy Consulting
Grant Readiness 101 TechSoup and Remy ConsultingGrant Readiness 101 TechSoup and Remy Consulting
Grant Readiness 101 TechSoup and Remy Consulting
 
Interactive Powerpoint_How to Master effective communication
Interactive Powerpoint_How to Master effective communicationInteractive Powerpoint_How to Master effective communication
Interactive Powerpoint_How to Master effective communication
 
The Most Excellent Way | 1 Corinthians 13
The Most Excellent Way | 1 Corinthians 13The Most Excellent Way | 1 Corinthians 13
The Most Excellent Way | 1 Corinthians 13
 
Software Engineering Methodologies (overview)
Software Engineering Methodologies (overview)Software Engineering Methodologies (overview)
Software Engineering Methodologies (overview)
 
APM Welcome, APM North West Network Conference, Synergies Across Sectors
APM Welcome, APM North West Network Conference, Synergies Across SectorsAPM Welcome, APM North West Network Conference, Synergies Across Sectors
APM Welcome, APM North West Network Conference, Synergies Across Sectors
 
Presentation by Andreas Schleicher Tackling the School Absenteeism Crisis 30 ...
Presentation by Andreas Schleicher Tackling the School Absenteeism Crisis 30 ...Presentation by Andreas Schleicher Tackling the School Absenteeism Crisis 30 ...
Presentation by Andreas Schleicher Tackling the School Absenteeism Crisis 30 ...
 
SOCIAL AND HISTORICAL CONTEXT - LFTVD.pptx
SOCIAL AND HISTORICAL CONTEXT - LFTVD.pptxSOCIAL AND HISTORICAL CONTEXT - LFTVD.pptx
SOCIAL AND HISTORICAL CONTEXT - LFTVD.pptx
 
Measures of Dispersion and Variability: Range, QD, AD and SD
Measures of Dispersion and Variability: Range, QD, AD and SDMeasures of Dispersion and Variability: Range, QD, AD and SD
Measures of Dispersion and Variability: Range, QD, AD and SD
 
JAPAN: ORGANISATION OF PMDA, PHARMACEUTICAL LAWS & REGULATIONS, TYPES OF REGI...
JAPAN: ORGANISATION OF PMDA, PHARMACEUTICAL LAWS & REGULATIONS, TYPES OF REGI...JAPAN: ORGANISATION OF PMDA, PHARMACEUTICAL LAWS & REGULATIONS, TYPES OF REGI...
JAPAN: ORGANISATION OF PMDA, PHARMACEUTICAL LAWS & REGULATIONS, TYPES OF REGI...
 
9548086042 for call girls in Indira Nagar with room service
9548086042  for call girls in Indira Nagar  with room service9548086042  for call girls in Indira Nagar  with room service
9548086042 for call girls in Indira Nagar with room service
 
Student login on Anyboli platform.helpin
Student login on Anyboli platform.helpinStudent login on Anyboli platform.helpin
Student login on Anyboli platform.helpin
 
CARE OF CHILD IN INCUBATOR..........pptx
CARE OF CHILD IN INCUBATOR..........pptxCARE OF CHILD IN INCUBATOR..........pptx
CARE OF CHILD IN INCUBATOR..........pptx
 
Activity 01 - Artificial Culture (1).pdf
Activity 01 - Artificial Culture (1).pdfActivity 01 - Artificial Culture (1).pdf
Activity 01 - Artificial Culture (1).pdf
 
A Critique of the Proposed National Education Policy Reform
A Critique of the Proposed National Education Policy ReformA Critique of the Proposed National Education Policy Reform
A Critique of the Proposed National Education Policy Reform
 
Sanyam Choudhary Chemistry practical.pdf
Sanyam Choudhary Chemistry practical.pdfSanyam Choudhary Chemistry practical.pdf
Sanyam Choudhary Chemistry practical.pdf
 
Introduction to Nonprofit Accounting: The Basics
Introduction to Nonprofit Accounting: The BasicsIntroduction to Nonprofit Accounting: The Basics
Introduction to Nonprofit Accounting: The Basics
 
Beyond the EU: DORA and NIS 2 Directive's Global Impact
Beyond the EU: DORA and NIS 2 Directive's Global ImpactBeyond the EU: DORA and NIS 2 Directive's Global Impact
Beyond the EU: DORA and NIS 2 Directive's Global Impact
 
Separation of Lanthanides/ Lanthanides and Actinides
Separation of Lanthanides/ Lanthanides and ActinidesSeparation of Lanthanides/ Lanthanides and Actinides
Separation of Lanthanides/ Lanthanides and Actinides
 
Kisan Call Centre - To harness potential of ICT in Agriculture by answer farm...
Kisan Call Centre - To harness potential of ICT in Agriculture by answer farm...Kisan Call Centre - To harness potential of ICT in Agriculture by answer farm...
Kisan Call Centre - To harness potential of ICT in Agriculture by answer farm...
 

The White Standard Racial Bias in Leader CategorizationAs.docx

  • 1. The White Standard: Racial Bias in Leader Categorization Ashleigh Shelby Rosette Duke University Geoffrey J. Leonardelli University of Toronto Katherine W. Phillips Northwestern University In 4 experiments, the authors investigated whether race is perceived to be part of the business leader prototype and, if so, whether it could explain differences in evaluations of White and non-White leaders. The first 2 studies revealed that “being White” is perceived to be an attribute of the business leader prototype, where participants assumed that business leaders more than nonleaders were White, and this inference occurred regardless of base rates about the organization’s racial composition (Study 1), the racial composition of organizational roles, the business industry, and the types of racial minority groups in the organization (Study 2). The final 2 studies revealed that a leader categorization explanation could best account for differences in White and non-White leader evaluations, where White targets were evaluated as more effective leaders (Study 3) and as having more leadership potential (Study 4), but only when the leader had recently been given credit for organizational success, consistent with the prediction that leader prototypes are more likely to be used when they
  • 2. confirm and reinforce individualized information about a leader’s performance. The results demonstrate a connection between leader race and leadership categorization. Keywords: racial bias, prototypical leadership characteristics, stereotypes, leadership categorization, diversity Substantial progress has been made by underrepresented minor- ities in Corporate America since the 1960s civil rights movement knocked down opaque racial barriers and championed equal op- portunity in organizational settings. Over time, African Americans have come to occupy a greater percentage of entry-level positions and more middle management roles (Tomaskovic-Devey et al., 2006; U.S. Bureau of Labor Statistics, 2004). In addition, other racial minority groups, such as Asian Americans (Takaki, 1989; Woo, 2000) and Hispanic Americans (GAO Report, 2006), have also made noticeable inroads at lower and middle levels in busi- ness organizations. Although progress is evident at some positions, racial minorities are still less visible in top leadership positions than would be expected on the basis of population base rates (The Alliance for Board Diversity, 2005; Corporate Board Initiative, 2006; Fortune, 2006; McCoy, 2007; Thomas & Gabarro, 1999). Given that explicit racial barriers no longer exist, what is prevent- ing well-trained racial minorities from advancing within the orga- nizational hierarchy to become leaders in U.S. companies?
  • 3. One important determinant for whether employees advance to leadership positions is how their leadership skills and task com- petencies are evaluated (Connelly et al., 2000; DeVries, 2000; Hollander, 1960; Levinson, 1980; Lord, de Vader, & Alliger, 1986). Leadership evaluations are an assessment of an organiza- tion member’s ability to produce positive outcomes for the orga- nization and affect who is appraised favorably and who is allowed to lead the organization (Calder, 1977; Lord & Maher, 1991; Meindl & Ehrlich, 1987; Meindl, Ehrlich, & Dukerich, 1985). According to leadership categorization theory, leaders will be evaluated as most effective when they are perceived to possess prototypical characteristics of leadership (Lord & Maher, 1991). Specifically, over time individuals develop a set of beliefs about the behaviors and characteristics of leaders. These beliefs develop into leadership categories, and from the various categories of leadership evolve a standard example or typical leader category known as a leadership prototype. Those leaders who possess characteristics that are most consistent with the evaluators’ leader prototype are appraised most favorably. Several studies have shown that the fit of individuals’ characteristics to evaluators’ leadership prototypes affects leadership perceptions and leadership ratings across several domains, including gender (Brenner, Tomk- iewicz, & Schein, 1989; Eagly & Karau, 2002; Heilman, Block, Martell, & Simon, 1989; Nye & Forsyth, 1991; Schein, 1973; Scott Ashleigh Shelby Rosette, Fuqua School of Business, Duke University; Geoffrey J. Leonardelli, J. L. Rotman School of Management,
  • 4. University of Toronto, Toronto, Ontario, Canada; Katherine W. Phillips, Management and Organizations Department, Kellogg School of Management, North- western University. We are grateful for the support of our colleagues Jim Phillips, Sim Sitkin, Melissa Thomas-Hunt, and Leigh Thompson for their helpful sug- gestions and recommendations on earlier versions of this article. We thank Barbara Carlin, Bill Walker, Rick Larrick, and Lehman Benson, who assisted us with data collection. We are appreciative to Leigh Plunkett Tost, Moira Praxedes, and Catherine Shea, who worked as research assis- tants on this project. We are especially thankful to our colleagues in our respective departments for all of their support. Correspondence concerning this article should be addressed to Ashleigh Shelby Rosette, Fuqua School of Business, Duke University, 1 Towerview Road, P.O. Box 90120, Durham, NC 27701-0120. E-mail: [email protected] Journal of Applied Psychology Copyright 2008 by the American Psychological Association 2008, Vol. 93, No. 4, 758 –777 0021-9010/08/$12.00 DOI: 10.1037/0021-9010.93.4.758 758
  • 5. & Brown, 2006), culture (Ensari & Murphy, 2003), and politics (Foti, Fraser, & Lord, 1982), yet the connection between race and leadership prototypes has been largely ignored. The purpose of this article is to fill that research gap and to examine leadership prototypes as one potential explanation for racial bias in top leadership positions. That is, top leadership positions are most frequently occupied by White leaders as op- posed to racial minority leaders, and expectations regarding the prototypical characteristics of the race of the leader may help to explain why White leaders are preferred over racial minority leaders. By examining this type of racial bias in leadership posi- tions, we can offer a more in-depth understanding of leadership categorization and leadership prototypes as applied to U.S. busi- ness leaders. We propose that race, and specifically “being White,” may be a prototypical attribute of leadership. When asked to consider the career advancement and perfor- mance appraisals of others, many people in the United States believe they yield to principles of meritocracy (Castilla, in press; Rosette & Thompson, 2005) and practice a philosophy of color- blindness (Reitman, 2006; Wildman, 1996). That is, they believe that race is not important and does not affect their workplace evaluations of others (Rosette, 2006). In stark contrast to these assertions, we propose that race plays a critical role in organiza- tional settings, particularly when leadership evaluations are con-
  • 6. sidered. In this article, we explored the connection between leader race and leadership prototypes and tested whether, at least in the United States, Whites are perceived to be prototypical business leaders and, if so, whether more favorable evaluations of White relative to non-White leaders could be best explained by leadership categorization theory. Leadership Categorization Theory Leadership categorization theory is largely based on traditional categorization theory, which describes how individuals develop categories to help themselves organize and process information efficiently (Rosch, 1978). Categories possess very distinct features (Crocker, Fiske, & Taylor, 1984), summarize images and labels by others in the environment (Cantor & Mischel, 1979), and are comprised of similar, yet nonidentical members (Lakoff, 1987). Previous empirical research has demonstrated that prototypes evolve from categories and represent an original type, form, or instance of something that serves as a typical example or standard of other things in the same category (Rosch & Mervis, 1975). Specifically, a prototype represents a central tendency or average characteristic of the members of a category (Rosch, 1978; Smith & Medin, 1981). For example, within the context of a business organization, the characteristics “a person” and “has followers” are common to most leaders. Characteristics such as these help to distinguish one category (i.e., leaders) from another category (i.e.,
  • 7. nonleaders) and are said to be prototypical characteristics. That is, such characteristics provide a cognitive cue to the evaluator as to the likelihood that an entity falls in a particular category (Beach, 1964; Kruschke & Johansen, 1999; Martignon, Vitouch, Takezawa, & Forster, 2003; Reed, 1972). Utilizing the basic concepts of categorization theory, Lord and his colleagues developed leadership categorization theory (Lord, 1985; Lord, Foti, & Phillips, 1982; Lord & Maher, 1991). In contrast to other leadership theories that focus on differences in performance or influence, such as charismatic leadership (House, 1977), transformational leadership (Bass, 1985; J. M. Burns, 1978), and visionary leadership (Bennis & Nanus, 1985; Kouzes & Posner, 1987), leadership categorization theory investigates eval- uators’ perceptions of leaders. According to the theory, evaluators compare a target person with already preexisting knowledge struc- tures called leadership prototypes, which reflect the average char- acteristics of leaders in a given context. The process of comparing a target person with a leadership prototype is called a recognition- based process (Lord & Maher, 1990, 1991) and can influence evaluators’ perceptions of targets. This recognition-based process can lead to a match or mismatch between the target person’s
  • 8. traits and the traits that are common to the evaluators’ leadership pro- totype. With a match, the target individual is categorized as a leader, but with a mismatch, the target is not categorized as a leader. When a match occurs, target individuals who are perceived to be more prototypical leaders have been shown to be evaluated more favorably (Eagly & Karau, 2002; Ensari & Murphy, 2003; Nye & Forsyth, 1991; Phillips, 1984; Phillips & Lord, 1982; Rush & Russell, 1988; Scott & Brown, 2006). In this work, we sought to investigate whether a person’s race may be part of the business leader prototype. Race as an Attribute of the Leader Prototype We posit that, at least in the United States, a central character- istic of leadership is “being White” and accordingly, that evalua- tors will perceive that White leaders are more prototypical busi- ness leaders than are leaders who are racial minorities. We argue that it is the development of evaluators’ leadership prototypes that likely leads to the incorporation of race into the leader prototype and, consequently, to the belief that prototypical business leaders are White leaders. According to Rosch’s (1978) categorization theory, prototypes develop from familiarity with examples from categories and encompass two distinct structural principles. Pro- totypes develop because people learn which characteristics are central among members of a category (first principle) and which are not as central among members of other categories (second
  • 9. principle). Lord and Maher (1991) summarized Rosch’s prototype development process in this way: . . .category prototypes develop from experience with examples of categories. Over time, people learn which attributes are both widely shared among category members (being high in family resemblance) and relatively rare among nonmembers of a category (being high in cue validity). . .. Prior to the development of a category prototype, categories are often defined on the basis of exemplars— concrete examples of specific category members. For example, someone who has no experience with military leaders might define this category based on his or her knowledge of one salient military leader (for example, Eisenhower or Patton). But as experience with military leaders accumulates, a more general and representative composite of military leaders would define the category. (p. 43) Empirical work supports this prototype development process. Through repeated interactions with examples of a given category, individuals have been shown to abstract characteristics from these observed examples to develop a prototype (Lord, Foti, & de Vader, 1984; Rosch & Mervis, 1975). We posit that the exemplars of leaders to which individuals are exposed are likely to be White,
  • 10. 759THE WHITE STANDARD and thus, when individuals abstract attributes that are common to examples of business leaders but are perhaps less common to examples of nonleaders, they will conclude that the average leader, the prototypical leader, must be White. White exemplars of leaders may originate from two sources. First, evaluators are presently and persistently exposed to White individuals holding prominent leadership positions. Recent busi- ness statistics support this assertion. In the U.S. workforce, more than 87% of chief executive positions (U.S. Bureau of Labor Statistics, 2006), 84% of the seats on Fortune 100 Boards of Directors (The Alliance for Board Diversity, 2005), and more than 97% of Fortune 500 chief executive officer (CEO) positions were held by Whites (Corporate Board Initiative, 2006; Fortune, 2006; McCoy, 2007). Given the close alliance between politics and business, political leaders may also provide salient exemplars. In 2007, 96% of state governors (National Governors Association, 2007), 94% of U.S. Senators (U.S. Senate Statistics, 2007), and 83% of congresspersons in the U.S. House of Representatives were White (U.S. House of Representatives Statistics, 2007). It also should be noted that these percentages are above those predicted by the proportion of White individuals in the general U.S. popu- lation, especially when the Hispanic population is considered as
  • 11. a separate category (61%; U.S. Census Bureau, 2006). Second, and perhaps more important, U.S. history may also influence leadership perceptions, as historically, both in politics and in business, prominent leaders (and perhaps, many individu- als’ first encounters with leadership exemplars) have been White. For example, all 43 U.S. presidents have been White. Moreover, the more noted historical examples of American business success are of White entrepreneurs: in the 19th century, Andrew Carnegie (steel) and John D. Rockefeller (oil); in the 20th century, Henry Ford (automobiles), Ray Kroc (McDonalds), Conrad Hilton (ho- tels), and Ross Perot (technology services); and in the 21st century, Bill Gates (computer technology) and Steven Forbes (media). Such historical perceptions of White individuals in leadership positions reinforce the assertion that being White is a primary and probable characteristic of leadership. Thus, we posit that being White is a central characteristic of the business leader prototype. Moreover, we generate two novel over- arching predictions based on this position. First, if being White is an attribute of the business leader prototype, then observers will assume that leaders more than nonleaders are White. Second, given that prototypical leaders are evaluated more favorably than nonprototypical leaders (Eagly & Karau, 2002; Ensari & Murphy,
  • 12. 2003; Nye & Forsyth, 1991; Phillips, 1984; Phillips & Lord, 1982; Rush & Russell, 1988; Scott & Brown, 2006), and because we propose that White leaders are perceived to be more prototypical than non-White leaders, race may lead to biased evaluations of leadership through the process of leader categorization. That is, leaders who are racial minorities receive worse performance eval- uations than White leaders because White leaders are perceived to be more similar to the leader prototype. These race differences in the leader prototypes may help explain why leaders who are members of racial minorities receive worse performance-related evaluations than do White leaders (see Cox & Nkomo, 1986; Ford, Kraiger, & Schechtman, 1986; Greenhaus & Parasuraman, 1993; Greenhaus, Parasuraman, & Wormley, 1990; Jones, 1986; Powell & Butterfield, 1997; and Waldman & Avolio, 1991, for examples of race differences in performance evaluations). Certainly, there may be other explanations of differences in the evaluations of White and non-White leaders. For example, some studies of leadership effectiveness have demonstrated that group prototypes play a significant role in leadership evaluations (Hains, Hogg, & Duck, 1997; Hogg et al., 2006; Martin & Epitropaki, 2001; Pierro, Cicero, Bonaiuto, van Knippenberg, & Kruglanski, 2005; Platow & van Knippenberg, 2001; Platow, van Knippen- berg, Haslam, van Knippenberg, & Spears, 2006; van Knippenberg & van Knippenberg, 2005). The more a leader represents the prototypical characteristics of a group to which the evaluators
  • 13. belong, the more favorably that leader will be evaluated. From this perspective, White evaluators will rate White leaders more favor- ably because White leaders are more prototypical of the evalua- tors’ racial group. By contrast, a leadership prototype explanation would predict that, regardless of their racial group, evaluators will be likely to perceive White leaders more favorably than non- White leaders. Alternatively, the more negative racial stereotypes of some minorities could also be used to explain race differences in lead- ership evaluations. From this perspective, Whites and Asian Amer- icans, who are both generally associated with positive racial ste- reotypes, such as being smart, industrious, and ambitious (Hurh & Kim, 1989; Kitano & Sue, 1975; Lee, 1994), would be evaluated more favorably than Hispanic Americans and African Americans, who are frequently associated with negative racial stereotypes, such as being lazy, ignorant, and incompetent (P. Burns & Gimpel, 2000; Devine & Elliot, 1995; Dixon & Rosenbaum, 2004; Krueger, 1996; Mackie, Hamilton, Susskind, & Rosselli, 1996; Marin, 1984; Plous & Williams, 1995). Some evidence supports this stereotype explanation. Chung-Herrera and Lankau (2005) demonstrated that White evaluators identified a higher correspon- dence between the stereotypical characteristics of White and Asian
  • 14. American managers and the characteristics of a leader prototype than between the stereotypical characteristics of African American and Hispanic American managers and characteristics of a leader prototype. In other words, differences in evaluations of managers could be due to differences in race stereotypes rather than fit with the leader prototype. However, this negative racial stereotype explanation is not unique to leaders, as it has been shown to persist among evalua- tions of nonleaders as well. For example, empirical studies on aversive racism, a subtle form of racial bias that stems from negative race stereotypes, have demonstrated a consistent bias against racial minorities in favor of Whites in nonleadership po- sitions (Aberson & Ettlin, 2004; Dovidio & Gaertner, 2000). According to our leadership prototype prediction, the leader pro- totype includes the attribute “being White,” not merely stereotyp- ical characteristics that are associated with Whites in both leader and nonleader categories. Moreover, whereas a race stereotype explanation suggests that White and Asian American leaders would be evaluated more favorably than African American and Hispanic American leaders, it is our prediction that White leaders will be evaluated more favorably than Asian American leaders as well. Overview of Studies Across four studies, we tested whether being White was part of the U.S. business leader prototype and, if so, how it might
  • 15. influ- 760 ROSETTE, LEONARDELLI, AND PHILLIPS ence observers’ leadership evaluations. In the first two studies, we investigated whether individuals were more likely to assume that business leaders rather than nonbusiness leaders were White and whether assumptions about a leader’s race were inferred from the leader prototype or from race base rates in the overall organization (i.e., the racial composition of the organization’s members; Study 1), race base rates in organizational positions, the leader’s business industry, or the race of the racial minorities in the organization (Study 2). In the final two studies, we investigated whether a leader prototype explanation could best explain differences in White and non-White leader evaluations by investigating the con- sequences of a leader’s race for evaluations of leader effectiveness (Study 3) and leadership potential (Study 4). In these studies we tested our predictions with different sample populations (undergraduates, master of business administration [MBA] students, and graduate students), evaluating leaders in different roles (project leader, division leader, CEO), across dif- ferent industries (social services, financial services), and with different racial characteristics (White, Black, Hispanic, and Asian). Altogether, we think the data contribute to the
  • 16. connection between leader race and a business leader prototype and have implications for workplace diversity, performance evaluation, and career management. Study 1: Base Rates and Leader Race This study tested the two structural principles of prototype development: whether being White was perceived as a central characteristic to the business leader prototype (first principle) and whether being White was perceived as less central to a nonbusi- ness leader category, employees (second principle). We examined which race characteristic observers would attribute to a target person when that person was described as a leader or employee. According to the literatures on category accessibility (Bruner, 1957; Kunda & Spencer, 2003) and representativeness (Kahne- man, 2003; Kahneman & Tversky, 1973), individuals are more likely to describe a target person in ways consistent with the person’s category of membership. Specifically, in the absence of individuating information, when an observer encounters a target that is a member of a social group, the observer may assume that the target has the qualities of the group prototype as opposed to having qualities that are unique to the target (for a review, see Kunda & Thagard, 1996). For example, an engineer may be assumed to be a tad bit geeky and to possess a mechanical-like writing style, even though these characteristics may or may not accurately describe the target. Thus, if being White is more closely associated with the leader prototype, then observers will be more likely to perceive a leader rather than a nonleader to be White.
  • 17. Also, we wanted to investigate the strength of the leader proto- type by pitting the predicted recognition-based processes specific to prototype use against conflicting information regarding a per- son’s statistical likelihood (also known as base rate) of being White (Kahneman, 2003; Kahneman & Tversky, 1973). When predicting an individual’s personal characteristics, the existing base rates of a given characteristic have been considered reliable determinants of a person’s characteristics. For example, if an organization’s members are 20% White and 80% Hispanic Amer- ican, then probabilistically, any given member is likely to be Hispanic American. However, previous work has found that ob- servers are more likely to maintain consistency between their activated categories and trait inferences (Kahneman & Tversky, 1973), ignoring information about base rates. Thus, if being White is associated with the leader prototype, then there should be no interaction between the target person’s role (employee, leader) and base rate information; instead, a main effect should occur whereby observers will consider leaders to be White more than nonleaders (e.g., employees), regardless of the base rate information (Hypoth- esis 1). Furthermore, if being White is consistent with leader categori- zation, observers should perceive the leader to be White more frequently than the base rate would suggest. In the absence of an activated prototype, information about the organization’s base
  • 18. rates is likely to be a useful determinant of the target’s likelihood of being White. As a consequence, if a prototype was not activated, then observers’ assumptions of race should reflect the base rates; however, if the prototype was activated, then it would be under these conditions that assumptions of race should deviate from base rates. Thus, if being White is associated with the leader prototype, then observers will be more likely to deviate from base rates in the leader than in the nonleader (e.g., employee) conditions when assessing the race of the target (Hypothesis 2). Both hypotheses were tested in the following study. Method Participants and Study Design A total of 146 undergraduate participants (68 White, 13 African American, 21 Hispanic, 37 Asians, 6 other, 1 did not respond) completed the study in exchange for extra credit in a business management course. At the time of the study, 60% of the partic- ipants were employed. Of the participants who reported not being currently employed, 95% had previously worked for a company or corporation (1 person did not respond to this question). Partici- pants’ work experience did not predict the dependent measure in this study, whether alone or in interaction with the experimental manipulations, and thus, it will not be discussed further. The study consisted of a 2 (interviewee role: leader, employee) � 3 (race base rate: no information, 50% White, 20% White) between-
  • 19. participants design. Procedure Participants were instructed to read a newspaper article and answer questions about what they read. The article described a fictitious company project (Selcom, Inc.’s Project NOVA) and included an interview with a business representative that described progress on a project as consistent with expectations (see the manipulation script in Appendix A). We manipulated the role of the organizational representative so that the representative was described as either the leader of the project or as an employee who worked on the project. We manipulated the racial composition of the organization such that the organization’s workforce composi- tion was either 50% White or 20% White, or no mention of the racial composition was provided. According to our leader proto- type prediction, participants should be less likely to take into account the base rate information when determining the race of the person in the business leader category than in determining the race 761THE WHITE STANDARD of the person in the nonbusiness leader category (employee). For example, in the 20% condition, we expected individuals to atten- uate their presumption that the leader was White less than their presumption that the employee was White.
  • 20. After reading the article, participants answered questions that assessed the effectiveness of the interviewee role and base-rate manipulations. Then, participants answered the question “What do you think is the race of the person interviewed?” Participants could select one of the following randomized options: Hispanic/Latin American, Asian/Asian American/Pacific Islander, White/ Caucasian American, Black/African American, or Native Ameri- can/Alaskan Native. Results All of the participants in the study correctly reported the ma- nipulation checks for interviewee role and race base rates. Hypoth- esis 1 predicted that leaders would be perceived to be White more frequently than nonleaders regardless of the base rates. To test this prediction, we had participants record their decisions about the interviewee’s race, discriminating between those who classified the interviewee as White (1) or non-White (0). Reclassifying the data in this way simplified analysis procedures, allowing us to use binary hierarchical logistic regression analysis (Kleinbaum, 1994; see summary of the regression analysis in Table 1). The first step of the analysis revealed a main effect of the interviewee role manipulation (B � �0.76, SE � 0.38, p � .05, r � .17).1 In particular, independent of the base-rate manipulation, 72% of the participants perceived that the leader was White, whereas only 56% of the participants perceived that the employee was White.
  • 21. In addition, the analysis revealed a main effect in the base rate condition (Wald � 17.01, p � .001, r � .33). Participants in the 20% condition perceived the interviewee as White less often (23 of 52 participants � 44%) than did those participants in the no- mention condition (40 of 48 participants � 83%) or the 50% condition (33 of 46 participants � 72%). The interaction between interviewee role and base rates, which was tested in the second step of the logistic regression analysis, was not significant ( p � .36). The presence of a base rate main effect illustrates that participants in the 50% White and 20% White conditions consid- ered racial composition information when making assumptions about the interviewee’s race, but the absence of an interaction reveals that regardless of base rate, observers were more likely to perceive the leader than nonleader as being White. Thus, Hypoth- esis 1 was supported. Hypothesis 2 predicted that the participants would perceive the leader to be White more frequently than the 50% base rate or 20% base rate would suggest (i.e., perceptions would deviate from base rates) but that this would not be the case for nonleaders (e.g., employees). That is, we expected the observed differences in percentages to be significantly different from the base rate in the leader conditions but not in the employee conditions. We used Z tests for proportion to examine this specific prediction, and Hy- pothesis 2 was supported. In the 50% base rate condition, partic-
  • 22. ipants presumed that the leader was White significantly more often than the base rate would have suggested (18 of 22 participants � 82%; Z � 2.23, p � .03), but this was not so when forming impressions of the employee (15 of 24 participants � 63%; Z � 0.88, p � .38). A similar pattern was noted in the 20% base rate condition (for the leader, 14 of 28 participants � 50%, Z � 2.35, p � .02; for the employee, 9 of 24 participants � 37.5%, Z � 0.54, p � .59). These analyses lend support to the prediction that participants relied on a prototype to form impressions of the interviewee’s race in the leader condition but not in the employee condition. Discussion The findings support the prediction that being White is an attribute of the business leader prototype. First, independent of the organization’s race base rates, leaders more than employees were assumed to be White. This difference in leader perceptions pro- vides support for the first structural principle of prototype devel- opment: that being White is characteristic of the business leader prototype. Second, in support of the second structural principle, when the nonleader category was considered, the rate at which employees were perceived to be White did not deviate from the race base rates in the two conditions where individuals were 1 To place effect size estimates into a common metric across studies and analysis procedures, we opted to use the “r family” of effect
  • 23. size estimates, where we estimated rcontrast for ANOVAs (Rosenthal, Rosnow, & Rubin, 2000) and requivalent for logistic regression analyses (Rosenthal & Rubin, 2003). Estimates had unsigned (and thus positive) directions and could range from 0 to 1. Table 1 Binary Hierarchical Logistic Regression for Perceptions of Leader Race Regressed on Interviewee Role and Base Rate (Study 1) Variable Step 0 Step 1 Step 2 B SE Wald B SE Wald B SE Wald Constant 0.65 0.17 13.99*** 0.11 0.33 0.11 0.00 0.38 0.00 Interviewee role �0.76 0.38 3.90* �0.51 0.57 0.81 Base rate 17.01** 10.47** Interviewee Role � Base Rate 0.34 Note. Interviewee role and base rate were treated as categorical variables for the analysis. The leader role condition was used as the reference point for the interviewee role manipulation tests, and perceptions of leader race was coded dichotomously (1 � White, 0 � other races). Because base rate manipulation had three levels, its tests (either main effects tests or tests of interactions involving this variable) did not have a single condition that represented a reference point; rather, the table contains the
  • 24. overall test of this variable, the Wald statistic. *p � .05. **p � .01. ***p � .001. 762 ROSETTE, LEONARDELLI, AND PHILLIPS informed of race base rates. When Whites comprised a smaller percentage of the employees in the organization, they were less likely to be perceived as employees. When Whites comprised a larger percentage of the employees in the organization, they were more likely to be perceived as employees. Thus, being White is not likely to be very central to the nonbusiness leader category. Taken together, these results suggest that being White is an attribute of the business leader prototype. These findings are consistent with our predictions, and we sought to build more confidence into the reliability and generalizability of these effects by conducting a second study. First, in addition to demonstrating that the structural principles of a leadership prototype are present, once a characteristic of a category has been identified as prototypical, inclusion of the char- acteristic as a prototype is also determined by comparing it to other stimuli (Rosch, 1973). In the case of a White leader prototype, that would include the consideration of other races, such as Hispanic Americans, Asian Americans, and African Americans. Second, U.S. businesses consist of a plethora of industries, and it is
  • 25. possible that Whites may be perceived as prototypical leaders in some business industries but not in others. Third, our sample consisted of undergraduates, and although most of the participants had work experience and likely were familiar with perceptions of leadership characteristics, a second, older, and more experienced sample would increase the generalizability of our findings. Study 2: Racial Minorities and Industry Type This study sought to replicate Study 1 findings and to extend the findings in three ways. First, this study tested whether the type of racial minority in the firm affected individuals’ beliefs that being White is a central characteristic to the business leader category. Different stereotypes are associated with different racial minori- ties. For example, Asian Americans are generally regarded as the model minority (Hurh & Kim, 1989; Kitano & Sue, 1975; Lee, 1994), whereas Hispanic Americans (P. Burns & Gimpel, 2000; Dixon & Rosenbaum, 2004; Marin, 1984) and African Americans (Devine & Elliot, 1995; Krueger, 1996; Mackie et al., 1996; Plous & Williams, 1995) are typically associated with more negative stereotypes. It could be that because of the negative stereotypes associated with racial minorities such as African Americans and Hispanic Americans that these racial groups may be particularly incompatible with the business leader category, but when firms comprise a significant population of less stigmatized minorities, such as Asian Americans, individuals may be less likely to per-
  • 26. ceive that being White is a characteristic of the business leader category. Thus, on the basis of the arguments associated with negative race stereotypes, business leaders will be perceived to be White more frequently than nonbusiness leaders when Hispanic and African Americans are represented in the organization than when Asian Americans are represented in the organization (Hy- pothesis 3a). However, if being White is a central characteristic of the business leader category as we predict, the perception of Whites as leaders more frequently than nonleaders will persist regardless of the racial minority that is present in the organization. Hence, business leaders will be perceived to be White more frequently than nonbusiness leaders when Hispanic, African, and Asian Americans are represented in the organization (Hy- pothesis 3b). Second, whether a leader’s race is viewed as central to the business leader category may be dependent on the type of business industry in which the leader works. Whites are especially visible in financial industries (GAO Report, 2006), whereas African Amer- icans (Dorsey, 2005; Jones, 1986; Maume, 1999) and Hispanic Americans (Tienda & Mitchell, 2006) are often concentrated in community relations, human resources, nonprofit, and service sec- tors. Hence, it may be easier for observers to recognize racial minorities as central to the business leader category when social service or nonprofit sectors are considered. That is, Whites will be perceived to be leaders in the financial services industries more so than in the social services industries (Hypothesis 4a). However,
  • 27. if being White is central to the business leader category as we predict, the perception of Whites as leaders more frequently than nonleaders will persist regardless of the type of business industry. Thus, Whites will be perceived to be business leaders more so than business nonleaders in the financial services and social services industries (Hypothesis 4b). These competing hypotheses were tested in Study 2, which manipulated the type of business industry, the target’s role (leader or nonleader), and the racial minority present in the organizational roles. In addition, the participants in this study had substantially more work experience than did the participants in Study 1, and thus this study investigated whether evidence collected in Study 1 would hold with this more experi- enced sample of individuals. Method Participants and Study Design A total of 167 MBA students (118 White, 14 African American, 5 Hispanic, 23 Asians, 7 other) completed the study as a course requirement in a business management course. Although demo- graphics for the particular participants in this study were not attained, the participants represented 41% of their MBA class, which in aggregate had an average age of 29 years and 5.8 years of work experience. The study design consisted of a 2 (interviewee role: leader, assistant) � 2 (industry type: financial, social) � 3 (racial minority included in the base rate: African American, Hispanic American, Asian American) between-participants factor
  • 28. design. Procedure Participants followed the same procedures as those described in Study 1 (see the manipulation script in Appendix B). However, three changes were made to the materials to accommodate the predictions. First, we manipulated the industry in which the ficti- tious company Selcom, Inc. operated. Selcom, Inc. was described either as a financial services provider or as a nonprofit social services provider. Second, we held the level of base rates constant. Specifically, the base rate in this study remained the same across all of the conditions. Given that the strongest test of the White leader prototype prediction in Study 1 occurred when only 20% of the workforce was White, conservatively, we kept the base rate of 20% constant across all the conditions. Moreover, replicating the leader prototype effect under such extreme base rate conditions would be a more revealing test than if we used a more balanced base rate. We did, however, manipulate the type of racial minority 763THE WHITE STANDARD included in the base rate. The racial minority was described as 80% Asian/Asian American, 80% Hispanic/Latin American, or 80% Black/African American.
  • 29. Third, instead of referencing base rates for the entire organiza- tion (as we did in Study 1), the racial minority manipulation was situated in the context of the interviewee role. For example, in the Asian leader condition, the racial composition was described as “Of the project leaders employed by Selcom, 20% are White/ Caucasian whereas 80% are Asian/Asian American.” In the Asian assistant condition, the racial composition was described as “Of the project assistants employed by Selcom, 20% are White/ Caucasian whereas 80% are Asian/Asian American.” We did this so that participants would have specific base-rate information about the organization position that they were evaluating as op- posed to more general information about the overall workforce. The participants answered the same question from Study 1: “What do you think is the race of the person interviewed?” Participants could select one of the following randomized options: Hispanic/ Latin American, Asian/Asian American/Pacific Islander, White/ Caucasian American, Black/African American, or Native Ameri- can/Alaskan Native. Results A total of 157 of the 167 participants (94%) correctly reported manipulation checks on interviewee role, industry type, and racial minority. We assessed manipulation checks for interviewee role and industry type before assessing the key dependent variable, whereas the manipulation check for the racial minority included in the base rate was assessed after the key dependent variable. This
  • 30. was done so as not to cue participants that the goal of the study may be race related. Analyses conducted with and without the 10 individuals who failed one or more manipulation checks revealed the same outcomes across samples. Thus, the analyses presented here are on the full sample. Just as in Study 1, responses to the interviewee race question were recoded as White (1) or non-White (0). Using standard procedures (Kleinbaum, 1994), we submitted this dichotomous variable to a binary hierarchical logistic regression analysis with interviewee role, industry type, and racial minority as between- participants factors (see the regression analysis in Table 2). Anal- ysis revealed a significant main effect on interviewee role (B � �0.65, SE � 0.34, p � .05, r � .15). Participants were more likely to believe that leaders (34 of 82 participants � 42%) rather than employees were White (23 of 85 participants � 28%). The anal- ysis yielded no other main effects or interactions ( ps � .14). Hence, leadership perceptions did not vary by the third factor, racial minority group in the base rate, confirming Hypothesis 3b. Similarly, leadership perceptions did not vary by the type of business industry, confirming Hypothesis 4b. In further support of our presumption that being White is a prototypical characteristic of leadership, participants in the leader conditions presumed that the leader was White significantly more often than the 20% base rate would have suggested (Z � 2.98, p � .003), but this was not the case when the interviewee was an
  • 31. employee (Z � 1.03, p � .28). Discussion Taken together, the results of Studies 1 and 2 support our first prediction that a characteristic of the business leadership prototype is being White. However, perhaps the effect could be due to the group prototype explanation (Hogg, 2001). If so, then the partic- ipant’s race would moderate the extent to which the leader would be perceived as White. That is, non-White observers would be less likely to perceive a leader prototype effect than White observers, and instead they would assume that leaders just as much as employees were White. To test this alternative, we conducted post hoc analysis with the participants from Studies 1 and 2. If the effects were due to a group prototype effect, then the interaction Table 2 Binary Hierarchical Logistic Regression for Perceptions of Leader Race Regressed on the Type of Racial Minority Included in the Base Rate, Interviewee Role, and Industry Type (Study 2) Variable Step 0 Step 1 Step 2 Step 3 B SE Wald B SE Wald B SE Wald B SE Wald Constant �0.66 0.16 16.23*** �0.05 0.37 0.02 �0.20 0.55 0.13 �0.56 0.63 0.80
  • 32. Racial minority 2.78 0.69 0.57 Interviewee role �0.65 0.34 3.64* �0.19 0.66 0.09 0.43 0.81 0.28 Industry �0.24 0.34 0.48 �0.20 0.64 0.10 0.36 0.77 0.22 Interviewee Role � Racial Minority 0.71 2.26 Industry � Racial Minority 0.22 0.45 Industry � Interviewee Role �0.34 0.68 0.25 �1.53 1.14 1.81 Industry � Interviewee Role � Racial Minority 1.84 Note. Interviewee role, racial minority, and industry were treated as categorical variables for the analysis. The leader role was used as the reference point for the interviewee role manipulation tests, social services industry was used as a reference point for the industry manipulation, and perceptions of leader race was coded dichotomously (1 � White, 0 � other races). Because the racial minority manipulation had three levels, its tests (either main effects tests or tests of interactions involving this variable) did not have a single condition that represented a reference point; rather, the table contains the overall test of this variable, the Wald statistic. The racial minority group factor includes Asians/Asian Americans, Hispanics/Latin Americans, and Blacks/African Americans. *p � .05. ***p � .001. 764 ROSETTE, LEONARDELLI, AND PHILLIPS between the participant’s race and interviewee role should be significant. That is, Whites should be more likely to perceive the
  • 33. leader as opposed to the employee to be White, whereas racial minorities would be equally likely to consider the leader and employee to be White. By contrast, our leader prototype prediction would argue that being White is an attribute of the U.S. business leader prototype, and such prototypes are evident regardless of the observer’s race. Hence, the interaction between participant’s race and interviewee role would not be significant. Participants’ assessments of interviewees’ race were submitted to a logistic regression analysis, with interviewee role and partic- ipant race (White, non-White) as predictors. Consistent with pre- dictions, the analysis revealed a main effect of interviewee role (B � �0.68, SE � 0.23, p � .004, r � .17), where leaders were perceived to be White (57%) more than nonleaders (41%). The analysis also revealed a main effect of participant race (B � 0.61, SE � 0.24, p � .01, r � .15). White participants were less likely to perceive that the interviewee (regardless of role) was White (81 of 186 participants � 43%) than were racial minorities (72 of 126 participants � 57%). However, the two-way interaction between interviewee role and participant’s race was not significant (B � �0.72, SE � 0.48, p � .12); White and non-White participants both perceived leaders more than nonleaders as White. We also conducted the logistic regression analysis with partic- ipant’s race as a five-level variable (White, Black, Hispanic, Asian, and other) and interviewee role as between-subjects factors.
  • 34. This analysis revealed no significant effects of participant’s race, either alone or in interaction with interviewee role ( ps � .05). Finally, we conducted a set of post hoc comparisons for each of the five participant race categories to determine whether any pairwise differences were revealed. Given that a five-level variable pro- duces 10 different pairwise comparisons, 10 significance tests were to be evaluated, which greatly increases the family-wise error rate. Thus, to reduce the risk of making a Type I error (i.e., rejecting the null hypothesis when it should not be rejected), we set Alpha using a Bonferroni correction (.05/10 � .005; Abdi, 2007). Thus, effects would be considered significant if the p values fell below .005. All tests involving pairwise comparisons of race and the interactions between pairwise race comparisons and inter- viewee role failed to reach this level of significance. In fact, all but one comparison ( p � .02) had significance levels greater than p � .05. This evidence is consistent with our prediction that the per- ception that leaders are White is a function of leader categorization processes rather than of a group prototype. In sum, the first two studies lend support to the prediction that being White is a characteristic of the leader prototype. The next two studies sought to test our second overarching prediction, to investigate the potential implications of leader race for leadership evaluations and to see whether a leader prototype explanation could account for these effects. Specifically, we evaluated
  • 35. whether leader categorization could best explain perceptions of leader effectiveness (Study 3) and leadership potential (Study 4). Study 3: Evaluations of White and Non-White Leaders Previous research has demonstrated that White managers are considered to have greater career advancement opportunities than African American managers (Greenhaus & Parasuraman, 1993; Maume, 1999). For example, in a comprehensive longitudinal study across an array of industries, Maume (1999) showed that when personal and job-related factors were controlled, White men were 52% more likely to be promoted in their careers than African American men. Maume described the advancement of White men as glass escalators and that of African American men as glass ceilings. We sought to investigate whether race differences be- tween Whites, African Americans, and other racial minorities in evaluations of leadership effectiveness could be explained by a White leader prototype. We predicted that observers, when evaluating profiles of leaders in organizations, would perceive White targets to be more effective leaders than racial minority targets and that this perception would be due to leader categorization. That is, the favorable evaluations of Whites would occur because being White is more consistent with other pertinent prototypical leadership characteristics than being a racial minority. This prediction is derived from the recognition-based processes described in leadership
  • 36. categorization theory (Lord & Maher, 1990, 1991), whereby leaders are evaluated more favorably when the leader is perceived to be compatible with prototypical rather than nonprototypical characteristics, a predic- tion that has received a good deal of empirical support (Foti et al., 1982; Foti & Lord, 1987; Lord et al., 1986; Phillips, 1984), especially when salient identity characteristics, such as gender, have been considered (Eagly & Karau, 2002; Heilman et al., 1989; Lyness & Heilman, 2006; Nye & Forsyth, 1991; Schein, 1973; Scott & Brown, 2006). However, prototypical characteristics may not influence observers’ perceptions if they are considered to be uninformative (Kunda & Spencer, 2003), such as when individu- ating information about specific events and circumstances are present (Leyens, Yzerbyt, & Schadron, 1992; Yzerbyt, Schadron, Leyens, & Rocher, 1994). That is, in addition to prototypical and nonprototypical characteristics, leader evaluations often entail in- dividualized analyses or summaries of the leader’s performance, and such specific information may increase or decrease the rele- vance of the prototype in leader evaluations. At first glance, it may be hard to believe that observers may rely on leader categorization processes at all when individualized in- formation about the leader’s performance record is available. However, existing theory and evidence suggests that the leader prototype may still affect observers’ impressions as long as it does
  • 37. not disrupt comprehension or, more specifically, conflict with other information they have (Kunda & Spencer, 2003; see also Kunda, Davies, Hoshino-Browne, & Jordan, 2003). That is, when a target’s categorization conflicts with individualized information that observers have about a target, observers will not use proto- types and instead will rely only on the available individualized information (Leyens et al., 1992; Yzerbyt et al., 1994). In contrast, prototypes are more likely to affect observers’ evaluations of the target when the prototype categorization is perceived to confirm the individualized information the observers have about the target person; thus, the prototype facilitates comprehension (Kunda & Spencer, 2003). As applied to our work, we predict that the leader prototype will lead to higher leader effectiveness ratings of White relative to non-White leaders, but only when the leader prototype confirms and reinforces individualized information about the leader’s per- formance record, namely, when the leader has led the organization to success. Some evidence supports the idea that leadership pro- totypes are compatible with successful team and organizational 765THE WHITE STANDARD performances, as leadership effectiveness ratings are the highest when groups and organizations have performed successfully (Meindl & Ehrlich, 1987; Nye, 2002; Rush, Phillips, & Lord, 1981; Weber, Camerer, Rottenstreich, & Knez, 2001), and it is
  • 38. easier to associate success with a prototypical leader than with a nonprototypical leader and to subsequently infer leadership effec- tiveness (Ensari & Murphy, 2003; Phillips & Lord, 1981, 1982). However, when successful outcomes are considered, perceived responsibility for the performance becomes an elementary part of the evaluative process (Meindl & Ehrlich, 1987; Meindl et al., 1985). When managers are viewed as responsible for successful performances, then the perception that they are typical leaders is enhanced; but, if they are perceived not to be responsible for successful performances or responsible for poor performances, leader perceptions are lowered (Lord & Maher, 1991). Therefore, a White leader who is responsible for the success of the group or organization should be evaluated favorably because all three fac- tors—race, organizational performance, and the appropriate attri- butions—are all well-matched leadership characteristics. Conversely, when the leader is not given credit for organiza- tional success (i.e., it is attributed to external causes) or the leader’s organization performs poorly, then the leader prototype is incompatible with the individualized information and it will not be used. Under such performance conditions, White and non-White leaders will be rated equivalently. Thus, consistent with leader categorization, we predict that there should not be differences in evaluations between White and non-White leaders except when successful performances are attributed to the leader.
  • 39. White leaders may be rated more favorably than non-White leaders for reasons other than leader categorization. One alterna- tive prediction that likely comes to mind stems from the negative stereotypes that are frequently associated with racial minority groups. For example, African Americans are often stereotyped to be less determined and less competent than Whites. It is possible that a White leader may be evaluated more positively than an African American leader because of these negative stereotypes. However, if the negative stereotype explanation is valid and given the existing research on comprehension and individuating infor- mation (Kunda & Spencer, 2003), we would expect the emphasis to be on the negative evaluation of non-White leaders (e.g., Afri- can, Hispanic, Asian American) as opposed to the positive evalu- ations of White leaders. Whereas the White prototype explanation would be more likely to occur under conditions of success, the negative stereotype explanation would be more likely to occur under conditions of failure. That is, non-White leaders would be evaluated less favorably than White leaders only when the nega- tive stereotype reinforced information about the leader’s perfor- mance record, specifically, that the non-White leader was respon- sible for organizational failure. Thus, on the basis of the negative stereotype explanation, we predict a three-way interaction between race, organizational performance, and performance attributions: Non-White leaders will be evaluated less favorably than White leaders, but only when they are blamed for unsuccessful organi-
  • 40. zational performance (Hypothesis 5a). However, on the basis of our proposed White business leader prototype, we predict a com- peting three-way interaction: White leaders will be evaluated more favorably than non-White leaders, but only when they are given credit for successful organizational performances (Hypothesis 5b). Method Participants A total of 479 undergraduates (270 women, 209 men) partici- pated in the study in exchange for course extra credit or $10. Of these participants, 131 were White, 75 were Black, 125 were Asian, 115 were Hispanic, and 33 classified their race as “other.” Study Design The study consisted of a 2 (organizational performance: failure, success) � 2 (performance attribution: internal, external) � 2 (leader race: African American, White) between-subjects factorial design. The decision to focus primarily on African Americans in this study as opposed to other racial minorities does not imply that one minority group is more important than another. It does, how- ever, reflect that in the context of racial bias, social science research contrasts African Americans—more so than any other racial minority in the United States—to Whites. Procedure
  • 41. Participants were told that they were to complete a task called “Reading between the Lines” and that the ostensible goal of the study was to examine how people make inferences about the newspaper articles they read. After reading the article, participants answered some questions about the article’s content. The article was supposedly about a company called Dosagen, its CEO, and the recent performance of the company. The article contained the experimental manipulations of organizational performance, perfor- mance attribution, and leader race. After reading one of the eight versions of the article, the participants completed the postexperi- mental questionnaire, were debriefed, and then were dismissed (see the manipulation script in Appendix C). Organizational performance. The corporation’s performance was manipulated as being either successful or unsuccessful. In addition, the company’s earnings were described as having in- creased (i.e., successful performance) or decreased (i.e., unsuc- cessful performance), and a graph noting a percentage change in earnings over the past 5 months was also included. For successful performance, the graph displayed a steady increase in company earnings over a 5-month period. For unsuccessful performance, the graph displayed a steady decline over a 5-month period. Attributions. Quotes provided by an industry analyst in the article manipulated attributions for organizational performance. Internal attributions were manipulated by placing the credit or the blame for the performance on the CEO. Accordingly, the impli- cation was that the CEO’s abilities, behaviors, and decisions
  • 42. accounted for the company’s performance. External attributions were manipulated by assigning credit or blame for the performance on the marketplace. Hence, the economic context of the industry accounted for the company’s performance and not the CEO. The primary sentence included in the text of the newspaper article that manipulated attributions read as follows: “The performance of the company should be attributed to the performance of the [CEO/ marketplace], not to the performance of the [marketplace/CEO].” Race of the CEO. The race of the CEO was manipulated by the name and a picture of the CEO. According to research conducted by Bertrand and Mullainathan (2004), Todd is a “White- sounding” 766 ROSETTE, LEONARDELLI, AND PHILLIPS name, whereas Tyrone is an “African American-sounding” name. To determine that Tyrone was principally used as an African American name and that Todd was principally used as a White name, Bertrand and Mullainathan used name-frequency data cal- culated from birth certificates. They then tabulated the names by race to determine which names were distinctly African American and which were distinctly White. These two names, Todd and Tyrone, had two of the highest frequencies for the names tested in their respective categories, White names and African American
  • 43. names. In addition, they conducted a survey in various public areas to assess the racial traits of the given names. The names led respondents to attribute Todd as White and Tyrone as African American. These two racially identifying names were paired with the neutral-sounding last name Smith. To make the race of the CEO more salient, a headshot of a CEO dressed in a suit was also provided. To ensure that the photographs of the African American and White CEOs differed in terms of race but were similar on other potentially critical dimensions that we thought could bias participants’ evaluations of the leaders, we conducted a pilot test. Thus, 25 participants from the same sample population as the participant pool evaluated 10 photographs of male faces (5 African American, 5 White) on race (to confirm differences in race), age (to ensure comparability), and physical attractiveness and emotional expression (to confirm that the se- lected photos would be equally attractive and exhibit similar emotional expressions). Of the 10 photographs, two were selected because they were clearly recognizable as African American and White, were considered similar in age, and were not different in ratings of physical attractiveness or emotional expression ( ps � .57). Leadership Effectiveness Measure Participants were asked to evaluate the CEO on intelligence, competence, confidence, and competitiveness (e.g., “I think the CEO is competent”). According to Kirkpatrick and Locke (1991) and Lord et al. (1984), these are characteristics that have been
  • 44. shown to represent effective leadership. These four items were measured on a 7-point Likert-type scale anchored by 1 (strongly disagree) and 7 (strongly agree). The four items shared a univar- iate factor structure, and interitem consistency was high (Cron- bach’s � � .88). Thus, item ratings were averaged together, creating a single composite leadership evaluation score, where higher scores indicated more effective leadership. Scores ranged from 1 to 7 (M � 4.72, SD � 1.13). Results Manipulation Checks Prior to assessing the primary dependent variable, leadership effectiveness, participants responded to two manipulation checks to confirm their awareness of the organizational performance and performance attribution manipulations. Responses confirmed that 99% and 97% of the sample correctly reported the organization’s performance and the performance attribution made by the industry analyst, respectively, as reported in the news article. After partic- ipants answered the leadership effectiveness questions, a final manipulation check evaluated participants’ awareness of the CEO’s race with the question “What is the race of Mr. Smith, the CEO?” The participants were given six choices: (a) Black/African American, (b) Hispanic/Latin American, (c) Asian/Asian Ameri- can/Pacific Islander, (d) Native American/Alaskan Native, (e)
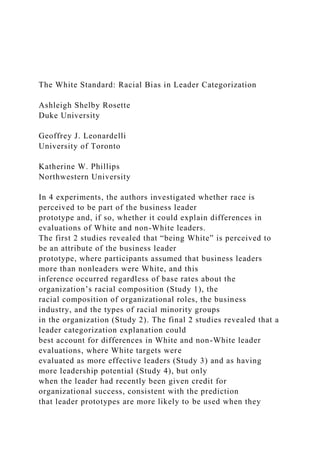
  • 45. White/Caucasian American, or (f) Other. This question was placed near the end of the postexperimental questionnaire so as not to bias the measures of interest. Of the 479 students who participated in the study, 94% correctly identified the leader’s race. Given the high reliability on the manipulation checks, we included all re- spondents in our final analysis. In addition, analyses removing manipulation check failures revealed the same outcomes. Leadership Effectiveness Scores were submitted to a three-way analysis of variance (ANOVA) with organizational performance, attribution, and leader race as between-participants factors. Analysis revealed a main effect for organizational performance, F(1, 471) � 270.86, p � .001, r � .60, whereby leaders were considered more effective after an organization’s success (M � 5.40, SD � 0.96) than failure (M � 4.09, SD � 0.89). Analysis also revealed a main effect of race, F(1, 471) � 3.92, p � .05, r � .09, where White leaders were considered more effective (M � 4.78, SD � 1.13) than African American leaders (M � 4.67, SD � 1.13). These main effects were qualified by two-way interactions between performance and attri- bution, F(1, 471) � 39.92, p � .001, r � .28, and another between leader race and attribution, F(1, 471) � 3.95, p � .05, r � .09. These in turn were qualified by a significant three-way interaction, F(1, 471) � 6.68, p � .01, r � .12. See the ANOVA results in Table 3.
  • 46. The three-way interaction is presented in Figure 1. The top panel contains mean leader effectiveness ratings following organiza- tional success, and the bottom panel contains ratings after organi- zational failure. To localize the effects of this three-way interac- tion, we conducted two-way interaction contrasts (Keppel, 1991) to determine whether interactions between leader race and attribu- tion occurred within the failure condition, as predicted by Hypoth- esis 5a, or within the success condition, as predicted by Hypothesis 5b. Within the success condition, analysis revealed a significant interaction between attribution and leader race, F(1, 471) � 10.09, p � .01. Whereas African American (M � 5.19, SD � 0.94) and Table 3 Analysis of Variance With Leadership Effectiveness on Organizational Performance, Attributions, and CEO’s Race as Between-Subjects Factors (Study 3) Variable F(1, 471) r Intercept 13,757*** .98 Performance 270.86*** .60 Attribution 2.94 .08 Leader’s race 3.92* .09 Performance � Attribution 39.92*** .28 Performance � Leader’s Race 0.16 .00 Attribution � Leader’s Race 3.95* .09 Performance � Attribution � Leader’s Race 6.68** .12
  • 47. Note. The racial minority in this study was African Americans. CEO � chief executive officer. *p � .05. **p � .01. ***p � .001. 767THE WHITE STANDARD After Organizational Success 5.01 (0.98) 5.19 (0.94) 6.04 (0.62) 5.47 (0.95) 3 3.5 4 4.5 5 5.5 6
  • 48. 6.5 Racial minority White Leader Race L e a d e r E ff e c ti v e n e s s External Internal After Organizational Failure 4.37 (0.79)
  • 50. E ff e c ti v e n e s s External Internal Figure 1. Mean ratings (and standard deviations) of leader effectiveness by organizational performance, performance attribution, and leader race (Study 3). The racial minority in this study was African Americans. 768 ROSETTE, LEONARDELLI, AND PHILLIPS White leaders (M � 5.01, SD � 0.98) were perceived to be equally effective when an external attribution was given for the organiza- tion’s success, F(1, 471) � 1.24, ns, White leaders (M � 6.04, SD � 0.62) were considered more effective than African American leaders (M � 5.47, SD � 0.95) when leaders were credited with the organization’s success, F(1, 471) � 10.85, p � .001. Thus, Hypothesis 5b was supported. By contrast, within the failure
  • 51. condition, analysis here yielded no Leader Race � Attribution interaction (F � 1). Rather, analysis yielded only an attribution simple effect, F(1, 471) � 10.99, p � .001, where a leader’s ratings were higher when organizational failure was blamed on the marketplace rather than on him. Thus, Hypothesis 5a was not supported. White leaders were evaluated more favorably than non-White leaders, but only when successful organizational per- formance was attributed to the leader. Participant’s Race as a Moderator? According to a group prototype model of leader effectiveness (Hogg, 2001) or more generally, a social identification explanation (Tajfel & Turner, 1986), it is possible that individuals would be more likely to favor leaders from their own race over those from other races. If so, then White observers would replicate existing effects reported in the top panel of Figure 1, whereas African American participants would be more likely to rate African Amer- ican leaders more favorably than White leaders. Thus, leadership effectiveness was resubmitted to the same ANOVA, but with participants’ race as a fourth between-participants factor. Analysis revealed that none of the effects involving participants’ race was significant on leadership effectiveness (Fs � 1.49, ps � .20). The means reported in Figure 1 were consistent across participant race. Discussion Overall, the evidence in Study 3 is consistent with predictions
  • 52. derived from the leader categorization literature that have shown that prototypical leaders are evaluated more favorably than non- prototypical leaders after a clearly successful performance (Ensari & Murphy, 2003). We found that White leaders were evaluated more favorably than African American leaders, but only when they were viewed as responsible for their organization’s successful performance, not when success was attributed to external expla- nations (such as the marketplace) or when the leader’s organiza- tion had failed. These findings suggest that the difference in evaluations between White and non-White leaders came about because of a White leader prototype as opposed to negative ste- reotypes toward African Americans. It also suggests that leader race will affect observers’ evaluations when these evaluations could matter most to the leader’s career advancement, specifically when the leader has accumulated a record of success. In addition, in further support that being White is an attribute of the leader prototype, we demonstrated that racial bias was not merely limited to a group-derived prototype on the part of White observers. Rather, observers were more likely to evaluate success- ful White leaders more favorably than successful African Ameri- can leaders regardless of the observers’ race. The findings pre- sented here provide support that Whites more than non-Whites are viewed as prototypical leaders and that these perceptions affected leadership evaluations. However, we conducted a fourth study to
  • 53. determine whether our findings were more generalizable and to specifically assess evaluator’s perceptions of leadership potential, not merely leadership effectiveness. Study 4: Leadership Potential of White and Non-White Leaders The question posed in the first paragraph of the introduction asks “What is preventing well-trained racial minorities from ad- vancing within the organizational hierarchy to become leaders in U.S. companies?” To explicitly answer this question, we sought to demonstrate that racial bias due to leader categorization does not occur only once Whites and racial minorities are in leadership positions, as demonstrated in Study 3, but also when they are being considered for career advancement opportunities. Thus, the central purpose of Study 4 was to test Hypothesis 5b, with leadership potential as the variable of interest. That is, we sought to replicate Study 3’s findings and to examine evaluations of midlevel leaders who are considered for top leadership positions. Also, we set out to accomplish three additional goals. First, we sought to rule out the possibility that participants in Study 3 were making their evaluations on the basis of characteristics attributed to names. Consistent with the research of Bertrand and Mullain- athan (2004), we chose to use names that are typically associated
  • 54. with racial minorities and Whites to manipulate race. However, according to Kasof (1993), names that are based on demographics can form impressions and communicate information such as at- tractiveness, age, and even intellect. Accordingly, the names used to manipulate race may have communicated attributes other than race. Second, Study 3 focused on only one racial minority group, African Americans. Although much of the research that examines racial bias contrasts Whites with African Americans, to demon- strate that a White prototype of leadership persists in U.S. business settings, it would be useful to consider evaluations of White leaders relative to leaders who belong to alternative racial groups, such as Asian and Hispanic Americans. Third, to increase the generalizability of our findings, we recruited a more experienced sample for participation in this study. Method Participants and Study Design A total of 151 graduate students (106 Whites, 19 Hispanics, 14 Blacks, and 12 Asians and others) completed the study as a course requirement in a business management course or in exchange for snacks and a break from the Basketball Ticket Campout. Campout is a weekend-long event where students “camp out” so that they may be included in a lottery system for basketball tickets. There were no differences in the analysis between the data collected in
  • 55. conjunction with the management course and the data collected at the campout. Thus, the two sites are not discussed further. The participants (90 men, 61 women) had an average age of 27.33 years (SD � 2.78) and 4.53 years of work experience (SD � 2.81). Similar to Study 3, the study consisted of an Organizational Performance (failure, success) � Performance Attribution (inter- nal, external) � Leader Race (White, Hispanic, Asian) between- participants design. 769THE WHITE STANDARD Procedure Participants were told that they were participating in a study called “Performance Evaluations” and that the goal of the study was to evaluate personnel who were candidates for top positions within an organization. Participants were instructed to read a personnel summary that included a brief profile and performance summary of a consulting services team leader employed in a fictitious company, Buygen, Inc. (see the manipulation script in Appendix D). Next, they were instructed to evaluate whether the team leader described in the profile had the potential to succeed if promoted to a more senior management position, specifically, a division leader within the organization. After reading the profile and performance summary, participants completed an evaluation of the target person described in the personnel summary that included manipulation checks and a measure of leadership poten- tial.
  • 56. Manipulations. The manipulations for organizational perfor- mance and attributions were similar to the manipulations in Study 3. First, the consulting team’s performance was manipulated as either successful or unsuccessful. The team’s performance was described as having increased or decreased. Second, comments in the performance appraisal were used to manipulate attributions to the team’s performance. The primary sentence in the performance appraisal that manipulated internal and external attributions read as follows: “Last year’s appraisal noted that the team’s performance was due to the performance of the [marketplace/ team leader], not to the [team leader/marketplace], and stated that ‘it is the [availability of high profile clients in the market- place/team leader’s management skills] that explains the team’s performance record.’” Unlike in Study 3, where we used a picture and a name to manipulate the race of the leader, in Study 4 we manipulated the race of the team leader by a line-item description in the personnel file. Under the label race, the target was described as White/ European American/Caucasian, Asian/Asian American, or Hispan- ic/Latin American. A pilot test revealed that when only this race label was used to manipulate race (e.g., no picture or name as in Study 3) and when the manipulation check for leader race was assessed after the dependent variable of interest, a significant number of participants (approximately 20%; 16 out of 84 pilot test participants) failed the leader race manipulation check. Thus, to make the leader race salient, the leader race manipulation check (as
  • 57. well as the organizational performance and attribution manipula- tion checks) were assessed prior to measuring leadership potential. Leadership potential. We designed the leadership potential measure to evaluate participants’ evaluations of the team leader’s career expectations in the role of the division leader and used the following three items: “He has the competence to perform effec- tively in the division leader role,” “He has what it takes to lead others in a division successfully,” and “He will be an effective division leader.” Participants rated their level of agreement using a 7-point response scale (1 � strongly disagree, 7 � strongly agree). The items shared a univariate factor structure, and inter- item consistency was high (Cronbach’s � � .89). Responses were thus averaged together and ranged from 1 to 7 (M � 4.17, SD � 1.06). Results Participants responded to three manipulation checks to confirm the team’s performance, attributions made to the team leader, and the leader’s race. A total of 97% of the participants correctly reported the team’s performance, 99% correctly reported the attri- butions made to the leader, and 95% correctly reported the leader’s race in the manipulation check. Given the robustness of the ma- nipulations, the total sample was included in the analysis. Further, the results were the same when the manipulation failures were
  • 58. not included. Participant’s race did not significantly influence the findings when included as a covariate or as a fourth factor; hence, it will not be discussed further. In addition, planned comparison tests in which we used the entire sample that contrasted target Hispanic leaders with target Asian leaders in each of the performance and attribution conditions (i.e., internal/success, external/success, in- ternal/failure, external/failure) yielded no significant differences. Thus, the Hispanic and Asian conditions were collapsed into one racial minority condition. The leadership potential scores were submitted to an ANOVA with organizational performance, performance attributions, and leader race as between-participants factors (see ANOVA results in Table 4). Analysis revealed a significant main effect of organiza- tional performance, F(1, 142) � 66.86, p � .001, r � .57; a significant two-way interaction between organizational perfor- mance and attributions, F(1, 142) � 38.23, p � .001, r � .46; and a significant interaction between attribution and leader’s race, F(1, 142) � 2.08, p � .05, r � .12. These effects were qualified by a three-way interaction, F(1, 142) � 4.50, p � .04, r � .18. Means and standard deviations are presented in Figure 2. Consistent with Study 3, within the success conditions, the interaction contrast was
  • 59. significant, F(1, 142) � 6.26, p � .01, r � .32, whereas the interaction contrast for failure was not significant, F(1, 142) � 1.18, ns, r � .05. Moreover, simple effect comparisons revealed that White leaders (M � 5.15, SD � 0.99) received more favorable evaluations than did racial minority leaders (M � 4.45, SD � 0.65), a significant difference, F(1, 142) � 6.53, p � .01, r � .21, when success was internally attributed. However, White leaders (M � 4.00, SD � 0.79) were not evaluated more favorably than Table 4 Analysis of Variance With Leadership Potential on Organizational Performance, Attributions, and CEO’s Race as Between-Subjects Factors (Study 4) Variable F(1, 142) r Intercept 370.57*** .85 Participant’s race 0.90 .08 Performance 66.86*** .57 Attribution 1.61 .10 Leader’s race 0.08 .03 Performance � Attribution 38.23*** .46 Performance � Leader’s Race 1.98 .12 Attribution � Leader’s Race 2.08* .12 Performance � Attribution � Leader’s Race 4.50* .18 Note. The racial minorities in this study were Hispanic Americans and Asian Americans. CEO � chief executive officer. *p � .05. ***p � .001. 770 ROSETTE, LEONARDELLI, AND PHILLIPS
  • 61. L e a d e r P o te n ti a l External Internal After Organizational Failure 3.81 (0.57) 3.90 (0.88) 2.75 (1.15) 3.01 (0.86) 2
  • 63. a l External Internal Figure 2. Mean ratings (and standard deviations) of leader potential by organizational performance, perfor- mance attribution, and leader race (Study 4). The racial minorities in this study were Hispanic Americans and Asian Americans. 771THE WHITE STANDARD racial minorities (M � 4.25, SD � 0.46), F(1, 142) � 0.89, ns, when success was externally attributed. Hypothesis 5b was thus supported: White leaders were rated more favorably than non- White leaders only when the team was successful and the leader deemed responsible for the success. Discussion These findings support the idea that racial bias in the leader prototype can influence evaluations of leaders and their likelihood of career advancement. Taken together with Study 3 findings, these findings demonstrate that the career prospects of White targets were evaluated as higher than the prospects for African American, Hispanic American, and Asian American targets. Race differences occurred only when the leader was given credit for organizational success, evidence that is consistent with the lead- ership prototype prediction. It is precisely under these conditions, when leaders are held responsible for their organization’s
  • 64. success- ful performance, that leaders should be able to capitalize on their accomplishments and use their excellent achievements as stepping stones to advance their career and as evidence of their ability to handle additional responsibilities. However, it appears that White leaders may be advantaged when such career advancement oppor- tunities are considered. General Discussion On the basis of leadership categorization theory, we predicted that Whites would be viewed as more prototypical leaders than racial minorities in U.S. business settings because the leadership prototype included the presumption that prototypical leaders were White. Across four studies, the evidence supported this overarch- ing prediction. First, being White met the two structural principles of prototype development as prescribed by traditional categoriza- tion theory (Rosch, 1978) and leadership categorization theory (Lord & Maher, 1991). Being White was found to be more central to the business leader category and less central to the nonbusiness leader category (employees). This finding persisted regardless of the base rate of the work force, of the base rate of the racial minority that comprised the majority of the organization’s posi- tions, and of when the organization was situated in a financial
  • 65. services industry and a social services industry. Second, our find- ings revealed White individuals were perceived as more effective leaders and more likely to succeed than non-Whites but that these differences occurred only when these leaders were viewed as responsible for an organization’s success. These findings persisted regardless of whether the comparison leader race was African, Hispanic, or Asian American, regardless of the participants’ race and across participants with both high and low levels of work experience. We interpret these noted differences to be consistent with a leadership prototype explanation of race differences. These findings advance organizational research in two impor- tant ways. First, not only do these studies corroborate existing categorization processes of leadership and inferential views of leadership effectiveness, but they introduce the idea that a leader’s race, and not merely the stereotypical traits associated with race, could influence the evaluative process. Previous research has shown that leadership categorization and inferential processes of leadership provide efficient heuristics for appraising leaders be- cause evaluators only have to compare a target leader with an existing knowledge base that includes prototypical traits and con- siders salient performance outcomes (Lord & Maher, 1991). Our findings suggest that the cognitive economy afforded by this simplistic evaluative process provides a way to efficiently and perhaps unintentionally evaluate White leaders as more likely to
  • 66. succeed and as more effective than racial minority leaders. Thus, we provide evidence that indeed there may be a White standard to which members of racial minorities are compared when leadership perceptions and leadership evaluations are considered. Second, our findings offer a more in-depth understanding of racial bias in leadership evaluations than what may be presumed by alternative perspectives, such as negative racial minority ste- reotype or group prototype explanations. Our findings are consis- tent with the overarching tenets of a negative stereotype explana- tion because White leaders were evaluated more favorably than racial minority leaders. However, the results of Studies 3 and 4 suggest that the racial bias occurred because of a favorable leader prototype as opposed to a negative racial stereotype. It may be that negative racial stereotypes are less relevant in business contexts. For example, some research finds that under certain conditions, African American businessmen are considered to be a positive subtype of a broader, global African American racial stereotype (Devine & Baker, 1991). Further, empirical evidence based on current stereotype-based theories of subtle bias, such as aversive racism, suggest that negative bias against racial minority groups, such as African Americans, is more likely to occur when it is not clear what sort of evaluation is normative and when evaluations that stem from negative stereotypes can be justified or rationalized
  • 67. (Aberson & Ettlin, 2004; Dovidio & Gaertner, 2000; Frey & Gaertner, 1986; Murphy-Berman, Berman, & Campbell, 1998). These vague conditions are less likely to be present when leaders are evaluated because the situational norms for performance ap- praisals and evaluations are more apt to be obvious and salient. We showed that it is when these norms are strong and evident that a White leader prototype will influence leadership ratings, such as when successful performance outcomes occur and attributions for performance are clear. In addition, our findings offer a more extensive explanation of racial bias than would likely be proposed by a group prototype explanation (Hogg, 2001). Contrary to group prototype studies, in our study the bias in favor of White leaders was evident in observers who belonged to other racial groups, including Asian, Hispanic, and African Americans. Accordingly, African Ameri- cans and Hispanic Americans were just as likely as Whites and Asian Americans to evaluate White leaders as more effective and as more likely to have favorable career opportunities. We must, however, note study limitations that could potentially hinder the generalizability of our findings. First, in Studies 3 and 4, we focused only on male leaders and did not include an evaluation of White female leaders or racial minority female leaders. Considerable research has examined how gender differ- ences contribute to a male prototype of leadership (Brenner et al., 1989; Eagly & Karau, 2002; Heilman et al., 1989; Nye & Forsyth, 1991; Schein, 1973; Scott & Brown, 2006); thus, future research
  • 68. should consider how gender differences and racial differences intersect to possibly form a specific White male prototype of leadership. Second, our research was limited to the evaluation of fictitious leaders. Evaluations of actual leaders in top management 772 ROSETTE, LEONARDELLI, AND PHILLIPS positions in organizations could differ, as leaders in organizational settings have reputations and social relationships that may affect how they are perceived by observers. Third, the participants in our studies were students. The use of student participants may limit the generalizability of our findings. Our findings were consistent across student samples with little work experience and graduate student samples with a moderate amount of work experience (i.e., an average of 4 to 6 years) who presumably would have been exposed to actual leaders in their occupations prior to attending graduate school. However, the findings may differ for sample populations in which the evaluators have a substantial amount of work experience. Managerial Implications In addition to contributing to organizational research, our find- ings may have managerial implications as well. Because organi- zational rewards and promotion to leadership roles are awarded on
  • 69. the basis of leadership evaluations and because our findings sug- gest that leadership evaluations are more likely to favor Whites than racial minorities, it follows that Whites may be more likely to be promoted to leadership positions more frequently than racial minorities. Accordingly, a multiplier effect may persist such that positive evaluations are given to White leaders, White leaders continue to be the prototype for effective leadership, and corre- spondingly, racial minority leaders are continually disadvantaged. In order to disrupt this perpetual cycle, managers and organiza- tional members have to be made aware of the cognitive biases that persist in leadership evaluations that may favor Whites and hinder racial minorities. Awareness alone may not “correct” the bias against racial minority leaders and in favor of White leaders, but it may lead to a better understanding of the perceived differences. Without a thorough understanding of the skewed view of effective leadership, racial minorities will continue to be underrepresented in top leadership positions. What should managers do when administering leadership eval- uations? When continued racial disparity in positions of leadership persists in their organizations, managers should take a proactive stance, gauge the evaluative process, and ask the difficult ques- tions, such as why are Whites congregated in leadership positions and minorities are not? Do racial minorities in lower organiza- tional positions have similar qualifications as do Whites who
  • 70. were promoted to top management? Is it possible to institute a blind review process that omits or substantially reduces racial consider- ations? If racial minorities consistently attain objective achieve- ments, but those accomplishments are not reflected by good lead- ership ratings or positive leadership perceptions, managers should attempt to rectify this disconnect and consider the presence of cognitive biases that may favor Whites over racial minorities. Conclusion This study makes clear that the attitudes toward racial minority leaders and White leaders are complex and merit further investi- gation. Our results challenge the assumption that racial differences are no longer a critical issue in today’s organizations (Hurley, Fagenson-Eland, & Sonnenfeld, 1997). Although opaque racial barriers may no longer exist in U.S. organizations, transparent barriers likely persist that prevent racial minorities from rising to the most esteemed positions of leadership in corporate environ- ments. References Abdi, H. (2007). Bonferroni and Sidak corrections for multiple compari- sons. In N. J. Salkind (Ed.), Encyclopedia of measurement and statistics (pp. 103–107). Thousand Oaks, CA: Sage. Aberson, C. L., & Ettlin, T. E. (2004). The aversive racism
  • 71. paradigm and responses favoring African-Americans: Meta-analytic evidence of two types of favoritism. Social Justice Research, 17(1), 25– 46. The Alliance for Board Diversity. (2005). Women and minorities on Fortune 100 boards. Retrieved March 1, 2007, from http://www. catalystwomen.org/files/full/ABD%20report.pdf Bass, B. M. (1985). Leadership and performance beyond expectations. New York: Free Press. Beach, L. R. (1964). Cue probabilism and inference behavior. Psycholog- ical Monographs: General and Applied, 78(5), 1–20. Bennis, W., & Nanus, B. (1985). Leaders: The strategies for taking charge. New York: Harper & Row. Bertrand, M., & Mullainathan, S. (2004). Are Emily and Greg more employable than Lakisha and Jamal? A field experiment on labor market discrimination. The American Economic Review, 94(4), 991– 1013. Brenner, O. C., Tomkiewicz, J., & Schein, V. E. (1989). The relationship between sex role stereotypes and requisite management characteristics revisited. Academy of Management Journal, 32, 662– 669. Bruner, J. S. (1957). Going beyond the information given. In J.
  • 72. S. Bruner, L. Festinger, F. Heider, K. F. Muenzinger, C. E. Osgood, & D. Rapaport (Eds.), Contemporary approaches to cognition (pp. 41– 69). Cambridge, MA: Harvard University Press. Burns, J. M. (1978). Leadership. New York: Harper & Row. Burns, P., & Gimpel, J. (2000). Economic insecurity, prejudicial stereo- types, and public opinion on immigration policy. Political Science Quarterly, 115(2), 201–225. Calder, B. J. (1977). An attribution theory of leadership. In B. Staw & G. Salancik (Eds.), New directions in organizational behavior (pp. 179 – 204). Chicago: St. Clair Press. Cantor, N., & Mischel, W. (1979). Prototypes in person perception. In L. Berkowitz (Ed.), Advances in experimental social psychology (Vol. 12, pp. 3–52). New York: Academic Press. Castilla, E. (in press). Gender, race, and meritocracy in organizational careers. American Journal of Sociology. Chung-Herrera, B., & Lankau, M. (2005). Are we there yet? An assessment of fit between stereotypes of minority managers and the successful- manager prototype. Journal of Applied Social Psychology,
  • 73. 35(10), 2029 –2056. Connelly, M., Gilbert, J., Zaccaro, S., Threlfall, K., Marks, M., & Mum- ford, M. (2000). Exploring the relationship of leadership skills and knowledge to leader performance. Leadership Quarterly, 11(1), 65– 86. Corporate Board Initiative. (2006). 2005 update on the Committee of 100’s Asian & Asian Pacific American (APA) corporate board report card. Retrieved March 2, 2007, from http://www.committee100.org/ initiatives/corporate_board/C-100_Corporate_Board_Update.pdf Cox, T., & Nkomo, S. (1986). Differential performance appraisal criteria: A field study of Black and White managers. Group & Organization Studies, 11(1–2), 101–120. Crocker, J., Fiske, S. T., & Taylor, S. (1984). Schematic bases of belief change. In R. Eiser (Ed.), Attitudinal judgment (pp. 197–226). New York: Springer. Devine, P. G., & Baker, S. M. (1991). Measurement of racial stereotype subtyping. Personality and Social Psychology Bulletin, 17, 44 – 50. Devine, P. G., & Elliot, A. J. (1995). Are racial stereotypes really fading?
  • 74. The Princeton trilogy revisited. Personality and Social Psychology Bul- letin, 21, 1139 –1150. 773THE WHITE STANDARD DeVries, R. (2000). When leaders have character: Need for leadership, performance, and the attribution of leadership. Journal of Social Behav- ior and Personality, 15(3), 413– 430. Dixon, J., & Rosenbaum, M. (2004). Nice to know you? Testing contact, cultural, and group threat theories of anti-Black and anti- Hispanic ste- reotypes. Social Science Quarterly, 85(2), 2004. Dorsey, N. (2005). The art of inclusion: Success stories of African Amer- icans in the nonprofit sector. Retrieved from Dissertation.com. Dovidio, J., & Gaertner, S. (2000). Aversive racism in selection decisions: 1989 and 1999. Psychological Science, 11(4), 315–319. Eagly, A., & Karau, S. (2002). Role congruity theory of prejudice toward female leaders. Psychological Review, 109(3), 573–598. Ensari, N., & Murphy, S. E. (2003). Cross-cultural variations in leadership perceptions and attribution of charisma to the leader. Organizational
  • 75. Behavior and Human Decision Processes, 92, 52– 66. Ford, J., Kraiger, K., & Schechtman, S. (1986). Study of race effects in objective indices and subjective evaluations of performance: A meta- analysis of performance criteria. Psychological Bulletin, 99, 330 –337. Fortune. (2006). Key Fortune 500 findings. Retrieved March 1, 2007, from http://www.timeinc.net/fortune/information/presscenter/fortune/ press_releases/20060403_fortune500.html Foti, R., Fraser, S., & Lord, R. (1982). Effects of leadership labels and prototypes on perception of political leaders. Journal of Applied Psy- chology, 67(3), 326 –333. Foti, R., & Lord, R. (1987). Prototypes and scripts: The effects of alter- native methods of processing information on rating accuracy. Organi- zational Behavior and Human Decision Making Processes, 39, 318 – 340. Frey, D., & Gaertner, S. L. (1986). Helping and the avoidance of inappro- priate interracial behavior: A strategy which perpetuates a nonprejudiced self-image. Journal of Personality and Social Psychology, 50, 1083– 1090.
  • 76. GAO Report. (2006). Financial services industry: Overall trends in management-level diversity initiatives, 1993–2004. (GAO Report No. 06 – 843T). Washington, DC: U.S. Government Accountability Office. Greenhaus, J., & Parasuraman, S. (1993). Job performance attributions and career advancement prospects: An examination of gender and race effects. Organizational Behavior and Human Decision Processes, 55(2), 273–297. Greenhaus, J., Parasuraman, S., & Wormley, W. (1990). Effects of race on organizational experiences, job performance evaluations, and career outcomes. Academy of Management Journal, 33(1), 64 – 87. Hains, S. C., Hogg, M. A., & Duck, J. M. (1997). Self- categorization and leadership: Effects of group prototypicality and leader stereotypicality. Personality and Social Psychology Bulletin, 23(10), 1087–1099. Heilman, M., Block, C., Martell, R., & Simon, M. (1989). Has anything changed? Current characterizations of men, women, and managers. Journal of Applied Psychology, 74(6), 935–942. Hogg, M. (2001). A social identity theory of leadership. Personality and Social Psychology Review, 5(3), 184 –200.
  • 77. Hogg, M., Fielding, K., Johnson, D., Masser, B., Russell, E., & Svensson, A. (2006). Demographic category membership and leadership in small groups: A social identity analysis. Leadership Quarterly, 17(4), 335– 350. Hollander, E. P. (1960). Competence and conformity in the acceptance of influence. Journal of Abnormal and Social Psychology, 61, 365– 369. House, R. J. (1977). A 1976 theory of charismatic leadership. In J. G. Hunt & L. L. Larson (Eds.), Leadership: The cutting edge (pp. 189 – 207). Carbondale, IL: Southern Illinois University Press. Hurh, W. M., & Kim, K. C. (1989). The “success” image of Asian Americans: Its validity, and its practical and theoretical implications. Ethnic and Racial Studies, 12, 512–538. Hurley, A. E., Fagenson-Eland, E. A., & Sonnenfeld, J. A. (1997). Does cream always rise to the top? An investigation of career attainment determinants. Organizational Dynamics, 26(2), 65–71. Jones, E. W. (1986). Black managers: The dream deferred. Harvard Business Review, 64, 84 –93.