
Recommended
Recommended
More Related Content
Similar to check figures Managerial accounting aiou mba mcom 8508
Similar to check figures Managerial accounting aiou mba mcom 8508 (20)
More from Ali Imran Awan MBA (IT)
More from Ali Imran Awan MBA (IT) (13)
Recently uploaded
Recently uploaded (20)
check figures Managerial accounting aiou mba mcom 8508
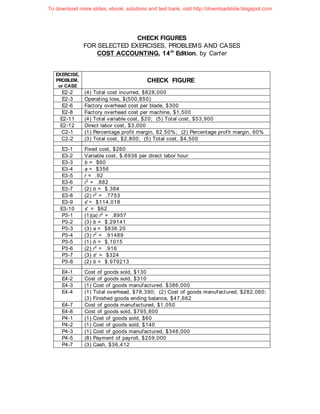
- 1. CHECK FIGURES FOR SELECTED EXERCISES, PROBLEMS AND CASES COST ACCOUNTING, 14th Edition, by Carter EXERCISE, PROBLEM, or CASE CHECK FIGURE E2-2 (4) Total cost incurred, $828,000 E2-3 Operating loss, $(500,850) E2-6 Factory overhead cost per blade, $300 E2-8 Factory overhead cost per machine, $1,500 E2-11 (4) Total variable cost, $20; (5) Total cost, $53,900 E2-12 Direct labor cost, $3,000 C2-1 (1) Percentage profit margin, 82.50%; (2) Percentage profit margin, 60% C2-2 (3) Total cost, $2,800; (5) Total cost, $4,500 E3-1 Fixed cost, $260 E3-2 Variable cost, $.6936 per direct labor hour E3-3 b = $60 E3-4 a = $356 E3-5 r = .92 E3-6 r2 = .882 E3-7 (2) b = $.384 E3-8 (2) r2 = .7753 E3-9 s'= $114.018 E3-10 s' = $62 P3-1 (1)(a) r2 = .8957 P3-2 (3) b = $.29141 P3-3 (3) a = $836.20 P3-4 (3) r2 = .91489 P3-5 (1) b = $.1015 P3-6 (2) r2 = .916 P3-7 (3) s' = $324 P3-8 (2) b = $.979213 E4-1 Cost of goods sold, $130 E4-2 Cost of goods sold, $310 E4-3 (1) Cost of goods manufactured. $386,000 E4-4 (1) Total overhead, $78,390; (2) Cost of goods manufactured, $282,060; (3) Finished goods ending balance, $47,662 E4-7 Cost of goods manufactured, $1,050 E4-8 Cost of goods sold, $795,800 P4-1 (1) Cost of goods sold, $60 P4-2 (1) Cost of goods sold, $140 P4-3 (1) Cost of goods manufactured, $348,000 P4-5 (8) Payment of payroll, $259,000 P4-7 (3) Cash, $36,412 To download more slides, ebook, solutions and test bank, visit http://downloadslide.blogspot.com
- 2. CHECK FIGURES, COST ACCOUNTING, 14th Ed., by Carter E5-3 (1) Direct labor in finished goods, $14,000 E5-4 (3) Cost of goods manufactured, $184,800 P5-1 (1) Total cost put into process, $217,200; (3) Cost of goods sold, $219,600 P5-2 (3) Cost of goods manufactured, $28,630; (5) April gross profit, $10,375 P5-3 (7) Overapplied factory overhead, $(3,000) P5-4 (1) Cost of goods sold, $76,030; (2) Income before income tax, $22,730 P5-5 (2) Cost of goods sold—adjusted, $40,000 P5-6 (3) Total, $51,306 P5-8 (4) Cash, $171,320; Work in Process, $46,075 E6-1 (1) Equivalent units for overhead, 23,000 E6-2 Cost transferred from Dept. X to Dept. Y, $300,000 E6-3 Work in process, ending inventory, $12,672 E6-4 Total average cost per equivalent unit, $8.00 E6-5 Cost transferred to Painting Dept., $155,000 E6-6 Equivalent units for labor and overhead, 2,300 E6-7 Work in process, ending inventory, $6,200 E6-8 Cost transferred to Bottling Dept., $15,600 E6-9 Equivalent units for overhead, 29,600 E6-10 Cost transferred to Assembly Dept., $84,935 E6-11 Work in process, ending inventory, $32,800 E6-12 Cost transferred to Finished Goods, $26,280 P6-1 Cost transferred from Cutting Dept. to Assembly Dept., $45,500 P6-2 Total average cost per equivalent unit, $4.10 P6-3 Assembly Dept. work in process, ending inventory, $85,656 P6-4 Equivalent units for overhead in the Blending Dept., 6,550 P6-5 Cost transferred from Blending Dept. to Finished Goods, $24,840 P6-6 Cost transferred from Cutting Dept to Assembly Dept., $128,350 P6-7 Fabrication Dept. work in process, ending inventory, $59,400 P6-8 Equivalent units for labor in the Mashing Dept., 2,940 E7-1 (1) Credit to scrap sales, $1,650 E7-2 Debit to Factory Overhead Control, $112 E7-3 Debit to Factory Overhead Control, $1,700 E7-4 Debit to Spoiled Goods Inventory, $10,000 E7-5 Debit to Factory Overhead Control, $700 E7-6 Cost of Goods Sold, $73,500 E7-7 Charge to Factory Overhead Control for spoilage, $3,725 E7-8 Cost transferred to Finished Goods, $102,600 E7-9 Total average cost per unit, $.50 E7-10 Charge to Factory Overhead Control for spoilage, $8,250 E7-11 (1) Work in process, ending inventory, $25,800 E7-12 Cost transferred to Bottling Dept., $18,300 P7-1 (1) Charge to Factory Overhead Control, $1,450 P7-2 (2) Sales revenue, $121,800 P7-3 (1) Charge to Factory Overhead Control, $2,000 P7-4 Charge to Factory Overhead Control for spoilage of Assembling Dept., $12,000 P7-5 Cost transferred from Mixing and Brewing Dept. to Canning Dept., $6,440 P7-6 Charge to Factory Overhead Control for spoilage of Fabricating Dept., $810 P7-7 Distillation Dept. work in process, ending inventory, $2,760 To download more slides, ebook, solutions and test bank, visit http://downloadslide.blogspot.com
- 3. To download more slides, ebook, solutions and test bank, visit http://downloadslide.blogspot.com
- 4. CHECK FIGURES, COST ACCOUNTING, 14th Ed., by Carter P8-1 (2) Cost of goods sold, B, $808,200 P8-2 (1) May gross profit, T, $45,000 P8-3 (2) Gross profit for Alpha, $73,792 P8-4 (3) Gross profit for Jana, $50,000 P8-5 (2) Finished goods inventory, SPL-3, $178,160 P8-6 (1) Total cost accounted for, Process 3, $137,500; (3) Total unit cost, Process 2, $4.10 E9-2 Quantity to order for November delivery, 4,400 units E9-3 (1) Quantity to order for March delivery, 5,800 units E9-6 (2) Ordering and carrying costs, $1,510 E9-8 (4) Absolute maximum inventory, 6,000 units E9-9 (3) Normal maximum inventory, 3,960 units E9-11 (1) Jan. 27 inventory, $842 P9-3 (2) Normal maximum inventory, 4,300 units P9-5 (1) March 31 inventory, $12,400 P9-6 (2) (b) Dec. 5 inventory, $3,900 P9-7 (1)(a) April 30 inventory, $7,805.60; (b) April 30 inventory, $7,700; (c) April 30 inventory, $6,800 C9-1 (1)(b) Optimum production run of desks, 2,000 E10-1 Expected annual savings, $40,500 E10-3 Expected annual savings, $2,200,000 E10-4 (1)(c) Per unit, $66.726 E10-10 (4) Difference, rounded to the nearest tenth of one percent, 0.9% E10-11 (3) Difference, rounded to the nearest tenth of one percent, 0.1% P10-1 (1) Expected annual savings, $720,000 P10-2 (1) Average lead time, 42 days P10-3 (2) Cost of Goods Sold balance at June 30, $1,810,700 P10-4 (2) Cost of Goods Sold balance at May 31, $1,306,200 P10-5 (1) Estimated before-tax dollar savings, $37,500 P11-1 (1) Per-unit conversion cost for 40 units, $4.40 P11-2 (2) Incentive plan unit conversion cost, $13.55 P11-3 (1) Monday's unit labor cost, $.514 P11-4 (2) Conversion cost per unit, $.3685 P11-5 Underpayment, Emerson Efficiency System: Suggs, $35.60; Ward, $39.76 P11-6 (2) Group's total earnings for week, $1,380 P11-7 (1) Factory w orkers' share of bonus, $9,375 P11-8 (1) Direct labor hours per unit for the next order, 2.4192 P11-9 (2) Factory overhead charge for Employee #1071, $333.20 P11- 10 (3) Accrued Payroll, $2,640 To download more slides, ebook, solutions and test bank, visit http://downloadslide.blogspot.com
- 5. CHECK FIGURES, COST ACCOUNTING, 14th Ed., by Carter E12-1 (1) Fixed overhead, $1,750,000 E12-5 (2)(a) Factory overhead rate, $16.69 E12-7 (2) Underapplied factory overhead, $10,600 E12-8 Overapplied overhead, $(1,086) E12-9 (2) Underapplied overhead, $461 E12-11 (3) Overapplied factory overhead, $(9,000) P12-1 (2) Predetermined rate at practical capacity, $316.67 per machine hour (MH) P12-3 (1) Total cost of Job 50, $156,750 P12-4 (3) Amount included in cost of goods sold for Job 1376, $91,700; (4) Cost assigned to w ork in process account at end of year 20—, $205,800 P12-5 (1) Factory overhead rate, $.95; (5) Underapplied overhead, $2,450 P12-6 (2) Total actual factory overhead, $117,000 E13-3 (1) Job 437 Overhead, $30.18 E13-4 (1) Plantwide rate per direct labor hour, $.83 E13-6 Mixing Dept. rate, $3.00; Finishing Dept rate, $4.00 E13-7 (2) Plantwide rate per direct labor hour, $36.317 E13-8 (2) Job No. 3752 total, $331 E13-13 (2) Job No. 345 total, $2,425 E13-14 (2) Job No. 103 total, $47,500 P13-1 (2) Overhead rates: Grinding Dept., $82.25 per machine hour; Smoothing Dept., $11.73 per direct labor hour; (3) Overhead rates: Grinding Dept., $84.05 per machine hour; Smoothing Dept., $11.49 per direct labor hour P13-2 (2) Cutting Dept., $2.30 per machine hour; Assembly Dept., $4.50 per direct labor hour; Finishing Dept., $1.50 per direct labor hour P13-3 Dept. 10 overhead rate per machine hour, $100.00 P13-4 Overhead rates per direct labor hour: (1) Molding Dept., $10.60; Assembly Dept., $2.46; (2) Molding Dept., $9.80; Assembly Dept., $2.66 P13-6 (1) Powerhouse = $30,000; Personnel = $40,000; Gen. Factory = $50,000 P13-7 (2) Factory overhead applied to Dept. 10, $8,928 P13-8 (2) Job No. 564 total, $3,350; (4)(b) Job No. 564 total, $4,175 E14-3 $2,000 overstatement E14-4 $4,800 overstatement E14-7 (1) Overhead cost allocated, $126; (2) Overhead cost allocated, $554 E14-9 (1) Overhead cost allocated, $140; (2) Overhead cost allocated, $740 P14-1 (3) Overhead rate, $57 per setup P14-2 (3) Overhead rate, $1,020 per setup P14-3 (1) Custom cost per unit, $1,900; (2) Standard cost per unit, $106.98 P14-4 (1) Fancy cost per unit $1,000; (2) Plain cost per unit , $87.34 P14-5 (1) Super cost per unit, $400; (2) Normal cost per unit, $34 P14-6 Large cost per unit: (1) $172; (2) $156.80 C14-1 #321 cost per unit: (1) $135; (2) $84.83 C14-2 #33 cost per unit: (1) $557.40; (2) $525.30; (4) $816.35 To download more slides, ebook, solutions and test bank, visit http://downloadslide.blogspot.com
- 6. CHECK FIGURES, COST ACCOUNTING, 14th Ed., by Carter E15-1 Total budgeted sales revenue, $1,136,040 E15-2 Budgeted Production for Flop, 21,500 units E15-3 Budgeted Production for Moon Glow, 251,200 equivalent units E15-4 (1) Budgeted Production for Low Band, 190 units E15-5 (4) Materials purchase budget for Material A, $10,900 E15-6 (3) Total variable manufacturing cost for Tribolite, $89,100 E15-7 Budgeted purchases, $2,600,000 E15-8 Income before income tax, $190,000 E15-9 Operating income before taxes and interest, $1,617,000 P15-1 (4) Total budgeted labor, $2,147,000 P15-2 (1) January total DLH, 20,000 P15-3 (2) Total cost of budgeted purchases of Material 101, $255,840 P15-4 (1) 6-month total budgeted sales, 1,327,500 units P15-5 (1) First quarter budgeted net income, $56,000 P15-6 (2) Budgeted billing rate for Vickers, $52.00 P15-7 Model 100, planned production, 12,100 units P15-8 Predetermined overhead rate for Testing Dept., $11.00 per machine hour P15-9 (1) Ending balance in retained earnings, $99,300 E16-1 January ending cash balance, $20,500 E16-2 May cash disbursements for materials purchases, $619,360 E16-3 July cash disbursements for purchases of Tee, $509,600 E16-4 Ending cash balance, $1,550 E16-5 (2) Critical path 1-2-5-6-7, 11 weeks E16-6 Expected time for activity 1-2, 2.00 days E16-7 (2) Slack time at event 3, 1 day E16-8 (4) Slack time at event 2, 2 days P16-1 (1) Budgeted cash disbursements for June, $323,279 P16-2 Cash to be borrowed in April, $122,000 P16-3 Cash balance at the end of 20B, $75,000 P16-4 Current financing required, $84,162 P16-5 (1) Total cash revenue, $709, 100 P16-6 (1) Total cash receipts during July, $4,580,000 P16-7 (2) Cost of operating on the first day, $1,600 P16-8 (3) Total normal cost, $17,100 P16-9 (1) Critical path A-B-E-H-K-L, 11 weeks To download more slides, ebook, solutions and test bank, visit http://downloadslide.blogspot.com
- 7. CHECK FIGURES, COST ACCOUNTING, 14th Ed., by Carter E17-1 (2) Maintenance Dept. spending variance, $5,500 unfav. E17-2 (3) Carpenter Shop idle capacity variance, $2,450 unfav. E17-3 (2) Payroll Dept. spending variance, $(455) fav. E17-4 (1) Total cost billed to Dept. A, $2,800 E17-5 (1) First quarter total billing to Cutting Dept., $5,400 E17-6 Total actual cost per mile, $.0059 under budget E17-7 Total budgeted cost at 90% capacity, $34,090 E17-8 Total budgeted cost at 110% capacity, $27,500.00 E17-9 Total spending variance, $220 unfav. E17-10 Idle capacity variance, $12,280 unfav. P17-1 (2) Dept. A overhead, $2,191 underapplied P17-2 (2) Planers overhead rate, $3.825 per DLH P17-3 (2) Machining Dept. spending variance, $328 unfav. P17-4 Total variable cost at 90% capacity, $102,645 P17-5 (2) Total spending variance, $689.00 unfav. P17-6 (2) Idle capacity variance, $600.00 unfav. E18-1 Materials quantity variance, $2,700 unfav. E18-2 Materials purchase price variance, $(2,500) fav. E18-3 (2) Materials price usage variance, $1,278 unfav. E18-4 Labor efficiency variance, $500 unfav. E18-5 (2) Labor rate variance, $93 unfav. E18-6 Controllable variance, $20,500 unfav. E18-7 Volume variance, $4,800 unfav. E18-8 Variable efficiency variance, $2,320 unfav. E18-9 Spending variance, $650 unfav. E18-10 (2) Spending variance, $(5,000) fav. E18-11 Materials mix variance, $(4,500) fav. E18-12 (2) Materials yield variance, $540 unfav. E18-13 Total controllable variance, $282 unfav. E18-14 Idle capacity variance, $(800) fav. E18-15 Fixed efficiency variance, $(500) fav. P18-1 (2) Volume variance, $1,000 unfav. P18-2 (1) Standard quantity allowed for Material A, 14,700 units P18-3 (2) Labor efficiency variance, $2,300 unfav. P18-4 (2) Materials quantity variance, $8,000 unfav. P18-5 (2) Variable efficiency variance, $200 unfav. P18-6 (3)(b) Labor efficiency variance for Lot 22, $(98) fav. P18-7 Volume variance, $1,005 unfav. P18-8 Total spending quantity variance, $690 unfav. P18-9 Factory overhead efficiency variance, $3,150 unfav. P18-10 Fixed efficiency variance, $20,000 unfav. To download more slides, ebook, solutions and test bank, visit http://downloadslide.blogspot.com
- 8. CHECK FIGURES, COST ACCOUNTING, 14th Ed., by Carter E19-1 Materials quantity variance, $42 debit E19-2 (3) Materials price usage variance (fifo inventory), $760 debit E19-3 Labor efficiency variance, $1,140 debit E19-4 Labor efficiency variance, $900 credit E19-5 (3) Controllable variance, $8,700 credit E19-6 (4) Controllable variance, $2,900 debit E19-7 (3) Variable efficiency variance, $1,600 debit E19-8 (3) Volume variance, $3,000 debit E19-9 Adjusted end-of-year balance in Finished Goods Inventory, $181,400 E19-10 Total net variances charged to Work in Process, $237.50 debit E19-11 Idle capacity variance, $2,040 debit E19-12 Spending variance, $7,200 credit P19-1 Labor efficiency variance, $400 debit P19-2 Materials quantity variance, $3,000 debit P19-3 Volume variance, $2,250 credit P19-4 Net manufacturing variances, $90 fav. P19-5 Net income, $1,741,700 P19-6 (1) Volume variance, $12,000 debit P19-7 (1) Labor efficiency variance, $1,400 credit P19-8 (3) Work in Process adjusted to actual cost, $15,150 P19-9 Overhead efficiency variance, $500 debit P19- 10 Spending variance, $520 credit E20-1 Operating income, $412,000 E20-2 (1) Cost of goods sold at standard under absorption costing, $6,500,000 E20-3 (2) Operating income under direct costing, $96,000 E20-4 Break-even point, $10,000 E20-5 (1) Break-even point, 13,000 units E20-6 Margin of safety, $500,000 E20-7 (1) Break-even point, $15,000 E20-8 (1) Break-even point, $50,000 E20-9 Fixed cost, $1,190,000 E20-10 Break-even point, $1,500,000 E20-11 (2) Required sales, $1,275,000 E20-12 (1) Sales price to break-even, $6.50 E20-13 Break-even point, $140,000 and 7,000 units P20-1 Operating income, $100,000 P20-2 (2) Operating income under direct costing, $296,000 P20-3 (1) Operating income under absorption costing, $191,000 P20-4 (2) First quarter operating income under direct costing, $22,600 P20-5 (1) Break-even point with capital-intensive manufacturing, 210,000 units P20-6 (2) Units to be sold at $40 each to produce required profit, 4,500 P20-7 Sales to produce required profit, 12,324 units of B2 plus 18,486 units of B4 P20-8 (1) sales to break-even, 40,000 tape recorders plus 80,000 calculators P20-9 (1) (a) Sales to break-even, 500 units P20- 10 (2) Break-even point, $1,000,000 To download more slides, ebook, solutions and test bank, visit http://downloadslide.blogspot.com
- 9. CHECK FIGURES, COST ACCOUNTING, 14th Ed., by Carter E21-1 Differential profit from accepting new business, $1,595 E21-2 (1) Differential cost, $250,000 E21-3 Differential profit from sale, $45,000 E21-4 Savings from manufacturing part, $5,000 E21-5 Savings from purchasing pistons, $6,000 E21-6 (1) Gross contribution margin from Tift, $14,000 E21-7 Net contribution margin, $.70 per unit E21-8 (1) Minimum bid price, $.008 per dose E21-9 Average daily franchise fee collections, $52,500 E21-10 Annual savings with new AZ-17 process, $125,333 E21-11 Marking board contribution margin when using automated assembly, $19.90 E21-12 Maximum contribution margin, $900 E21-13 Maximum contribution margin, $2,600 E21-14 Minimum cost, $17 E21-15 Minimum cost, $8,200 P21-1 (1) Increment to pretax profit, $432,000 P21-2 (1) Increase in net income by accepting bid, $27,900 P21-3 (1) (c) Differential cost if level production is used, $88,785 P21-4 Group I total production costs, $32,050 P21-5 (1) Differential cost of special order, $34,750 P21-6 Total operating income with additional capacity, $65,855 P21-7 (1) Sales required to recover fixed overhead and regional promotion costs, 160,000 units P21-8 Annual cost savings with discount quantity plan, $41,850 P21-9 (1) Net revenue with plain paper and bulk mail, $1,083,600 P21- 10 (1) Net local market contribution, $310,000 E22-1 Excess cash inflows over outflows, $200,000 E22-2 Excess cash inflows over outflows, $116,000 E22-3 Total price-level adjusted pretax cash inflows, $128,795 E22-4 Excess of pretax cash inflows over outflow s, $524,070 E22-5 Excess of net after-tax cash inflow s over outflow s, $360,000 E22-6 Excess of net after-tax cash inflow s over outflow s, $114,000 E22-7 Excess of net after-tax cash inflow s over outflow s, $60,000 P22-1 Excess of inflation-adjusted net after-tax cash inflows over outflow s, $47,278 P22-2 Excess of net after-tax cash inflow s over outflow s, $7,560 P22-3 (1) Total after-tax cash inflows from making product, $3,868,000 P22-4 Excess of inflation-adjusted net after-tax cash inflows over outflow s, $347,940 P22-5 (2) Excess of inflation-adjusted net after-tax cash inflows over outflows, $23,984 P22-6 Excess of inflation-adjusted net after-tax cash inflows over outflow s, $151,952 P22-7 (1) Excess cost of CIM system over after-tax savings, $359,652 To download more slides, ebook, solutions and test bank, visit http://downloadslide.blogspot.com
- 10. CHECK FIGURES, COST ACCOUNTING, 14th Ed., by Carter E23-1 Weighted average cost of capital, 11.90% E23-2 Weighted average cost of capital before bond retirement and sale-leaseback, 8.3% E23-3 (1) Payback period, 3.636 years E23-4 (2) Net present value of investment, $4,840 E23-5 (2) Present value index, 8.1% E23-6 Present value of tax savings, $2,439 E23-7 (2) Net present value of investment, $5,998 E23-8 Net present value of investment, $31,731 E23-9 Internal rate of return, 12.76% E23- 10 (2) Project A internal rate of return, 19.87% P23-1 (2) Weighted average cost of capital, 9.33% P23-2 Estimated land value, $552,791 P23-3 (2) Project 1 internal rate of return, 15.67% P23-4 (2) Accounting rate of return on original investment, 13.9% P23-5 (5) Machine 1, internal rate of return, 18.6% P23-6 (2) Accounting rate of return on average investment, 20.58% P23-7 (4) Net present value index, .249 P23-8 (3) Net present value of investment, $175,163 P23-9 Net present value of purchase alternative, $727,129 P23- 10 Net present value of lease alternative, $14,000 24-1 (2) Standard deviation, $24,000 E24-2 (2) Coefficient of variation, .114 E24-3 Expected value of unit cost, $13.40 E24-4 Expected value of purchasing 180,000 units, $32,500 E24-5 (2) Expected value of perfect information, $1,800 E24-6 Posterior probability of 40,000 unit demand, .25 E24-7 Expected value of moving, $40,000 E24-8 Expected value of making sub-assembly, $26,000 E24-9 Expected value of bidding on Parcel A, $120,000 E24- 10 (1) Standard deviation, 7,496 units E24- 11 Expected net present value, $1,775 E24- 12 Variance of net present value, $822,539 E24- 13 Standard deviation of net present value, $3,791 E24- 14 Variance of the total net present value of the investment, $49,994,656 E24- 15 (2) Probability that the NPV will be positive, .88493 P24-1 (2) Expected annual pretax advantage, $2,743,250 P24-2 Plan 3 estimated total cost, $347,160 P24-3 Maximum amount to pay for quality control program, $440,000 P24-4 (1) Expected value of ordering 400 shirts, $1,480 To download more slides, ebook, solutions and test bank, visit http://downloadslide.blogspot.com
- 11. P24-5 (1) Posterior probability of demand for 2,000 sq. ft. houses, .3125 P24-6 (2) Decrease in costs from accepting printer's offer, $3,331 P24-7 Expected value of not testing, $900 P24-8 Expected value of selecting a $5.25 sales price, $387,000 P24-9 Expected value of Strategy 2, $1,000,000 P24- 10 (2) Expected net present value, $16,895 P24- 11 (3) Standard deviation of expected NPV, $107,308 P24- 12 (2) Standard deviation of total NPV, $2,554 P24- 13 Weighted score for new technology, 90.0 To download more slides, ebook, solutions and test bank, visit http://downloadslide.blogspot.com
- 12. CHECK FIGURES, COST ACCOUNTING, 14th Ed., by Carter E25-1 (3) Rate of return on capital employed, .20 E25-2 (3) Recreational products rate of return on capital employed, .300 E25-4 (1) Increased income from outside sales, $600,000 E25-5 Savings if Blade Division manufactures blades, $2,500 P25-1 (1) Rate of return on capital employed for Springy, 20% P25-2 (3) Cost savings by using units from Compressor Division, $312,500 P25-3 (1) $10 advantage to Clarkson P25-4 (1) Opportunity cost of shifting production to Economy model, $540 P25-5 (1) Difference for Cole Division in favor of Wales Company contract, $25,000 To download more slides, ebook, solutions and test bank, visit http://downloadslide.blogspot.com