
Recommended
More Related Content
Similar to Individual Tailoring Project Report
Similar to Individual Tailoring Project Report (20)
Recently uploaded
Recently uploaded (20)
Individual Tailoring Project Report
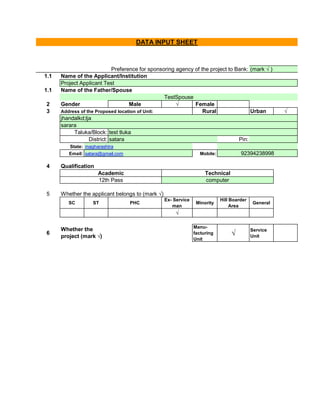
- 1. 1.1 1.1 2 Gender Male √ Female 3 Rural Urban √ Pin: State: Email: Mobile: 4 5 Whether the applicant belongs to (mark √) SC ST PHC Ex- Service man Minority Hill Boarder Area General √ 6 Manu- facturing Unit √ Service Unit Whether the project (mark √) Qualification Academic Technical 12th Pass computer District: satara magharashtra satara@gmail.com 92394238998 Name of the Father/Spouse TestSpouse Address of the Proposed location of Unit: jhandalkd;lja sarara Taluka/Block: test tluka DATA INPUT SHEET Preference for sponsoring agency of the project to Bank: (mark √ ) Name of the Applicant/Institution Project Applicant Test
- 2. 8 Legal Status: Area Rate/Sq.ft 100 200.00 Qty. Rate 2 100.00 10 12.00 15 100.00 f. Contingency/Others/Miscellaneous : 50000.00 Working Capital : 80000.00 d. Preliminary & Pre-operative Cost : 10000.00 e. Furniture & Fixtures : 20000.00 0.00 0.00 Total 1820.00 0.00 0.00 0.00 0.00 0.00 0.00 test 1 120.00 test 2 1500.00 test 5 0.00 MACHINERY DETAILS Particulars Amount in Rs. te3st machinery 200.00 0.00 0.00 0.00 0.00 0.00 BUILDING DETAILS Particulars Amount in Rs. test 20000.00 0.00 Name of the project / business activity proposed : Test 1 Land 10000
- 3. 5% 95% 25% Rate/ Qantity Unit 12.00 100 12.00 500 Unit Rate/Unit Reqd. Unit 10 13.00 1111 10 15.00 1222 No. of Worker Total Month 12 21 20 Particulars of Products Particulars 0.00 0.00 0.00 0.00 wearwert 1000.00 240000.00 0.00 WAGES Wages Per Month Amount in Rs. testkkkkoiijl 11000.00 2772000.00 0.00 0.00 Total 32773.00 0.00 0.00 0.00 test 18330.00 0.00 0.00 RAW MATERIALS Particulars Amount In Rs. RAW MATERIALS 14443.00 0.00 Total 7200.00 0.00 0.00 0.00 Amount in Rs. wirutuisg 1200.00 test 6000.00 0.00 DETAILS OF SALES Own Contribution : Bank Finance : Margin Money (Govt. Subsidy) : Means of Financing
- 4. 41 No. of Staff Total Month 12 5 10 15 No. of Days 10 20 30 10 200 12.00% Rs. 13.00% Rs. 14.00% Rs. 15.00% Rs. 12.00% Rs. 11.00% Rs. Rs. 9.00% Rs. 1.00% 12.00% 1.00% Particulars Rate of Interest Depreciation On Building On Machinery Other Miscelleneous Expenditure 648.00 Advertisement & Publicity 792.00 Building Rent 100.00 Stationery & Postage 864.00 Other Overhead Expenses 1008.00 Telephone Expenses 1080.00 864.00 Power and Fuel 936.00 Receivable by POWER ESTIMATE Power Requirement Repair and Maintanance WORKING CAPITAL ESTIMATE Element of Working Capital 2000 Stock in process Finished goods 0.00 Total 3000.00 0.00 0.00 testyuyuu 10.00 600.00 sandy 20.00 2400.00 Total 3012000.00 SALARY DETAILS Wages Per Month Amount in Rs.
- 5. ABOUT THE PROMOTER proimoter of the project report Inteodduction vof the project report INTRODUCTION
- 6. 1 2 3 4 jhandalkd;lja sarara Taluk/Block: District : test tluka Pin: 0 State: Maharashtra E-Mail : Mobile 92394238998 5 6 Cost of Project : Rs. 7,13,440 7 Means of Finance Rs. 6,77,768.00 Rs. 1,78,360.00 Rs. 35672.00 8 : 9 Pay Back Period : 5 Years 10 : 0 Months 11 : 12 : 56 13 : 200 14 : 15 : Rs. 7200.00 PROJECT AT A GLANCE - TOP SHEET Debt Service Coverage Ratio Project Implementation Period Name of the project / business activity proposed : Test 1 Estimated Annual Sales Turnover RAW MATERIALS,test, KVIC Margin Money Own Capital Break Even Point Employment Power Requirement Major Raw materials Unit Address : test tluka satara@gmail.com Product and By Product Term Loan Name of the Entreprenuer Project Applicant Test Constitution (legal Status) : Individual Father's/Spouce's Name TestSpouse PMEGP Project Report Page 1
- 7. 1 2 3 Area Sq.ft Rate in Rs. 100 200.00 0 0.00 0 0.00 0 0.00 0 0.00 0 0.00 0 0.00 Qty. Rate 2 100.00 10 12.00 15 100.00 0 0.00 0 0.00 0 0.00 0 0.00 0 0.00 0 0.00 0 0.00 0 0.00 0 0.00 Inteodduction vof the project report Total 1820.00 0 0.00 0 0.00 0 0.00 0 0.00 0 0.00 0 0.00 test 5 0.00 0 0.00 0 0.00 te3st machinery 200.00 test 1 120.00 test 2 1500.00 0 0.00 Total 20000.00 #REF! C. Machinery Amount in Rs. 0 0.00 0 0.00 0 0.00 test 20000.00 0 0.00 0 0.00 A. Fixed Capital Investment a. Land : 10000 Own b. Workshed Amt. In Rs. DETAILED PROJECT REPORT INTRODUCTION : ABOUT THE PROMOTER : COST OF PROJECT proimoter of the project report PMEGP Project Report Page 2
- 8. Rs. Rs. Rs. Rs. Rs. Rs. 3.1 5% Rs. 95% Rs. Rs. Rs. 25% Rs. 3.2 Interest @ 1.00% 1st 0 967 2nd 19346 967 3rd 19346 774 4th 19346 580 5th 19346 387 6th 19346 193 7th 0 0 8th 0 0 Interest @ 1.00% 1st 0 5810 2nd 116208 5810 3rd 116208 4648 4th 116208 3486 5th 116208 2324 6th 116208 1162 7th 116208 0 8th 0 0 Year Year Installment Installment Opening Balance Closing Balance 116208 0 0 0 0 0 464831 348623 348623 232416 232416 116208 0 0 WORKING CAPITAL 581039 581039 581039 464831 Opening Balance Closing Balance 38692 19346 19346 0 0 0 96729 77383 77383 58037 58037 38692 CMEGP in the name of Beneficiary for three years in the financing branch. STATEMENT SHOWING THE REPAYMENT OF TERM LOAN & WORKING CAPITAL : TERM LOAN 96729 96729 Total 677768.00 Margin Money (Govt. Subsidy) 178360.00 Margin Money Subsidy received will be kept in term deposit as per norms of Term Loan 96729.00 Working Capital 581039.00 Means of Financing : Own Contribution 35672.00 Bank Finance : Working Capital : 611620.00 Total Cost Project : 713440.00 f. Contingency/Others/Miscellaneous : 50000.00 Total Capital Expenditure : 101820.00 d. Preliminary & Pre-operative Cost : 10000.00 e. Furniture & Fixtures : 20000.00 PMEGP Project Report Page 3
- 9. 3.3 @ 12.00% 1st Year 2nd Year 3rd Year 4th Year 5th Year 20000 17600 15488 13629 11994 2400 2112 1859 1636 1439 17600 15488 13629 11994 10555 @ 1.00% 1820 1802 1784 1766 1748 18 18 18 18 17 1802 1784 1766 1748 1731 2400 2112 1859 1636 1439 18 18 18 18 17 2418 2130 1876 1653 1457 4 4.1 Rate/ No. of Pair/Unit Pair/Unit 12.00 100 12.00 500 0.00 0 0.00 0 0.00 0 0.00 0 0.00 0 4.2 1st Year 2nd Year 3rd Year 4th Year 5th Year 70% 80% 90% 90% 90% 5040 5760 6480 6480 6480 5 Unit Rate/unit Reqd.Unit 10 13.00 1111 10 15.00 1222 0 0.00 0 0 0.00 0 0 0.00 0 0 0.00 0 0 0.00 0 0 0.00 0 0 0.00 0 5.1 No. of Worker 21 20 0 0 0 0 0 41 5.2 Rs. Total 3012000.00 Repairs and Maintenance : 864.00 0 0.00 0.00 0 0.00 0.00 0 0.00 0.00 0 0.00 0.00 wearwert 1000.00 240000.00 0 0.00 0.00 Wages : Wages Amount in Rs. Per Month (Per Annum) testkkkkoiijl 11000.00 2772000.00 Particulars 0 0.00 0 0.00 Total 32773.00 0 0.00 0 0.00 0 0.00 test 18330.00 0 0.00 0 0.00 Rawmaterials : Particulars Amount in Rs. RAW MATERIALS 14443.00 Capacity Utilization of Sales Particulars Capacity Utilization Sales / Receipts 0 0.00 Total 7200.00 0 0.00 0 0.00 0 0.00 wirutuisg 1200.00 test 6000.00 0 0.00 Machinery Total Schedule of Sales Realization : Details of Sales 0 Particulars of Product Amount in Rs. MACHINERY Opening Balance Depreciation Closing Balance TOTAL DEPRECIATION Workshed STATEMENT SHOWING THE DEPRECIATION ON FIXED ASSETS: WORKSHED Particulars Opening Balance Depreciation Closing Balance PMEGP Project Report Page 4
- 10. 5.3 Rs. 5.4 Rs. 6 6.1 5 10 0 0 0 15 6.2 6.4 6.5 6.6 6.7 7 1st Year 2nd Year 3rd Year 4th Year 5th Year 70% 80% 90% 90% 90% 22941 26218 29496 29496 29496 2108400 2409600 2710800 2710800 2710800 605 691 778 778 778 655 749 842 842 842 706 806 907 907 907 3000 3000 3000 3000 3000 756 864 972 972 972 605 691 778 778 778 554 634 713 713 713 1200 1200 1200 1200 1200 454 518 583 583 583 2139876 2444972 2750069 2750069 2750069 8 Production Cost 3047581.00 Administrative Cost 7584.00 Manufacturing Cost 3055165.00 Repair & Maintenance 864.00 Power & Fuel 936.00 Other Overhead Expenses 1008.00 Manufacturing Expenses Raw Material 32773.00 Wages 3012000.00 Particulars Amount in Rs. Sale 7200.00 Stationery & Postage Advertisement & Publicity Workshed Rent Other Miscellaneous Expenses Total: Assessment of Working Capital : Repairs & Maintenance Power & Fuel Other Overhead Expenses Administrative Expenses Salary Postage Telephone Expenses Capacity Utilization of Manufacturing & Administrative Expenses : Particulars Capacity Utilization Manufacturing Expenses Rawmaterials Wages Workshed Rent 1200.00 Other Miscellaneous Expenses 648.00 Total 7584.00 Stationery & Postage 864.00 Advertisement & Publicity 792.00 Total 3000.00 Telephone Expenses 1080.00 0.00 0.00 0.00 0.00 sandy 20.00 2400.00 0 0.00 0.00 Other Overhead Expenses : 1008.00 Administrative Expenses : Salary testyuyuu 10.00 600.00 Power and Fuel : 936.00 PMEGP Project Report Page 5
- 11. No of Days 10 20 30 10 9 9.1 0 Year 1st Year 2nd Year 3rd Year 4th Year 5040 5760 6480 6480 5040 5760 6480 6480 22941 26218 29496 29496 2108400 2409600 2710800 2710800 605 691 778 778 655 749 842 842 706 806 907 907 2418 2130 1876 1653 2135725 2440195 2744699 2744476 3000 3150 3308 3473 756 864 972 972 605 691 778 778 554 634 713 713 1200 1200 1200 1200 454 518 583 583 6569 7057 7554 7719 967 967 774 580 5810 5810 4648 3486 2149071 2454030 2757675 2756261 -2144031 -2448270 -2751195 -2749781 0.00 0.00 0.00 0.00 -2144031 -2448270 -2751195 -2749781 9.2 0 Year 1st Year 2nd Year 3rd Year 4th Year -2144031 -2448270 -2751195 -2749781 2418 2130 1876 1653 -2141613 -2446140 -2749319 -2748128 967 967 774 580 0 19346 19346 19346 5810 5810 4648 3486 6778 26123 24768 23412 -315.98 Average D.S.C.R -93.64 -111.00 -117.38 Interest Installment On Working Capital Interest TOTAL - B D.S.C.R = A/B Net Profit Add : Depreciation TOTAL - A Payments : On Term Loan : Cost of Sale Net Profit Before Tax Less Tax Net Profit CALCULATION OF DEBT SERVICE CREDIT RATIO (D.S.C.R) : Particulars Workshed Rent Other Miscellaneous Expenses Administrative Cost Interest on Bank credit @ 1% Term Loan Working Capital Loan Production Cost Administrative Expenses Salary Postage Telephone Expenses Stationery & Postage Advertisement & Publicity Rawmaterials Wages Repairs & Maintenance Power & Fuel Other Overhead Expenses Depreciation Financial Analysis Projected Profit & Loss Account : Particulars Sales / Receipts Manufacturing Expenses Total Working Capital Requirement Per Cycle 611620.00 Receivable by Manufacturing Cost 101839.00 Finished goods Manufacturing Cost 305517.00 Stock in process Production Cost 203172.00 Working Capital Estimate : Element of Working Capital Basis Amount in Rs. 2000 Material Cost 1092.00 PMEGP Project Report Page 6
- 12. 9.3 0 Year 1st Year 2nd Year 3rd Year 4th Year 35672 35672 35672 35672 -2144031 -2448270 -2751195 -2749781 96729 96729 77383 58037 581039 581039 464831 348623 0 0 0 0 0 0 0 0 -1430591 -1734830 -2173309 -2307449 41820 39402 37272 35395 2418 2130 1876 1653 39402 37272 35395 33742 10000 7500 5625 4219 581039 581039 464831 348623 -2051032 -2353140 -2673535 -2689814 -1430591 -1734830 -2173309 -2307449 9.4 0 Year 1st Year 2nd Year 3rd Year 4th Year -2144031 -2448270 -2751195 -2749781 2418 2130 1876 1653 96729 96729 77383 58037 581039 581039 464831 348623 35672 0 0 0 -1428173 -1768372 -2207104 -2341467 101820 0 19346 19346 19346 0 116208 116208 116208 581039 581039 464831 348623 581039 716593 600385 484177 0 -2009212 -4494176 -7301666 -2009212 -2484964 -2807489 -2825644 -2009212 -4494176 -7301666 -10127310 9.5 0 Year 1st Year 2nd Year 3rd Year 4th Year 9954 10155 10204 9952 2141535 2446005 2749348 2747962 2151490 2456160 2759551 2757914 5040 5760 6480 6480 -2136495 -2440245 -2742868 -2741482 -0.47% -0.42% -0.37% -0.36% -23 -24 -24 -24 -2 -2 -2 -2 85.73 4.08 3.30 2.50 -42540.31% -42504.68% -42456.71% -42434.90% Current Ratio Net Profit Ratio B.E.P in % Break Even Sales in Rs. Break Even Units Variable Cost Total Cost Sales Contribution (Sales-VC) Surplus Closing Balance BREAK EVEN POINT AND RATIO ANALYSIS : Particulars Fixed Cost Repayment of Term Loan Repayment of WC Loan Current Assets Total Opening Balance Working Capital Loan Promoters Capital Total Total Fixed Capital Invested Total CASH FLOW STATEMENT : Particulars Net Profit Add : Depreciation Term Loan Gross Fixed Assets : Less : Depreciation Net Fixed Assets Preliminary & Pre-Op. Expenses Current Assets Cash in Bank/Hand Term Loan Working Capital Loan Current Liabilities Sundry Creditors ASSETS : PROJECTED BALANCE SHEET : Particulars LIABILITIES : Promoters Capital Profit PMEGP Project Report Page 7
- 13. Place : Date: Full Name : This Project Report has been prepared based on the data furnished by the entrepreneur whose details are given in the application. Prepared by : PROJECT APPLICANT TEST Signature of the Beneficiary PMEGP Project Report Page 8
- 14. PMEGP Project Report Page 9
- 15. PMEGP Project Report Page 10
- 16. PMEGP Project Report Page 11
- 17. PMEGP Project Report Page 12
- 18. PMEGP Project Report Page 13
- 19. PMEGP Project Report Page 14
- 20. PMEGP Project Report Page 15
- 21. PMEGP Project Report Page 16