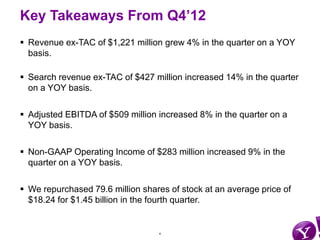
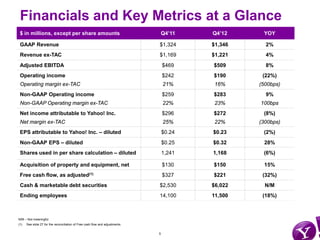
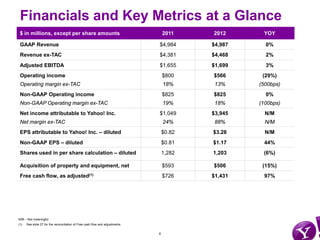
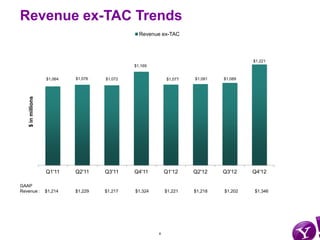
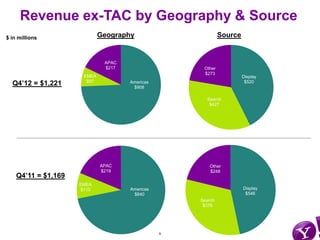
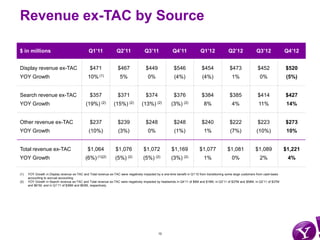
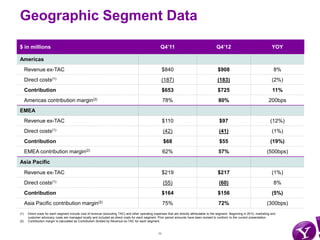
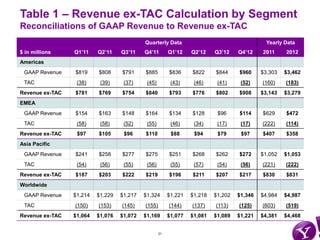
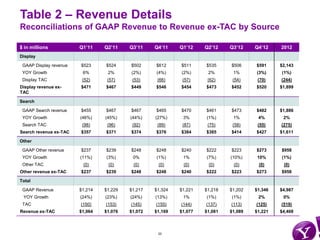
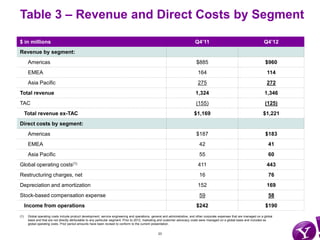
- Yahoo reported Q4 2012 financial results, with revenue ex-TAC of $1.221 billion, up 4% year-over-year.
- Search revenue ex-TAC grew 14% year-over-year to $427 million while display revenue ex-TAC declined 5% to $520 million.
- The majority of revenue ex-TAC came from the Americas at $908 million, up 8% year-over-year.
Yahoo's revenue ex-TAC grew 2% year-over-year to $1.089 billion in Q3'12. Display revenue ex-TAC was roughly flat compared to Q3'11 while search revenue ex-TAC increased 11% driven by growth in paid clicks. The company continues to focus on growing revenue through initiatives in search and display advertising.
SPX reported financial results for the third quarter of 2008. Revenue increased 29% to $1.51 billion due to a 20% increase from acquisitions and 6.5% organic growth. Adjusted earnings per share grew 19% to $1.66 compared to the prior year. For the full year, revenue is expected to increase 8-10% organically in the fourth quarter. Earnings per share for the fourth quarter are targeted to be between $1.90 and $2.00, representing 14-20% growth over the prior year.
- 3M reported strong financial results for the first quarter of 2006, with sales growth of 8.3% and EPS growth of 20.6% compared to the first quarter of 2005.
- All six of 3M's business segments saw operating income increases, led by the Safety, Security & Protection Services segment with a 30.3% increase.
- For the second quarter of 2006, 3M expects local currency sales growth of 5-8% and EPS between $1.14-$1.17, and for the full year expects local currency sales growth of 5.5-8% and EPS of $4.55-$4.65.
- HP reported Q4 FY08 revenue of $33.6 billion, up 19% year-over-year. Non-GAAP diluted EPS was $1.03, up 20% from $0.86 in Q4 FY07.
- For FY08, revenue was $118.4 billion, up 13% year-over-year. Non-GAAP diluted EPS was $3.62, up 24% from $2.93 in FY07.
- Revenue growth was driven by strong performance in the Americas and EMEA regions. The Personal Systems Group saw revenue of $11.2 billion, up 10% year-over-year.
United Stationers Inc. reported third quarter 2012 earnings. Key highlights include:
- Sales were flat compared to Q3 2011 at $1.3 billion. Earnings per share were $0.91 compared to $0.81 last year.
- Gross margin rate increased to 15.8% from 15.3% last year. Operating expenses rose slightly to 10.9% of sales.
- Net income was $36.8 million, up from $35.8 million in Q3 2011. The company also repurchased shares and paid dividends during the quarter.
Goodrich Corporation reported first quarter 2008 results with sales growth of 13% and segment operating income margin increasing from 14.9% to 17.3%. Net income per diluted share increased 59% to $1.24, which includes $0.03 from discontinued operations. For full-year 2008, Goodrich increased its sales outlook to $7.2-7.3 billion (13-14% growth) and net income per diluted share outlook to $4.30-$4.45 (14-18% growth). Key drivers include strong demand for commercial aircraft and aftermarket services as well as defense programs.
unum group 1Q 08_Statistical_Supplement_Notesfinance26
The document is Unum Group's statistical supplement for the first quarter of 2008. It includes financial highlights showing metrics such as premium income, revenues, income, assets and equity. It also includes segment operating results, quarterly historical results by segment, financial results and statistics by business segment (Unum US, Unum UK, Colonial Life, etc.), reserves data, investment information and statutory basis financial information. The supplement provides detailed quarterly and annual financial information about Unum Group to analyze performance by business segment.
The document is Unum Group's statistical supplement for the fourth quarter of 2008. It includes financial highlights, income statements, sales data, balance sheets, and segment results for Unum US, Unum UK, Colonial Life, Individual Disability - Closed Block, and Corporate. Some key figures are total revenue of $2.3 billion for Q4 2008 and $10 billion for full year 2008, net income of $41.8 million for Q4 2008 and $553.2 million for full year 2008, and premium income of $1.9 billion for Q4 2008 and $7.8 billion for full year 2008. Sales increased 6% in Q4 2008 compared to Q4 2007, led by a 12
This document provides financial information for Ameriprise Financial, Inc. for the fourth quarter of 2006. It includes consolidated income statements, adjusted consolidated income statements, financial metrics, segment information, and explanatory notes. Some key figures include total revenues of $2.16 billion for Q4 2006, a 16% increase from Q4 2005. Net income was $171 million for Q4 2006, a 54% increase from Q4 2005. Adjusted earnings per share increased 34% to $1.03 for Q4 2006 compared to $0.77 for Q4 2005.
Goodrich Corporation announced its second quarter 2004 results, reporting a net income of $39 million compared to $14 million in the second quarter of 2003. Sales increased to $1,134 million from $1,095 million. Goodrich also increased its full year 2004 outlook, expecting sales between $4.7-4.75 billion and fully diluted earnings per share between $1.30-1.40. The increased outlook was due to improving conditions in commercial aerospace aftermarket and military and space markets.
Raytheon reported strong financial results for the fourth quarter and full year 2006. Quarterly sales increased 12% to $5.7 billion due to growth at Integrated Defense Systems, Missile Systems, and Network Centric Systems. Earnings per share from continuing operations increased 27% to $0.65 for the quarter. For the full year, sales increased 7% to $20.3 billion and earnings per share from continuing operations increased 37% to $2.46. Raytheon also provided guidance for 2007, forecasting earnings per share from continuing operations between $2.85 to $3.00 on sales between $21.4 to $21.9 billion.
The document provides an overview of AES Corporation's financial results for the first quarter of 2006. Some key highlights include revenues increasing 13% to $3.013 billion compared to the same period in 2005, driven largely by higher prices and currency effects. Income before taxes and minority interest increased 68% to $633 million. Diluted earnings per share from continuing operations were $0.52 compared to $0.19 in the prior year. Segment results were positively impacted by higher demand and prices across most business lines.
Himax Technologies Inc. is a fabless semiconductor company specializing in display imaging processing technologies. It provides display drivers and timing controllers for small to medium-sized LCD panels used in smartphones, tablets, and other devices. Himax has seen increasing revenue from its non-driver products like touch sensors, CMOS image sensors, and power management chips. While previously highly dependent on sales to one customer, Himax has diversified its customer base which has improved its financial performance and profitability in recent years.
Itaú Unibanco Holding S.A. reported its financial results for the first quarter of 2017. Key highlights include:
- Recurring net income increased 6.2% compared to the fourth quarter of 2016 and 19.6% compared to the first quarter of 2016.
- Recurring return on equity was 23.5% for the first quarter of 2017, up from 22.0% in the fourth quarter of 2016.
- Loan loss provisions decreased 7.4% compared to the fourth quarter driven by lower delinquency rates in Brazil.
Bank of America reported record first quarter 2006 earnings of $5 billion, up 14% from the same period in 2005. Net income grew 1% excluding merger charges. Total revenue increased 10% driven by a 55% rise in market sensitive revenue and 5% growth in other revenue. Expenses grew 5% while operating leverage was positive at 5%. The financial results reflected strong performance across global consumer and small business banking and card services.
- Goodrich Corporation reported fourth quarter 2006 results with sales growth of 10% and segment operating margin increase from 11.2% to 12.5% compared to fourth quarter 2005.
- Net income per diluted share was $0.78, reflecting 39% growth including tax adjustments and stock-based compensation expenses.
- For full year 2006, sales grew 9% and segment operating margin increased from 11.5% to 13.0% compared to full year 2005. Net income per diluted share grew 79%.
This document is a 4Q 2006 earnings release from an unnamed company. It provides financial results for 4Q 2006 and full year 2006. Key highlights include 14% sales growth and 19% segment profit growth in 4Q, and 13% sales growth and 21% segment profit growth for 2006. The company also generated $941 million in free cash flow for 4Q and $2.5 billion for 2006. The release provides details on performance by business segment and gives guidance for 2007 of 5-12% growth in segment profit and 13-17% growth in EPS.
Bank of America reported first quarter 2005 results with key highlights including a 21% increase in diluted EPS compared to fourth quarter 2004. Revenue was up 2% from the previous quarter driven by strength in trading and mortgage banking offsetting seasonal declines in consumer business. Credit quality continued to improve across both consumer and commercial portfolios although credit card losses rose due to portfolio growth and minimum payment changes. Overall, the results demonstrated continued momentum in the company's consumer and commercial businesses.
Profarma reported financial results for the first quarter of 2007, with highlights including:
- Gross revenue increased 26.8% year-over-year to R$555.3 million, driven by the opening of a new distribution center in Ceará and growth across all business segments.
- Adjusted EBITDA grew 17.8% to R$15 million compared to the first quarter of 2006.
- Net income increased 324.1% to R$5.1 million, compared to R$1.2 million in the prior year period.
- Key operating metrics such as service level, logistics productivity and sales per employee improved compared to the prior year, demonstrating strong operating execution
This document provides financial highlights and statistical data for Unum Group for quarters 3 and 9 months ended September 30, 2008 and 2007 and years ended December 31, 2007, 2006 and 2005. It includes information on premium income, revenues, benefits expenses, net income, earnings per share, sales data by segment and quarterly performance. Key figures shown are total revenue of $2.4 billion for Q3 2008, net income of $108 million for Q3 2008, and group long-term disability sales increasing 31.4% for Unum US segment in Q3 2008 compared to prior year.
Time Warner reported financial results for Q4 2008 and full year 2008. Revenue was $12.3 billion for Q4, up 1% for the full year. Adjusted operating income before depreciation and amortization was $3.2 billion for Q4, up 1% for the full year. Free cash flow for 2008 was $6 billion, up 20% from 2007. For 2009, Time Warner expects adjusted EPS excluding Time Warner Cable to be around flat compared to $0.66 in 2008.
This document is a statistical supplement from Unum Group for the second quarter of 2008. It includes financial highlights and consolidated financial statements for Unum for quarters, six month periods, and full years 2005-2007. It also includes sales data by segment (Unum US, Unum UK, Colonial Life, etc.) and notes on non-GAAP measures and items affecting results for specific periods. The document provides an overview of Unum's financial and operating results over several years through tables, charts, and explanatory notes.
Danaher Corporation announced record first quarter results for 2007 with net earnings of $255 million, a 16% increase over the first quarter of 2006. Sales increased 19% to $2.56 billion compared to $2.14 billion in the previous year. The company's president stated that core revenue growth was 3.5% despite some business challenges, and total sales growth was also driven by acquisitions and a positive currency impact. Danaher remains confident in its ability to deliver continued positive results in 2007.
This statistical supplement from Ameriprise Financial provides key financial metrics and information for the first quarter of 2006 compared to previous periods. Some highlights include:
- Revenue increased 6% to $1.949 billion from the prior year period, while income before taxes was relatively flat.
- Adjusted earnings increased 17% to $189 million, excluding one-time items.
- Total client assets under management or administration grew 11% to $446 billion.
- The number of financial advisors was relatively unchanged at 12,339.
This document summarizes Raytheon's financial results for the fourth quarter and full year of 2008. Key points include: Raytheon reported solid financial results for Q4 and full year 2008, with record backlog of $38.9 billion; Q4 sales were $6.1 billion and adjusted EPS was $1.13; Full year sales grew 9% to $23.2 billion and adjusted EPS grew 23% to $4.06; Raytheon reaffirmed its financial guidance for 2009 and expects continued growth.
Bank of America reported fourth quarter 2006 results. Key highlights include:
- Net income of $5.26 billion, up 34% from fourth quarter 2005. Excluding merger charges, net income was $5.41 billion, up 37%.
- Global Consumer & Small Business Banking earnings grew 8% over fourth quarter 2005 to $10.63 billion in revenue, driven by increases in net interest income and noninterest income.
- Credit quality remained stable, with the provision for credit losses down 7% from fourth quarter 2005.
- The company achieved earnings growth while completing two large acquisitions, focusing on expense management and maintaining a strong capital position.
This document provides forward-looking statements and non-GAAP financial information for Monsanto's investor day on November 10, 2005. It includes reconciliations of free cash flow, non-GAAP EPS, and return on capital for fiscal years 2004-2007. The document also notes that references to fiscal years refer to Monsanto's year ending August 31 and lists several of Monsanto's trademarks.
United Stationers provides reconciliations of non-GAAP financial measures to GAAP measures for the three months and full year ended December 31, 2007 and 2006. For both periods, adjustments were made to gross profit, operating expenses, operating income, and net income per share for non-recurring items like restructuring charges and product marketing programs. The adjustments resulted in higher adjusted operating income and earnings per share compared to reported GAAP figures. For the full year, adjusted earnings per share grew 18% compared to the prior year.
This document provides details on Celanese Corporation's second quarter 2006 earnings conference call, including an agenda with the CEO and CFO as speakers. It also provides financial highlights for Q2 2006 such as an 11% increase in net sales and an 18% rise in operating EBITDA. Celanese issues guidance for full year 2006 of adjusted EPS between $2.50-$2.80.
Goodrich Corporation reported first quarter 2008 results with sales growth of 13% and segment operating income margin increasing from 14.9% to 17.3%. Net income per diluted share increased 59% to $1.24, including $0.03 from discontinued operations. For full-year 2008, Goodrich increased its sales outlook to $7.2-7.3 billion (13-14% growth) and net income per diluted share outlook to $4.30-$4.45 (14-18% growth). Key drivers included strong commercial aircraft production and aftermarket demand as well as positions on new defense platforms.
This document provides supplemental information for investors regarding Monsanto Company, including forward-looking statements and selected financial highlights from 2005-2008. Key points include that Monsanto is the world's leading agriculture company focused on seeds and traits, with 2008 net sales of $11.3 billion. Financial highlights show significant growth in net income, earnings per share, EBIT, and free cash flow over the period. The document also provides a reconciliation of non-GAAP earnings per share and notes that approximately half of Monsanto's 2008 net sales came from North America.
This document provides supplemental information for investors regarding Monsanto Company, including forward-looking statements and selected financial highlights from 2005-2008. Key points include that Monsanto is the world's leading agriculture company focused on seeds and traits, with 2008 net sales of $11.3 billion, net income of $2 billion, and diluted earnings per share of $3.62. The document also provides a reconciliation of non-GAAP earnings measures and notes that over half of Monsanto's 2008 net sales came from North America.
Monsanto's corn seeds and traits generated 56% of sales and 62% of gross profit in 2008. Key corn products include DEKALB hybrid seeds and popular biotech traits such as YieldGard Corn Borer, Roundup Ready Corn 2, and YieldGard Rootworm. These traits help control pests and weeds and have seen strong adoption rates in major markets like the US, Brazil, and Argentina. Looking ahead, newer "triple stack" products that combine multiple traits are gaining traction.
Monsanto's corn seeds and traits generated 56% of sales and 62% of gross profit in 2008. Key products include DEKALB hybrid corn seed, Roundup Ready corn traits which provide herbicide tolerance, and YieldGard traits which provide insect protection. YieldGard traits have been adopted on over 100 million acres since 1997 and reduce the need for insecticide applications. Roundup Ready traits have been adopted on over 150 million acres since 1998 and simplify weed control. New triple-stack traits combine herbicide tolerance and insect protection.
This document provides supplemental information for investors regarding Monsanto Company, including forward-looking statements and key financial highlights from 2005-2008. It summarizes that Monsanto is a leading global agriculture company focused on seeds and traits, with 2008 net sales of $11.4 billion, net income of $2 billion, and diluted earnings per share of $3.62. Approximately 54% of Monsanto's 2008 net sales came from North America.
- LinkedIn reported its Q4 2012 results, with revenue of $305-310 million expected for Q1 2013 and $1.41-1.44 billion for full year 2013.
- Key metrics like member growth and engagement increased in Q4 2012 compared to previous periods.
- Revenue increased in Q4 2012 driven by growth across product lines and geographies.
- Adjusted EBITDA and net income increased in Q4 2012 both year-over-year and quarter-over-quarter.
- Bank of America reported third quarter 2006 results with total revenue of $18.961 billion, an 11% increase from third quarter 2005, and net income of $5.416 billion, a 20% increase.
- Net interest income was $8.894 billion, a 1% increase, impacted by the sale of Brazilian operations and prior year FAS 133 impact. Noninterest income increased 20% to $10.067 billion.
- Global Consumer & Small Business Banking reported net income of $2.889 billion, a 13% increase, driven by increases in cards, deposits, and debit purchase volume.
The document provides a reconciliation of non-GAAP financial measures for Pepsi Bottling Group's first quarter 2008 earnings conference call. It summarizes restructuring charges and an asset disposal charge that affected comparability between periods. It provides comparable and reported operating income growth, EPS, and guidance figures. It also defines and provides guidance for operating free cash flow.
This document summarizes Office Depot's first quarter 2009 earnings conference call. It reports that total company sales were $3.2 billion, down 19% year-over-year, and the company had a GAAP loss of $55 million but earnings of $27 million after adjusting for charges. The call also provides details on performance in North America retail, business solutions, and international segments. It outlines steps being taken under the strategic business review to improve profitability and cash flow, such as store closures. Liquidity remains strong with $806 million available and an expectation of minimal debt levels for the year.
cardinal health Q2 2007 Earnings Presentationfinance2
This document provides a summary of Cardinal Health's second quarter earnings for fiscal year 2007. It includes highlights such as revenue increasing 13% year-over-year to $21.8 billion and operating earnings growing 12% to $512 million. Each of the company's business segments saw revenue and operating earnings increases compared to the prior year quarter. The document also outlines Cardinal Health's financial targets for fiscal year 2007, including revenue growth of 8-10% and EPS growth of 12-15%.
United Stationers Inc. provided reconciliations of non-GAAP financial measures for the second quarter and first half of 2007 compared to the same periods in 2006. For the quarter, adjusted operating income was $47.1 million (4.13% of sales) compared to $41 million (3.69% of sales) in 2006, a 20% increase. For the first half, adjusted operating income was $99.4 million (4.26% of sales) compared to $79.3 million (3.51% of sales) in 2006, a 30% increase. Adjustments excluded one-time items to provide a better comparison of ongoing operating results.
Baldor Electric Company announced its first quarter 2009 results, with sales of $402.5 million, down 14% from the previous year. Net income was $14.8 million, excluding a one-time gain, down 42% from the previous year. The company is on track to exceed its goal of reducing costs by $80 million in 2009. Baldor expects second quarter 2009 to be the most challenging with sales forecast to be down 15-20% compared to a strong second quarter in 2008, but anticipates benefits in the second half of the year from cost reductions and new product introductions.
- Comcast reported its 3rd quarter 2008 results with consolidated revenue increasing 7% year-over-year to $8.55 billion and operating cash flow growing 8% to $3.24 billion.
- Video, high-speed internet, and phone revenues all increased compared to the prior year while advertising revenues declined 10% due to deteriorating advertising trends.
- The company maintained a disciplined approach to capital expenditures, which increased 7% year-over-year to $1.31 billion for the quarter.
What is Social Media Optimization and Marketing Tips.
SEO, SMO, Internet marketing, Digital marketing, Google, Facebook, Twitter, Social Media Marketing, Social media, Social Media Strategy, Search engine optimization, Search Engines,
Instagram has become a popular platform for various groups to connect with audiences. The media uses Instagram to share news stories and behind the scenes photos. Brands leverage Instagram visually showcase their products and services to potential customers. Nonprofit organizations utilize Instagram to raise awareness for their causes and attract donors and volunteers. Celebrities and public figures have huge followings on Instagram where they share aspects of their personal and professional lives. Communities of Instagram users have formed around common interests, locations or types of photos shared. Various apps and books exist to enhance the Instagram experience or archive Instagram photos for later viewing on the web.
Kamaldeep Singh is seeking a challenging job in a reputed organization to utilize his SEM/SEO, internet marketing, analytical, and software skills, especially in the field of SEM/SEO. He has over 2 years of experience as an SEO Team Leader at Gravity Informatics Pvt Ltd where he was responsible for all SEO activities and projects. He also has 6 months of experience as a BackOffice Executive at Videocon Mobile Service where he activated new SIMs and collected daily collections.
Kamaldeep Singh is seeking a challenging job in a reputed organization to utilize his SEM/SEO, internet marketing, analytical, and software skills, especially in the field of SEM/SEO. He has over 2 years of experience as an SEO Team Leader at Gravity Informatics Pvt Ltd where he was responsible for SEO activities and projects. He also has 6 months of experience as a BackOffice Executive at Videocon Mobile Service where he activated new SIMs and collected daily collections.
- Google reported consolidated revenues of $14.4 billion for Q4 2012, up 36% year-over-year and 8% quarter-over-quarter. Including Motorola Home, revenues were $15.2 billion.
- Google properties revenues increased 18% year-over-year and 12% quarter-over-quarter. Network revenues increased 19% year-over-year and 10% quarter-over-quarter.
- Income from operations on a non-GAAP basis was $4.3 billion, with an operating margin of 30%.
केरल उच्च न्यायालय ने 11 जून, 2024 को मंडला पूजा में भाग लेने की अनुमति मांगने वाली 10 वर्षीय लड़की की रिट याचिका को खारिज कर दिया, जिसमें सर्वोच्च न्यायालय की एक बड़ी पीठ के समक्ष इस मुद्दे की लंबित प्रकृति पर जोर दिया गया। यह आदेश न्यायमूर्ति अनिल के. नरेंद्रन और न्यायमूर्ति हरिशंकर वी. मेनन की खंडपीठ द्वारा पारित किया गया
13062024_First India Newspaper Jaipur.pdfFIRST INDIA
Find Latest India News and Breaking News these days from India on Politics, Business, Entertainment, Technology, Sports, Lifestyle and Coronavirus News in India and the world over that you can't miss. For real time update Visit our social media handle. Read First India NewsPaper in your morning replace. Visit First India.
CLICK:- https://firstindia.co.in/
#First_India_NewsPaper
Youngest c m in India- Pema Khandu BiographyVoterMood
Pema Khandu, born on August 21, 1979, is an Indian politician and the Chief Minister of Arunachal Pradesh. He is the son of former Chief Minister of Arunachal Pradesh, Dorjee Khandu. Pema Khandu assumed office as the Chief Minister in July 2016, making him one of the youngest Chief Ministers in India at that time.
Essential Tools for Modern PR Business .pptxPragencyuk
Discover the essential tools and strategies for modern PR business success. Learn how to craft compelling news releases, leverage press release sites and news wires, stay updated with PR news, and integrate effective PR practices to enhance your brand's visibility and credibility. Elevate your PR efforts with our comprehensive guide.
2. This presentation contains forward-looking statements concerning Yahoo!’s expected financial performance and Yahoo!’s strategic and operational plans. Risks and uncertainties
may cause actual results to differ materially from the results predicted, and reported results should not be considered as an indication of future performance. The potential risks
and uncertainties include, among others, the impact of changes to our management, organizational structure and strategic business plan; Yahoo!'s ability to compete with new or
existing competitors; reduction in spending by, or loss of, advertising customers; risks associated with the Search and Advertising Services and Sales Agreement (the “Search
Agreement”) between Yahoo! and Microsoft Corporation (“Microsoft”); risks related to Yahoo!’s regulatory environment; interruptions or delays in the provision of Yahoo!’s services;
security breaches; acceptance by users of new products and services; risks related to joint ventures and the integration of acquisitions; risks related to Yahoo!'s international
operations; adverse results in litigation; Yahoo!'s ability to protect its intellectual property and the value of its brands; dependence on third parties for technology, services, content,
and distribution; and general economic conditions. All information in this presentation is as of January 28, 2013. Yahoo! does not intend, and undertakes no duty, to update this
information to reflect subsequent events or circumstances; however, Yahoo! may update its business outlook, or any portion thereof, at any time in its discretion. More information
about potential risk factors that could affect Yahoo!’s business and financial results is included in Yahoo!’s filings with the Securities and Exchange Commission (“SEC”) including
its Quarterly Report on Form 10-Q for the quarter ended September 30, 2012, which is available on the SEC’s web site at www.sec.gov.
Throughout this presentation, we have rounded numbers as appropriate. In this presentation, “year-over-year” (or YOY) refers to the change from the corresponding period in the
prior fiscal year to the specified period in the specified year; and “quarter-over-quarter” (or QOQ) refers to the change from the immediately preceding fiscal quarter to the specified
quarter.
We periodically review and refine our methodologies for monitoring, gathering, and counting paid clicks and sold impressions. Based on this process, from time to time we may
update such methodologies.
Yahoo! and the Yahoo! logos are trademarks and/or registered trademarks of Yahoo! Inc. All other names are trademarks and/or registered trademarks of their respective owners.
2
3. Definitions and Non-GAAP Financial Measures
This presentation includes the following non-GAAP financial measures:
- Revenue ex-TAC is defined as GAAP Revenue less Traffic acquisition costs (TAC). TAC consists of payments to Affiliates and payments made to companies that direct
consumer and business traffic to Yahoo! Properties.
- Display revenue ex-TAC is defined as GAAP Display revenue less Display TAC. Search revenue ex-TAC is defined as GAAP Search revenue less Search TAC. Other
revenue ex-TAC is defined as GAAP Other revenue less Other TAC.
- Total operating expenses less TAC is defined as GAAP Total operating expenses excluding TAC.
- Non-GAAP Total operating expenses is defined as GAAP Total operating expenses excluding TAC and certain other expenses that we do not believe are indicative of our
ongoing operating expenses.
- Free cash flow is defined as Net cash provided by (used in) operating activities (adjusted to include Excess tax benefits from stock-based awards), less Acquisition of property
and equipment, net and Dividends received from equity investees.
- Adjusted EBITDA is defined as net income attributable to Yahoo! Inc. before taxes, depreciation, amortization of intangible assets, stock-based compensation expense, other
income, net (which includes interest), earnings in equity interests, net income attributable to noncontrolling interests and other gains, losses, and expenses that we do not believe
are indicative of our ongoing results.
- Non-GAAP Operating income is defined as Operating income excluding certain gains, losses, and expenses that we do not believe are indicative of our ongoing operating
results.
- Non-GAAP Net earnings is defined as Net income attributable to Yahoo! Inc. excluding certain gains, losses, expenses, and their related tax effects that we do not believe are
indicative of our ongoing results.
Please refer to the Appendix for reconciliations of these non-GAAP financial measures to the GAAP financial measures the Company considers most comparable.
In addition, certain margin information is presented on a non-GAAP basis:
- Operating margin ex-TAC is calculated as Operating income divided by Revenue ex-TAC; and
- Non-GAAP Operating margin ex-TAC is calculated as Non-GAAP operating income divided by Revenue ex-TAC.
- Net margin ex-TAC is calculated as Net income attributable to Yahoo! Inc. divided by Revenue ex-TAC.
Please refer to the Appendix for presentations of the most comparable margins calculated on a GAAP basis.
Please refer to the Company’s earnings release for definitions of other terms appearing in this presentation, and for more information regarding the Company’s non-GAAP financial
measures.
3
4. Key Takeaways From Q4’12
Revenue ex-TAC of $1,221 million grew 4% in the quarter on a YOY
basis.
Search revenue ex-TAC of $427 million increased 14% in the quarter
on a YOY basis.
Adjusted EBITDA of $509 million increased 8% in the quarter on a
YOY basis.
Non-GAAP Operating Income of $283 million increased 9% in the
quarter on a YOY basis.
We repurchased 79.6 million shares of stock at an average price of
$18.24 for $1.45 billion in the fourth quarter.
4
5. Financials and Key Metrics at a Glance
$ in millions, except per share amounts Q4’11 Q4’12 YOY
GAAP Revenue $1,324 $1,346 2%
Revenue ex-TAC $1,169 $1,221 4%
Adjusted EBITDA $469 $509 8%
Operating income $242 $190 (22%)
Operating margin ex-TAC 21% 16% (500bps)
Non-GAAP Operating income $259 $283 9%
Non-GAAP Operating margin ex-TAC 22% 23% 100bps
Net income attributable to Yahoo! Inc. $296 $272 (8%)
Net margin ex-TAC 25% 22% (300bps)
EPS attributable to Yahoo! Inc. – diluted $0.24 $0.23 (2%)
Non-GAAP EPS – diluted $0.25 $0.32 28%
Shares used in per share calculation – diluted 1,241 1,168 (6%)
Acquisition of property and equipment, net $130 $150 15%
Free cash flow, as adjusted(1) $327 $221 (32%)
Cash & marketable debt securities $2,530 $6,022 N/M
Ending employees 14,100 11,500 (18%)
N/M – Not meaningful
(1) See slide 27 for the reconciliation of Free cash flow and adjustments.
5
6. Financials and Key Metrics at a Glance
$ in millions, except per share amounts 2011 2012 YOY
GAAP Revenue $4,984 $4,987 0%
Revenue ex-TAC $4,381 $4,468 2%
Adjusted EBITDA $1,655 $1,699 3%
Operating income $800 $566 (29%)
Operating margin ex-TAC 18% 13% (500bps)
Non-GAAP Operating income $825 $825 0%
Non-GAAP Operating margin ex-TAC 19% 18% (100bps)
Net income attributable to Yahoo! Inc. $1,049 $3,945 N/M
Net margin ex-TAC 24% 88% N/M
EPS attributable to Yahoo! Inc. – diluted $0.82 $3.28 N/M
Non-GAAP EPS – diluted $0.81 $1.17 44%
Shares used in per share calculation – diluted 1,282 1,203 (6%)
Acquisition of property and equipment, net $593 $506 (15%)
Free cash flow, as adjusted(1) $726 $1,431 97%
N/M – Not meaningful
(1) See slide 27 for the reconciliation of Free cash flow and adjustments.
6
7. Search and Display Metrics
YOY % Growth Q1’11 Q2’11 Q3’11 Q4’11 Q1’12 Q2’12 Q3’12 Q4’12
Global Search(1) (2)
Number of Paid Clicks(3) (27%) (28%) (26%) (18%) 2% 6% 9% 11%
Price-Per-Click (“PPC”)(4) 10% 9% 5% 0% 3% (1%) 1% 1%
Global Display(1) (5)
Number of Ads Sold(6) 7% 1% (1%) (6%) (18%) (11%) (11%) (10%)
Price-Per-Ad(7) 11% 4% (3%) 0% 13% 14% 12% 7%
Global Search Trends Global Display Trends
15% 11% 20%
10% 9% 9%
10% 13% 14%
5% 6% 15% 12%
11%
5% 2% 3% 1% 1% 10%
0% 7% 7%
0% 1% 4%
5%
Q1'11 Q2'11 Q3'11 Q4'11 Q1'12 Q2'12 Q3'12 Q4'12 0%
-5%
-1% 0%
-10% Q1'11 Q2'11 Q3'11 Q4'11 Q1'12 Q2'12 Q3'12 Q4'12
-5%
-15% -1% -3%
-10% -6%
-20% -18%
-11% -11% -10%
-25% -15%
-30% -27% -26% -20%
-28% -18%
Number of Paid Clicks Price-Per-Click Number of Ads Sold Price-Per-Ad
(1) Source: Internal data, excluding China and Japan (where Yahoo!-branded sites are operated by third-party licensees).
(2) Search metrics include data from owned and operated search, Affiliate search, display PPC (display ads sold on a price-per-click basis), and content match (contextually relevant links to
advertisers’ Websites, generally sold on a price-per-click basis).
(3) “Paid clicks” are clicks by end users on sponsored listings on Yahoo! Properties and Affiliate sites that are sold on a price-per-click basis.
(4) PPC is calculated as gross search revenue (before TAC), inclusive of the Microsoft RPS guarantee, divided by the number of Paid Clicks.
(5) Display metrics include data for graphical units on core Yahoo! Properties (including mobile) sold by Yahoo! and partners such as the Newspaper Consortium. Limited to data from the U.S., U.K.,
Italy, France, Germany, Spain, and the Asia Pacific region (excluding Australia and New Zealand, where Yahoo!-branded sites are operated by a joint venture).
(6) Ads Sold consists of non-PPC ads displayed on Yahoo! Properties in the countries identified in footnote (5) for paying advertisers.
(7) Price-Per-Ad is calculated as display revenue from the countries identified in footnote (5) divided by the number of Ads Sold.
7
9. Revenue ex-TAC by Geography & Source
$ in millions Geography Source
APAC
$217 Other
$273
EMEA Display
$97 $520
Q4’12 = $1,221 Americas
$908
Search
$427
APAC Other
$219 $248
Q4’11 = $1,169
EMEA
$110 Americas Display
$840 $546
Search
$376
9
10. Revenue ex-TAC by Source
$ in millions Q1’11 Q2’11 Q3’11 Q4’11 Q1’12 Q2’12 Q3’12 Q4’12
Display revenue ex-TAC $471 $467 $449 $546 $454 $473 $452 $520
YOY Growth 10% (1) 5% 0% (4%) (4%) 1% 0% (5%)
Search revenue ex-TAC $357 $371 $374 $376 $384 $385 $414 $427
YOY Growth (19%) (2) (15%) (2) (13%) (2) (3%) (2) 8% 4% 11% 14%
Other revenue ex-TAC $237 $239 $248 $248 $240 $222 $223 $273
YOY Growth (10%) (3%) 0% (1%) 1% (7%) (10%) 10%
Total revenue ex-TAC $1,064 $1,076 $1,072 $1,169 $1,077 $1,081 $1,089 $1,221
YOY Growth (6%) (1)(2) (5%) (2) (5%) (2) (3%) (2) 1% 0% 2% 4%
(1) YOY Growth in Display revenue ex-TAC and Total revenue ex-TAC were negatively impacted by a one-time benefit in Q1’10 from transitioning some large customers from cash-basis
accounting to accrual accounting.
(2) YOY Growth in Search revenue ex-TAC and Total revenue ex-TAC were negatively impacted by headwinds in Q4’11 of $6M and $18M, in Q3’11 of $37M and $58M, in Q2’11 of $37M
and $61M, and in Q1’11 of $36M and $63M, respectively.
10
11. Geographic Segment Data
$ in millions Q4’11 Q4’12 YOY
Americas
Revenue ex-TAC $840 $908 8%
Direct costs(1) (187) (183) (2%)
Contribution $653 $725 11%
Americas contribution margin(2) 78% 80% 200bps
EMEA
Revenue ex-TAC $110 $97 (12%)
Direct costs(1) (42) (41) (1%)
Contribution $68 $55 (19%)
EMEA contribution margin(2) 62% 57% (500bps)
Asia Pacific
Revenue ex-TAC $219 $217 (1%)
Direct costs(1) (55) (60) 8%
Contribution $164 $156 (5%)
Asia Pacific contribution margin(2) 75% 72% (300bps)
(1) Direct costs for each segment include cost of revenue (excluding TAC) and other operating expenses that are directly attributable to the segment. Beginning in 2012, marketing and
customer advocacy costs are managed locally and included as direct costs for each segment. Prior period amounts have been revised to conform to the current presentation.
(2) Contribution margin is calculated as Contribution divided by Revenue ex-TAC for each segment.
11
12. Total Operating Expenses less TAC
Depreciation, Amortization, and Stock-based compensation
$1,026 (1) $1,031 (3)
$926 $908 $937 (2)
$885 $894
$875
$ in millions
Q1'11 Q2'11 Q3'11 Q4'11 Q1'12 Q2'12 Q3'12 Q4'12
(1) Total Operating expenses less TAC in Q2’12 was negatively impacted by a total of $136 million of restructuring charges and deal-related expenses.
(2) Total Operating expenses less TAC in Q3’12 was negatively impacted by a total of $25 million of restructuring charges.
(3) Total Operating expenses less TAC in Q4’12 was negatively impacted by $99 million of costs related to the Korea business (including restructuring charges of $83 million related
to the closure of the Korea business) partially offset by $7 million in net reversals of prior restructuring charges.
12
13. Non-GAAP Total Operating Expenses
Depreciation, Amortization, and Stock-based compensation
$938
$897 $910 $902 $912
$885 $890
$864
$ in millions
Q1'11 Q2'11 Q3'11 Q4'11 Q1'12 Q2'12 Q3'12 Q4'12
13
15. GAAP Operating Income
$242
$190 $191
$190(3)
$177
$169
$ in millions
$152(2)
$55(1)
Q1'11 Q2'11 Q3'11 Q4'11 Q1'12 Q2'12 Q3'12 Q4'12
Op. margin
ex-TAC : 18% 18% 17% 21% 16% 5% 14% 16%
(1) Operating income in Q2’12 was negatively impacted by a total of $136 million of restructuring charges and deal-related expenses. Please see slide 24.
(2) Operating income in Q3’12 was negatively impacted by a total of $25 million of restructuring charges. Please see slide 24.
(3) Operating income in Q4’12 was negatively impacted by a total of $99 million of costs related to the Korea business (including restructuring charges of $83 million related to the
closure of the Korea business), partially offset by $7 million in net reversals of prior restructuring charges. Please see slide 24.
15
17. Key Balance Sheet Metrics
$ in millions Q1’11 Q2’11 Q3’11 Q4’11 Q1’12 Q2’12 Q3’12 Q4’12
Assets
Cash & marketable debt
$3,528 $3,255 $2,870 $2,530 $2,652 $2,401 $9,427(1) $6,022
securities
Accounts receivable, net $933 $957 $873 $1,037 $942 $1,041 $954 $1,008
Alibaba Group preference
– – – – – – $803 $816
shares
Property and equipment, net $1,695 $1,741 $1,726 $1,731 $1,727 $1,664 $1,671 $1,686
Total assets $14,928 $14,807 $14,528 $14,783 $14,963 $14,658 $20,414 $17,103
Liabilities and Equity
Current deferred revenue $247 $240 $206 $195 $179 $177 $309 $297
Total current liabilities $1,340 $1,242 $1,202 $1,207 $1,070 $1,077 $3,506 $1,290
Total equity $12,865 $12,799 $12,505 $12,581 $12,860 $12,516 $15,606 $14,606
Total liabilities and equity $14,928 $14,807 $14,528 $14,783 $14,963 $14,658 $20,414 $17,103
Market value of 35%
ownership in Yahoo Japan $6,570
(at 12/31/12) (2)
Value of approximately 24%
ownership in Alibaba based $8,100
on recent transaction (3)
(1) In Q3’12, Cash & marketable debt securities was positively impacted by Yahoo!’s receipt of proceeds from the sale of Alibaba shares.
(2) Pre-tax market value is based on public market share price for Yahoo Japan on December 31, 2012.
(3) Pre-tax value is based on $15.50 price per share at which Alibaba sold common equity to third-party purchasers in its most recent round of common equity funding (September
2012); does not include $816 million in Alibaba Group preference shares held by Yahoo!.
17
18. Key Cash Flow Highlights
$ in millions Q1’11 Q2’11 Q3’11 Q4’11 Q1’12 Q2’12 Q3’12 Q4’12
Tax payment on sale of
- - - - - - - ($2,266)
Alibaba shares
Share repurchases $137 $472 $593 $416 $71 $456 $190 ($1,451)
Net cash provided by (used
in) operating activities, as $206 $331 $356 $431 $297 $275 $496(1) $366(2)
adjusted
Acquisition of property and
$168 $172 $124 $130 $110 $106 $140 $150
equipment, net
Free cash flow, as
$56 $96 $247 $327 $196 $93 $920 $221
adjusted(3)
(1) Including a payment of $550 million from Alibaba in satisfaction of certain future royalty payments under the existing technology and intellectual property license agreement with
Alibaba, GAAP Net cash provided by operating activities for Q3’12 was $1,046 million.
(2) Including a cash tax payment of $2.3 billion related to the sale of Alibaba shares, GAAP Net cash provided by (used in) operating activities for Q4’12 was ($1,900) million.
(3) See slide 27 for the reconciliation of Free cash flow and adjustments.
18
19. Business Outlook
Q1’13 2013
$ in millions
Current Outlook Current Outlook
Revenue ex-TAC $1,070 - $1,100 $4,500 - $4,600
Adjusted EBITDA $340 - $360 $1,600 - $1,700
GAAP Income from operations $155 - $175 $810 - $850
Note: The above business outlook is based on information and expectations as of January 28, 2013. Yahoo! does not intend, and undertakes no duty, to update this business outlook to
reflect subsequent events or circumstances; however, Yahoo! may update this business outlook or any portion thereof at any time at its discretion.
19
23. Table 3 – Revenue and Direct Costs by Segment
$ in millions Q4’11 Q4’12
Revenue by segment:
Americas $885 $960
EMEA 164 114
Asia Pacific 275 272
Total revenue 1,324 1,346
TAC (155) (125)
Total revenue ex-TAC $1,169 $1,221
Direct costs by segment:
Americas $187 $183
EMEA 42 41
Asia Pacific 55 60
Global operating costs(1) 411 443
Restructuring charges, net 16 76
Depreciation and amortization 152 169
Stock-based compensation expense 59 58
Income from operations $242 $190
(1) Global operating costs include product development, service engineering and operations, general and administrative, and other corporate expenses that are managed on a global
basis and that are not directly attributable to any particular segment. Prior to 2012, marketing and customer advocacy costs were managed on a global basis and included as
global operating costs. Prior period amounts have been revised to conform to the current presentation.
23
24. Table 4 – Total Operating Expenses
Reconciliations of GAAP Total Operating Expenses to Total Operating
Expenses less TAC and to Non-GAAP Total Operating Expenses
$ in millions Q1’11 Q2’11 Q3’11 Q4’11 Q1’12 Q2’12 Q3’12 Q4’12
Total operating expenses
less TAC and Non-GAAP
total operating
expenses:
GAAP Total operating
$1,025 $1,038 $1,039 $1,082 $1,052 $1,163 $1,050 $1,156
expenses
Less: Traffic acquisition
(150) (153) (145) (155) (144) (137) (113) (125)
costs
Total operating expenses
$875 $885 $894 $926 $908 $1,026 $937 $1,031
less TAC
Less: Restructuring
11 - (3) 16 6 129 25 (7)
Charges(1)
Less: Deal-related
– – – – – 7 – –
expenses(2)
Less: Costs associated
with the Korea business – – – – – – – 99
and its closure
Non-GAAP Total
$864 $885 $897 $910 $902 $890 $912 $938
operating expenses
(1) For Q4’12012, this amount excludes the restructuring charges related to the closure of the Korea business of $83 million, which are included in the line “Costs associated with the Korea
business and its closure.”
(2) Deal-related expenses relate to, among other matters, the agreement Yahoo! entered into with Alibaba regarding Yahoo!’s stake in Alibaba.
24
25. Table 5 – Adjusted EBITDA Calculation
Reconciliation of GAAP Net Income Attributable to Yahoo! Inc. to
Adjusted EBITDA
Quarterly Data Yearly Data
$ in thousands Q1’11 Q2’11 Q3’11 Q4’11 Q1’12 Q2’12 Q3’12 Q4’12 2011 2012
GAAP Net income attributable to Yahoo!
$222,992 $236,972 $293,291 $295,572 $286,343 $226,631 $3,160,238 $272,267 $1,048,827 $3,945,479
Inc.
(a) Depreciation and amortization 160,438 161,373 152,223 151,830 153,248 157,739 169,511 168,769 625,864 649,267
(b) Stock based compensation expense 35,116 59,048 50,947 58,847 55,966 49,571 61,366 57,574 203,958 224,477
(c) Restructuring charges, net 10,575 237 (2,721) 16,329 5,717 129,092 24,727 (6,794)(1) 24,420 152,742(1)
(d) Other income, net(2) (5,027) 5,666 (18,046) (9,768) (2,278) (20,175) (4,607,656) (17,730) (27,175) (4,647,839)
(e) Provision for income taxes 52,120 55,629 55,731 78,287 56,419 26,523 1,774,094 83,007 241,767 1,940,043
(f) Earnings in equity interest (82,180) (108,902) (158,775) (127,063) (172,243) (179,991) (175,265) (148,939) (476,920) (676,438)
(g) Net income attributable to
1,840 1,530 5,053 5,419 1,135 1,825 778 1,385 13,842 5,123
noncontrolling interests
(h) Deal-related expenses(3) - - - - - 6,500 - - - 6,500
(i) Costs associated with the Korea
- - - - - - - 99,485 - 99,485
business and its closure
Adjusted EBITDA $395,874 $411,553 $377,703 $469,453 $384,307 $398,715 $407,793 $509,024 $1,654,583 $1,698,839
(1) For Q4’12 and Full Year 2012, this amount excludes the restructuring charges related to the closure of the Korea business of $83 million, which are included in item (i).
(2) Q3’12 and Full Year 2012 include a $4.6 billion gain on the sale of Alibaba shares.
(3) Deal-related expenses relate to, among other matters, the agreement Yahoo! entered into with Alibaba regarding Yahoo!’s stake in Alibaba.
25
26. Table 6 – Non-GAAP Operating Income Calculation
Reconciliation of GAAP Operating Income to Non-GAAP Operating
Income
Quarterly Data Yearly Data
$ in thousands Q1’11 Q2’11 Q3’11 Q4’11 Q1’12 Q2’12 Q3’12 Q4’12 2010 2011 2012
GAAP Operating
$189,745 $190,895 $177,254 $242,447 $169,376 $54,813 $152,189 $189,990 $772,524 $800,341 $566,368
income
(a) Reimbursements
from Microsoft for
– – – – – – – – (43,300) – –
transition costs incurred
in prior periods(1)
(b) Restructuring
10,575 237 (2,721) 16,329 5,717 129,092 24,727 (6,794) (2) 57,957 24,420 152,742(2)
charges, net
(c) Deal-related
– – – – – 6,500 – – – – 6,500
expenses(3)
(d) Costs associated
with the Korea – – – – – – – – –
99,485 99,485
business and its
closure
Non-GAAP Operating
$200,320 $191,132 $174,533 $258,776 $175,093 $190,405 $176,916 $282,681 $787,181 $824,761 $825,095
income
GAAP Operating
16% 16% 15% 18% 14% 5% 13% 14% 12% 16% 12%
margin
Non-GAAP Operating
16% 16% 14% 20% 14% 16% 15% 21% 12% 17% 17%
margin(4)
Non-GAAP Operating
19% 18% 16% 22% 16% 18% 16% 23% 17% 19% 18%
margin ex-TAC
(1) Non-GAAP Operating income excludes reimbursements for costs incurred in prior periods. The net reimbursement adjustment of $43 million in Q1'10 is equal to the transition costs of
$11 million and $32 million incurred in Q3’09 and Q4’09, respectively, in connection with the Search Agreement.
(2) For Q4’12 and Full Year 2012, this amount excludes the restructuring charges related to the closure of the Korea business of $83 million, which are included in item (d).
(3) Deal-related expenses relate to, among other matters, the agreement Yahoo! entered into with Alibaba regarding Yahoo!’s stake in Alibaba.
(4) Non-GAAP Operating margin is calculated as Non-GAAP Operating income divided by GAAP Revenue.
26
27. Table 7 – Free Cash Flow Calculation
Reconciliation of GAAP Cash Flow from Operating Activities to
Free Cash Flow and to Free Cash Flow, as adjusted
Quarterly Data Yearly Data
$ in millions Q1’11 Q2’11 Q3’11 Q4’11 Q1’12 Q2’12 Q3’12 Q4’12 2011 2012
Free cash flow:
Net cash provided by
(used in) operating $206 $331 $356 $431 $297 $275 $1,046 ($1,900) $1,324 ($282)
activities
Excess tax benefits from
18 12 14 26 8 9 14 5 71 36
stock-based awards
Acquisition of property &
(168) (172) (124) (130) (110) (106) (140) (150) (593) (506)
equipment, net
Dividends received from
– (75) – – – (84) – – (75) (84)
equity investees
Free cash flow(1) $56 $96 $247 $327 $196 $93 $920(1) ($2,045) $726 ($835)
Tax payment on sale of
– – – – – – – 2,266 – 2,266
Alibaba shares(2)
Free cash flow, as
$56 $96 $247 $327 $196 $93 $920 $221 $726 $1,431
adjusted
(1) Free cash flow was positively impacted in Q3'12 by a cash payment of $550 million from Alibaba in satisfaction of certain future royalty payments under the existing technology
and intellectual property license agreement with Alibaba.
(2) Cash tax payment of $2.3 billion related to the sale of Alibaba shares.
27
28. Table 8 – Non-GAAP Net Earnings Per Share Calculation
Reconciliation of GAAP Net Earnings Attributable to Yahoo! Inc. and GAAP Net
Income Attributable to Yahoo! Inc. Common Stockholders Per Share – Diluted
to Non-GAAP Net Earnings and Non-GAAP Net Earnings Per Share – Diluted
Quarterly Data Yearly Data
$ in millions, except per share
Q1’11 Q2’11 Q3’11 Q4’11 Q1’12 Q2’12 Q3’12 Q4’12 2011 2012
amounts
GAAP Net income attributable to $223 $237 $293 $296 $286 $227 $3,160 $272 $1,049 $3,945
Yahoo! Inc.
Adjustments 7 0 (27) 11 4 100 (2,740) 97 (8) (2,539)
Non-GAAP Net earnings $230 $237 $266 $307 $290 $327 $421 $370 $1,040 $1,407
GAAP Revenue $1,214 $1,229 $1,217 $1,324 $1,221 $1,218 $1,202 $1,346 $4,984 $4,987
GAAP Net margin 18% 19% 24% 22% 23% 19% NM 20% 21% NM
Non-GAAP Net margin(1) 19% 19% 22% 23% 24% 27% 35% 27% 21% 28%
GAAP Net income attributable to
Yahoo! Inc. common Stockholders $0.17 $0.18 $0.23 $0.24 $0.23 $0.18 $2.64 $0.23 $0.82 $3.28
per share – diluted
Non-GAAP Net earnings per
$0.17 $0.18 $0.21 $0.25 $0.24 $0.27 $0.35 $0.32 $0.81 $1.17
share – diluted
Diluted shares outstanding 1,320 1,308 1,260 1,241 1,226 1,222 1,195 1,168 1,282 1,203
(1) Non-GAAP Net margin is calculated as Non-GAAP Net income divided by GAAP Revenue.
Note: All per share amounts are based on fully diluted share counts. Please refer to Appendix Table 9 for details on Adjustments.
28
29. Table 9 - Non-GAAP Net Earnings Calculation
Reconciliation of GAAP Net Income Attributable to Yahoo! Inc. to
Non-GAAP Net Earnings, with Details on Adjustments
Quarterly Data Yearly Data
$ in thousands Q1’11 Q2’11 Q3’11 Q4’11 Q1’12 Q2’12 Q3’12 Q4’12 2011 2012
GAAP Net income attributable to Yahoo!
$222,992 $236,972 $293,291 $295,572 $286,343 $226,631 $3,160,238 $272,267 $1,408,827 $3,945,479
Inc.
(a) Restructuring charges, net 10,575 237 (2,721) 16,329 5,717 129,092 24,727 (6,794) (2) 24,420 152,742(2)
(b) Non-cash gain related to the dilution of
the Company's ownership interest in Alibaba
– – (25,083) – – – – – (25,083) –
Group, which is included in earnings in
equity interests
(c) Deal-related expenses(1) – – – – – 6,500 – – – 6,500
(d) Gain related to sale of Alibaba shares – – – – – – (4,603,322) – – (4,603,322)
(e) Costs associated with the Korea
– – – – – – – 99,485 – 99,485
business and its closure
(f) To adjust the provision for income taxes
to exclude the tax impact of items (a), (c), (3,362) (75) 865 (5,192) (2,047) (35,674) 1,839,035 4,626 (7,764) 1,805,940
(d) and (e)
Non-GAAP Net earnings $230,205 $237,134 $266,352 $306,709 $290,013 $326,549 $420,678 $369,584 $1,040,400 $1,406,824
(1) Deal-related expenses relate to, among other matters, the agreement Yahoo! entered into with Alibaba regarding Yahoo!’s stake in Alibaba.
(2) For Q4’12 and Full Year 2012, this amount excludes the restructuring charges related to the closure of the Korea business of $83 million, which are included in item (e).
29
30. Table 10 – Business Outlook Reconciliations
Q1’13
$ in millions FY 2013 Current Outlook
Current Outlook
Revenue ex-TAC:
GAAP Revenue $1,130 - $1,180 $4,750 - $4,880
Less: TAC $60 - $80 $250 - $280
Revenue ex-TAC $1,070 - $1,100 $4,500 - $4,600
Adjusted EBITDA(1)
Depreciation & Amortization $140 - $160 $600 - $630
Stock-Based Compensation $30 - $50 $240 - $270
(1) Yahoo! has not reconciled its Adjusted EBITDA outlook to the comparable forward-looking GAAP financial measure, Net income attributable to Yahoo! Inc., because it is unable to
provide a forward-looking estimate of certain reconciling items between Net income attributable to Yahoo! Inc. and Adjusted EBITDA, including: other income, net; provision for income
taxes; and earnings in equity interests. Certain factors that are materially significant to Yahoo!’s ability to estimate these items are out of the Company’s control and/or cannot be reasonably
predicted. Accordingly, a reconciliation to Net income attributable to Yahoo! Inc. is not available without unreasonable effort.
Note: The above business outlook is based on information and expectations as of January 28, 2013. Yahoo! does not intend, and undertakes no duty, to update the business outlook to
reflect subsequent events or circumstances; however, Yahoo! may update the business outlook or any portion thereof at any time at its discretion.
30