SlideShare a Scribd company logo
1 of 39
Download to read offline
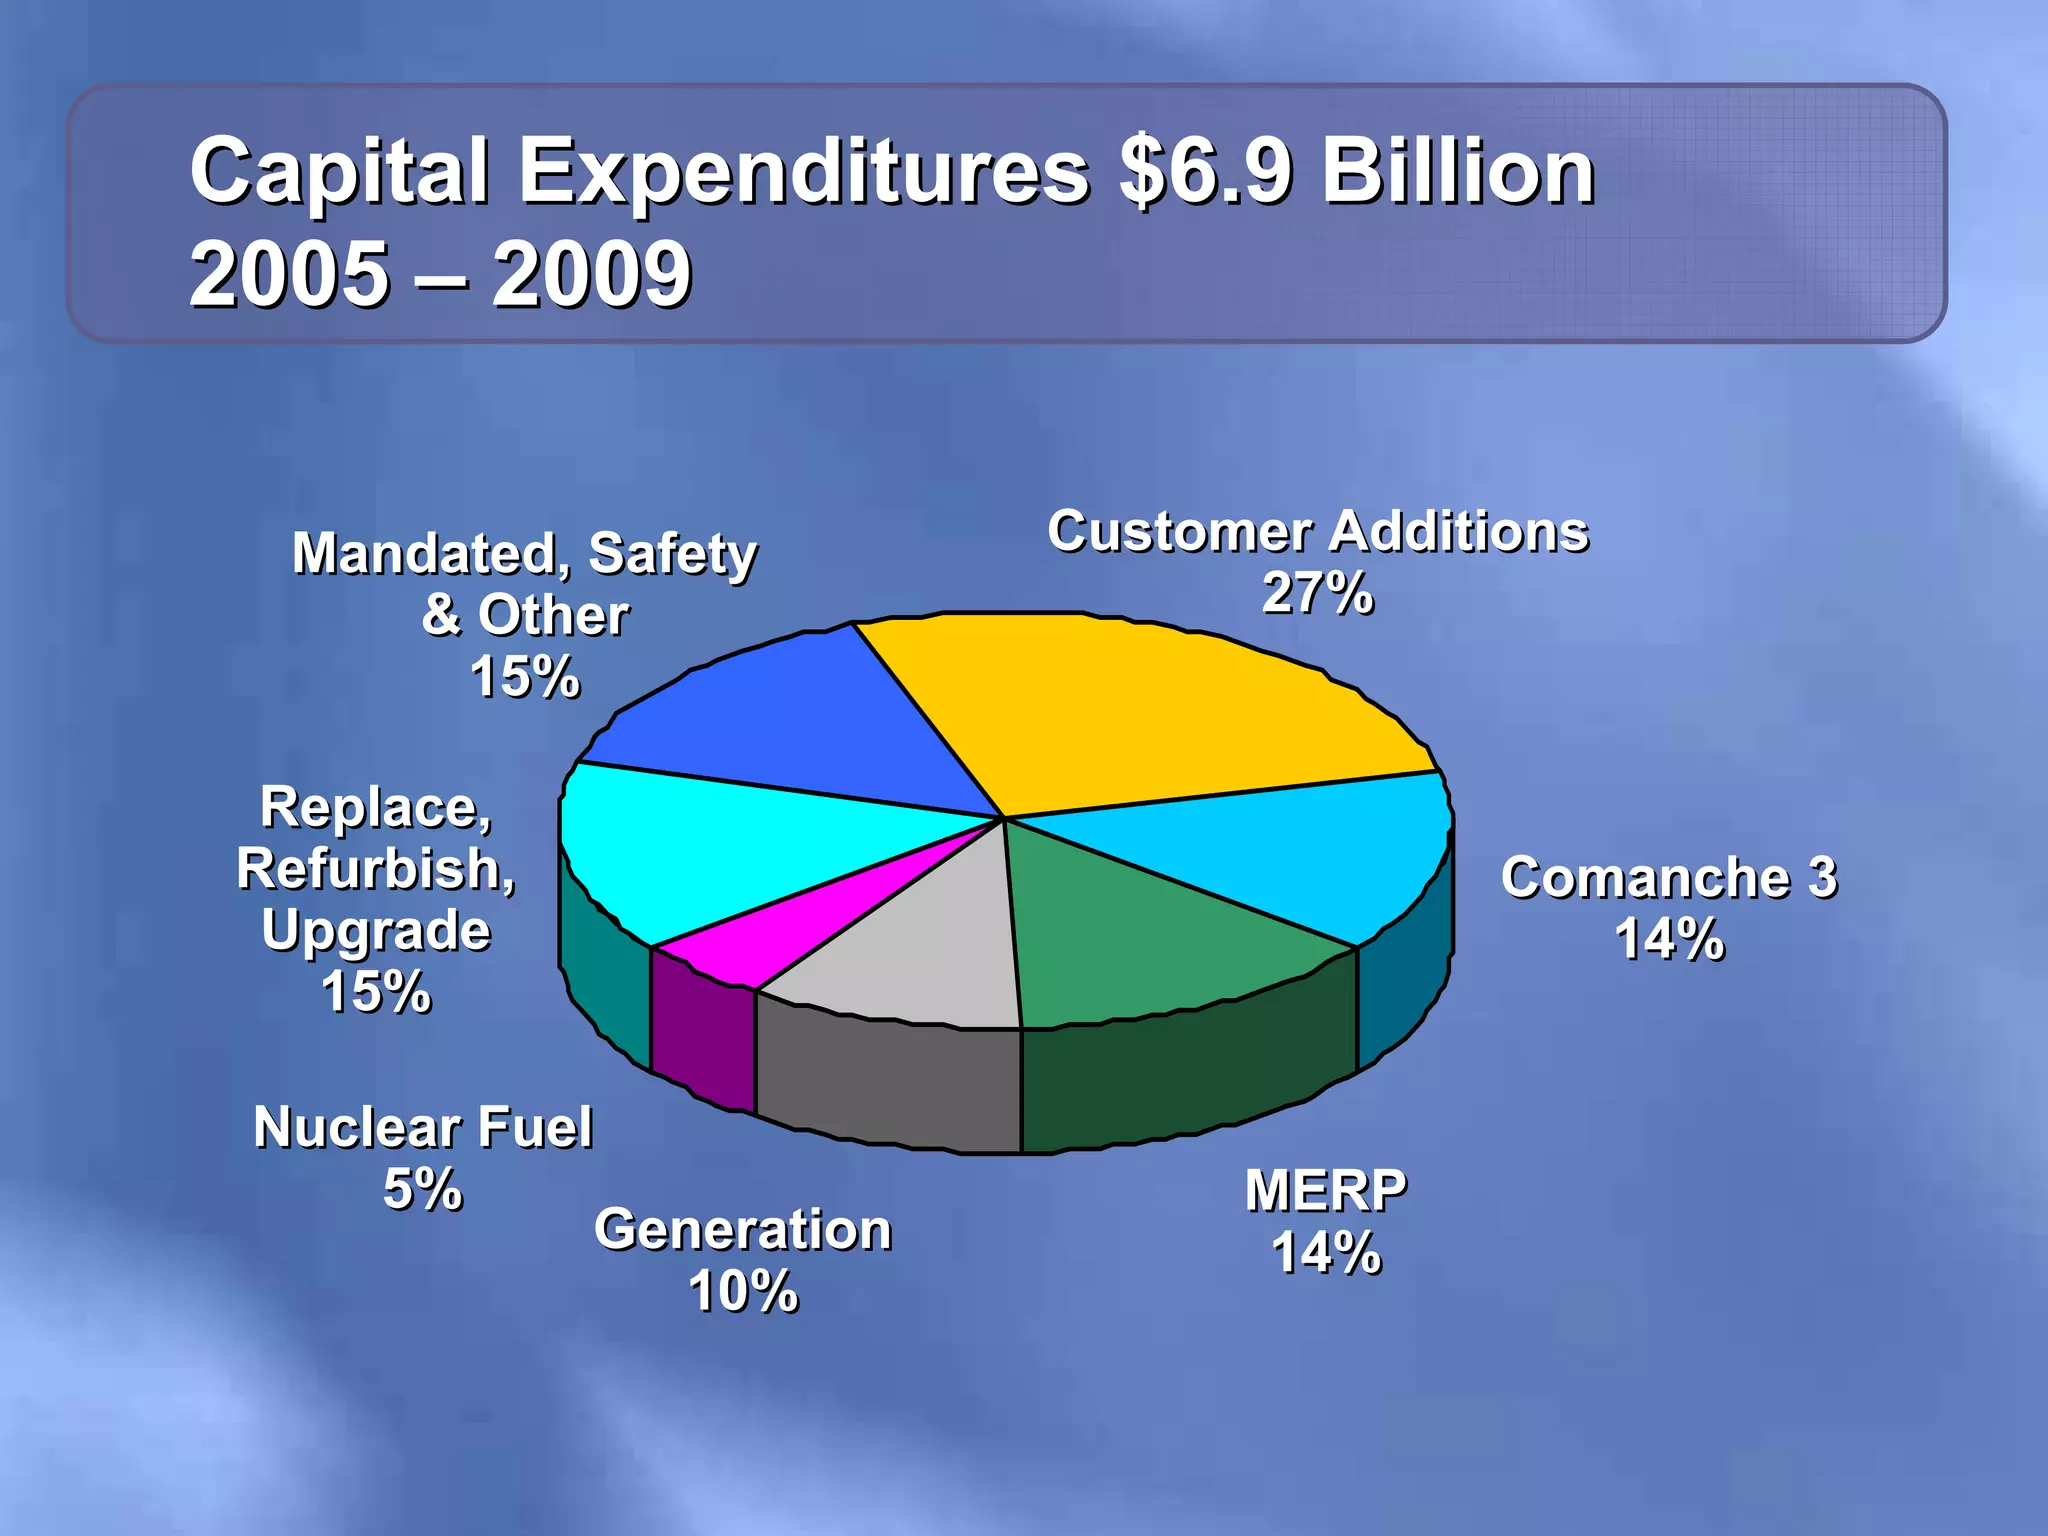
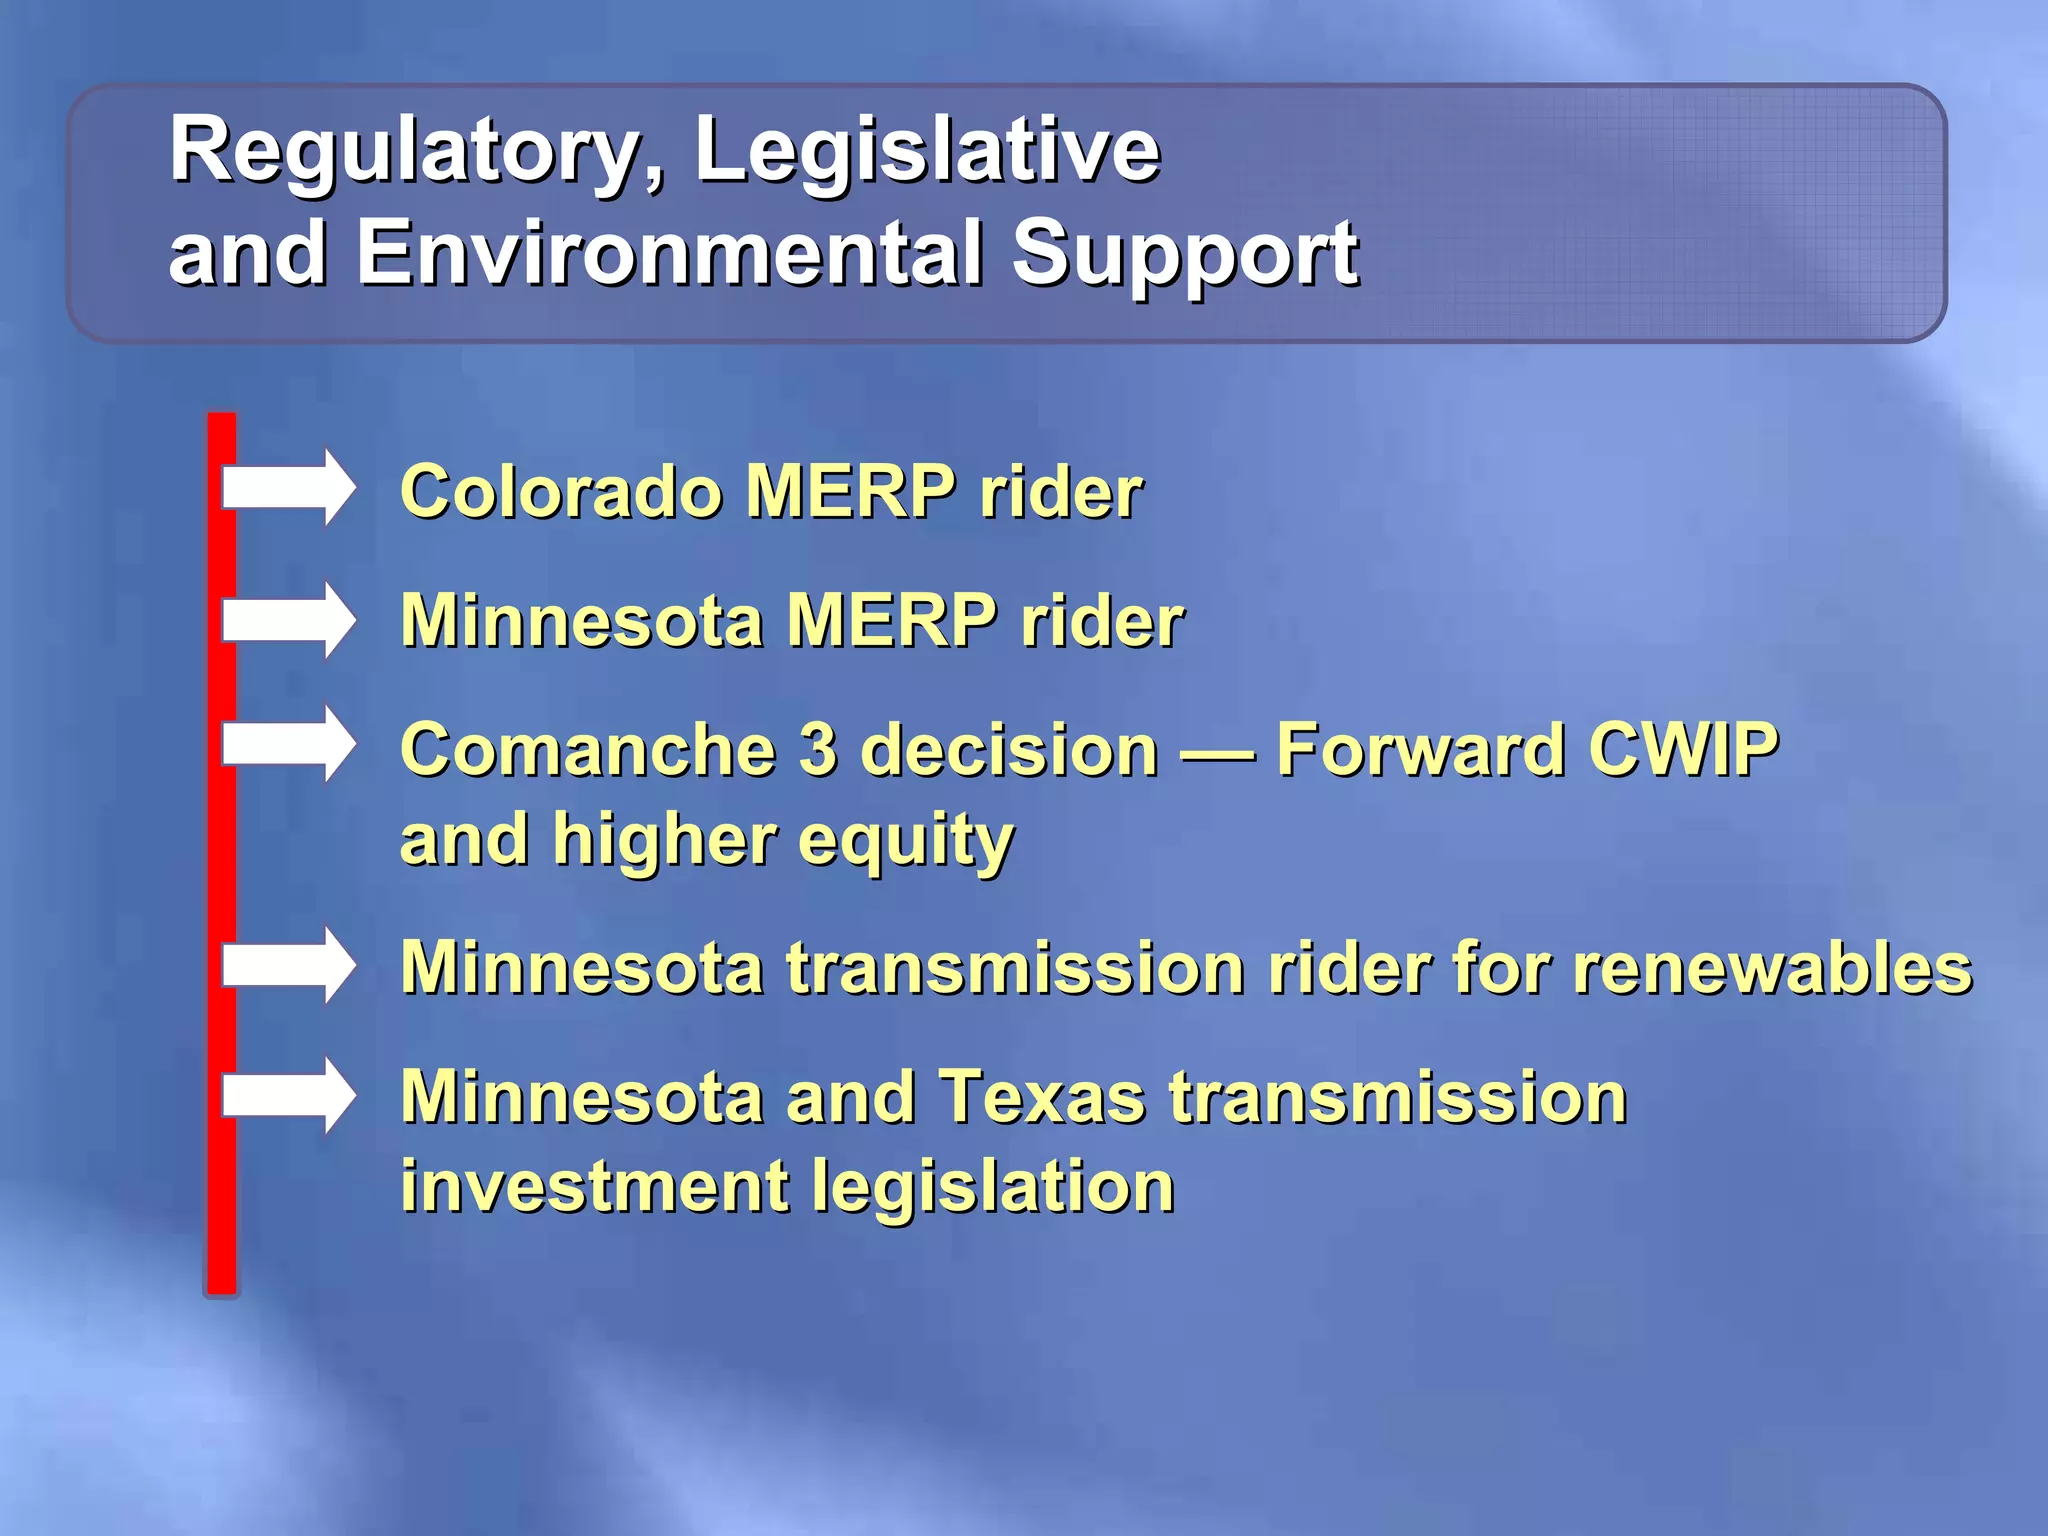
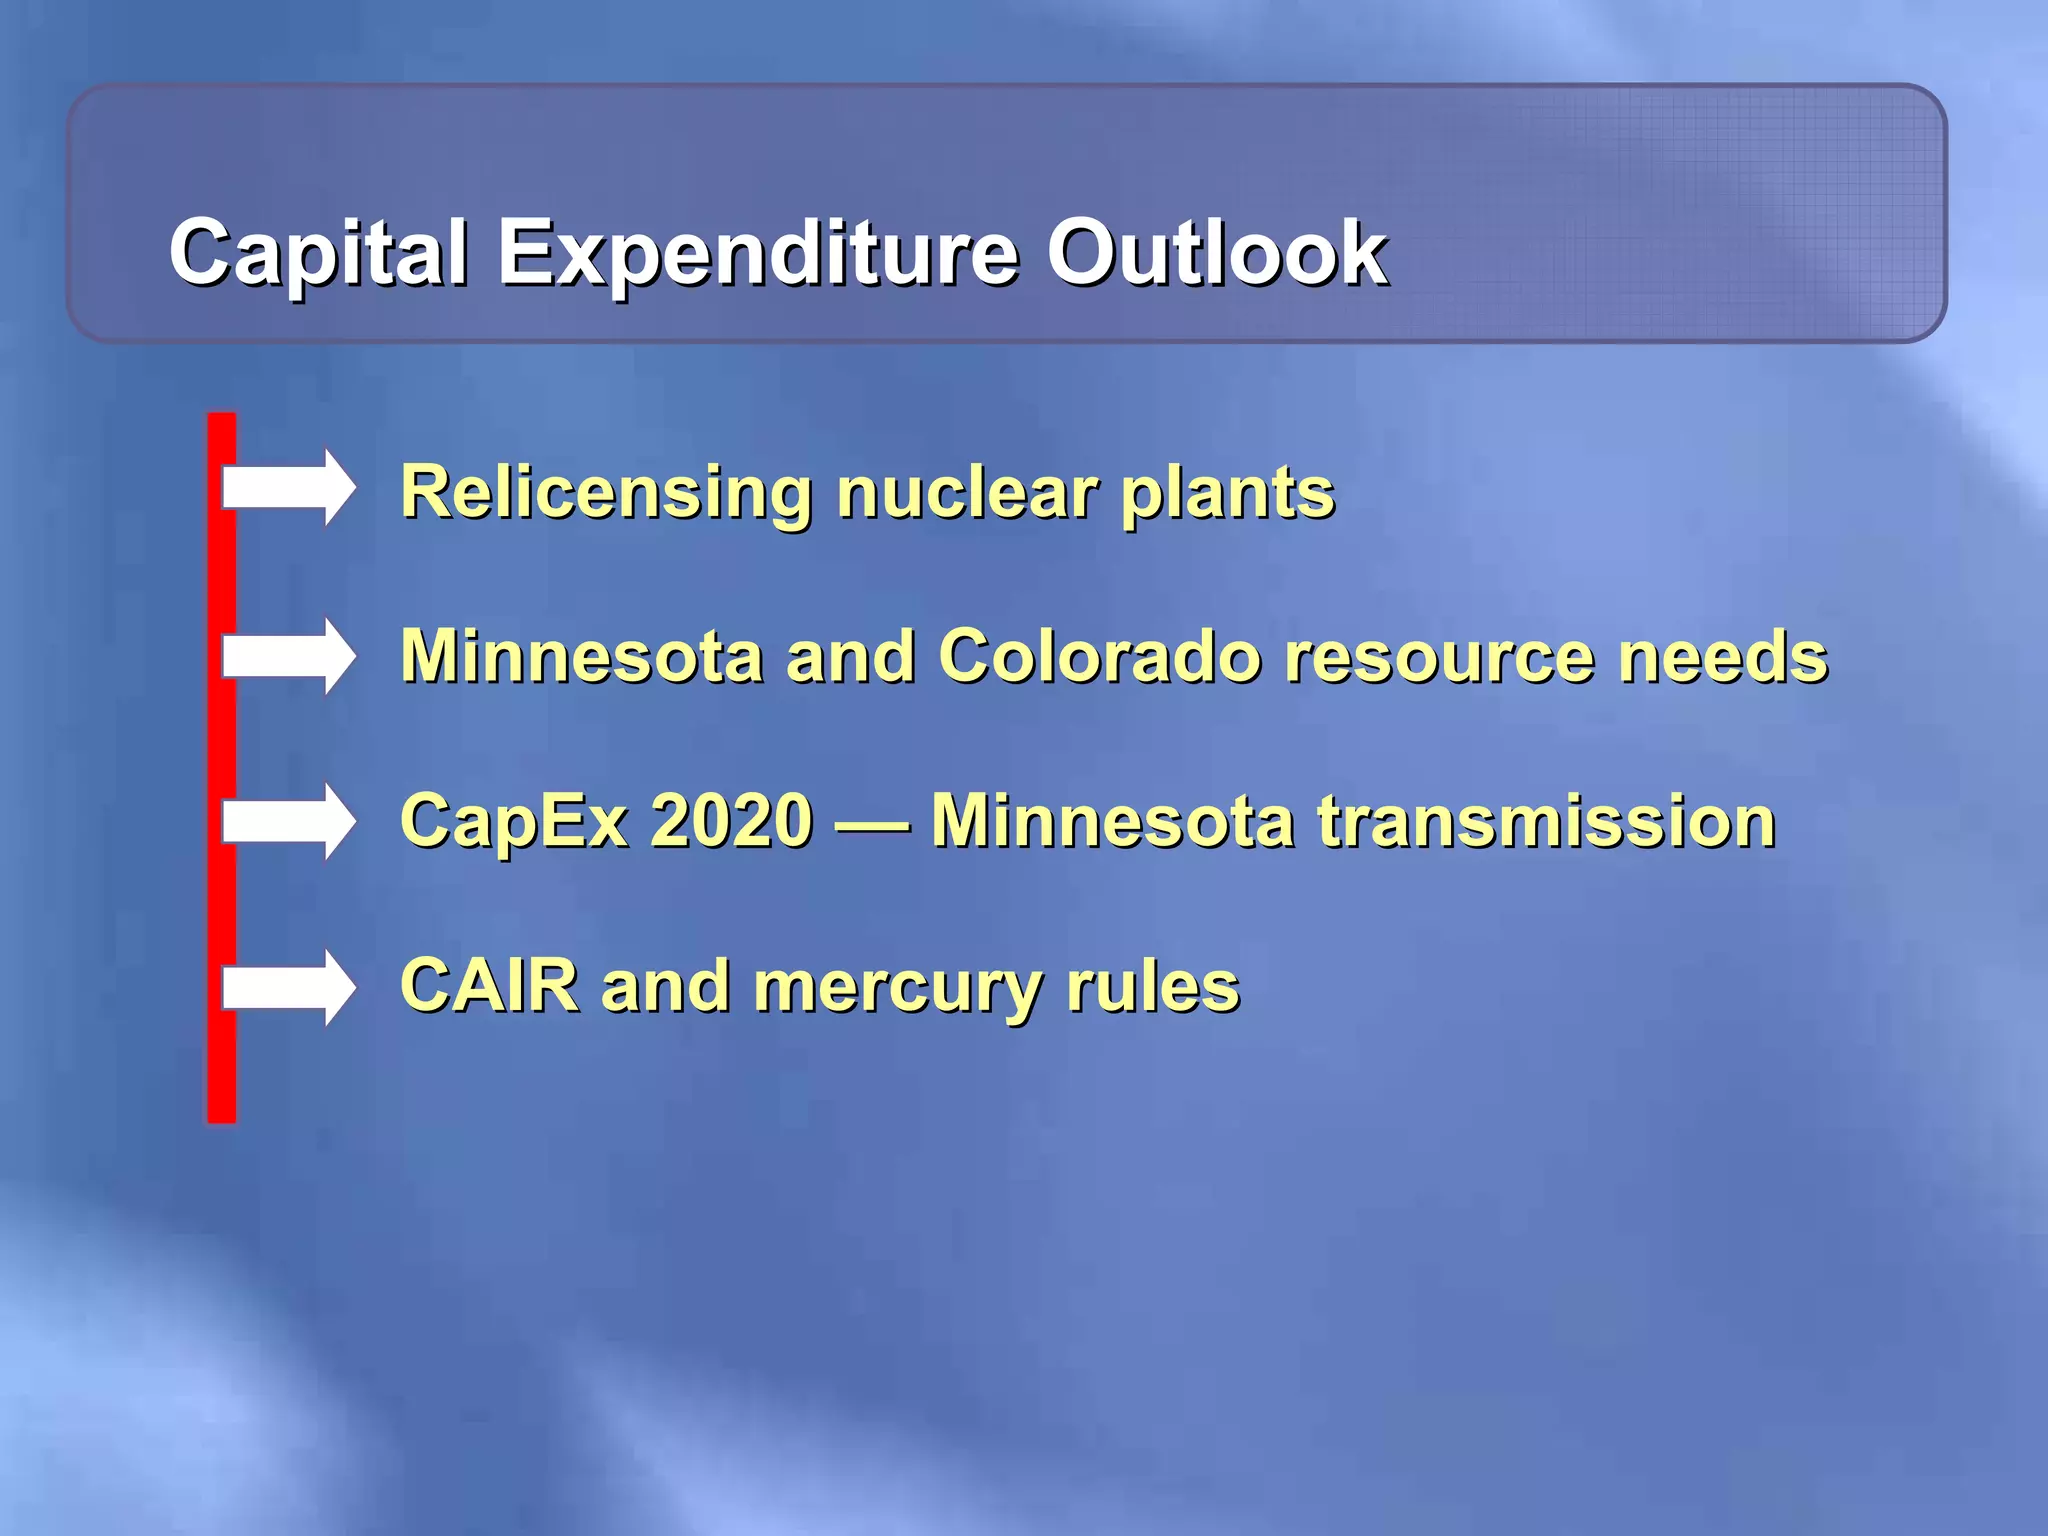
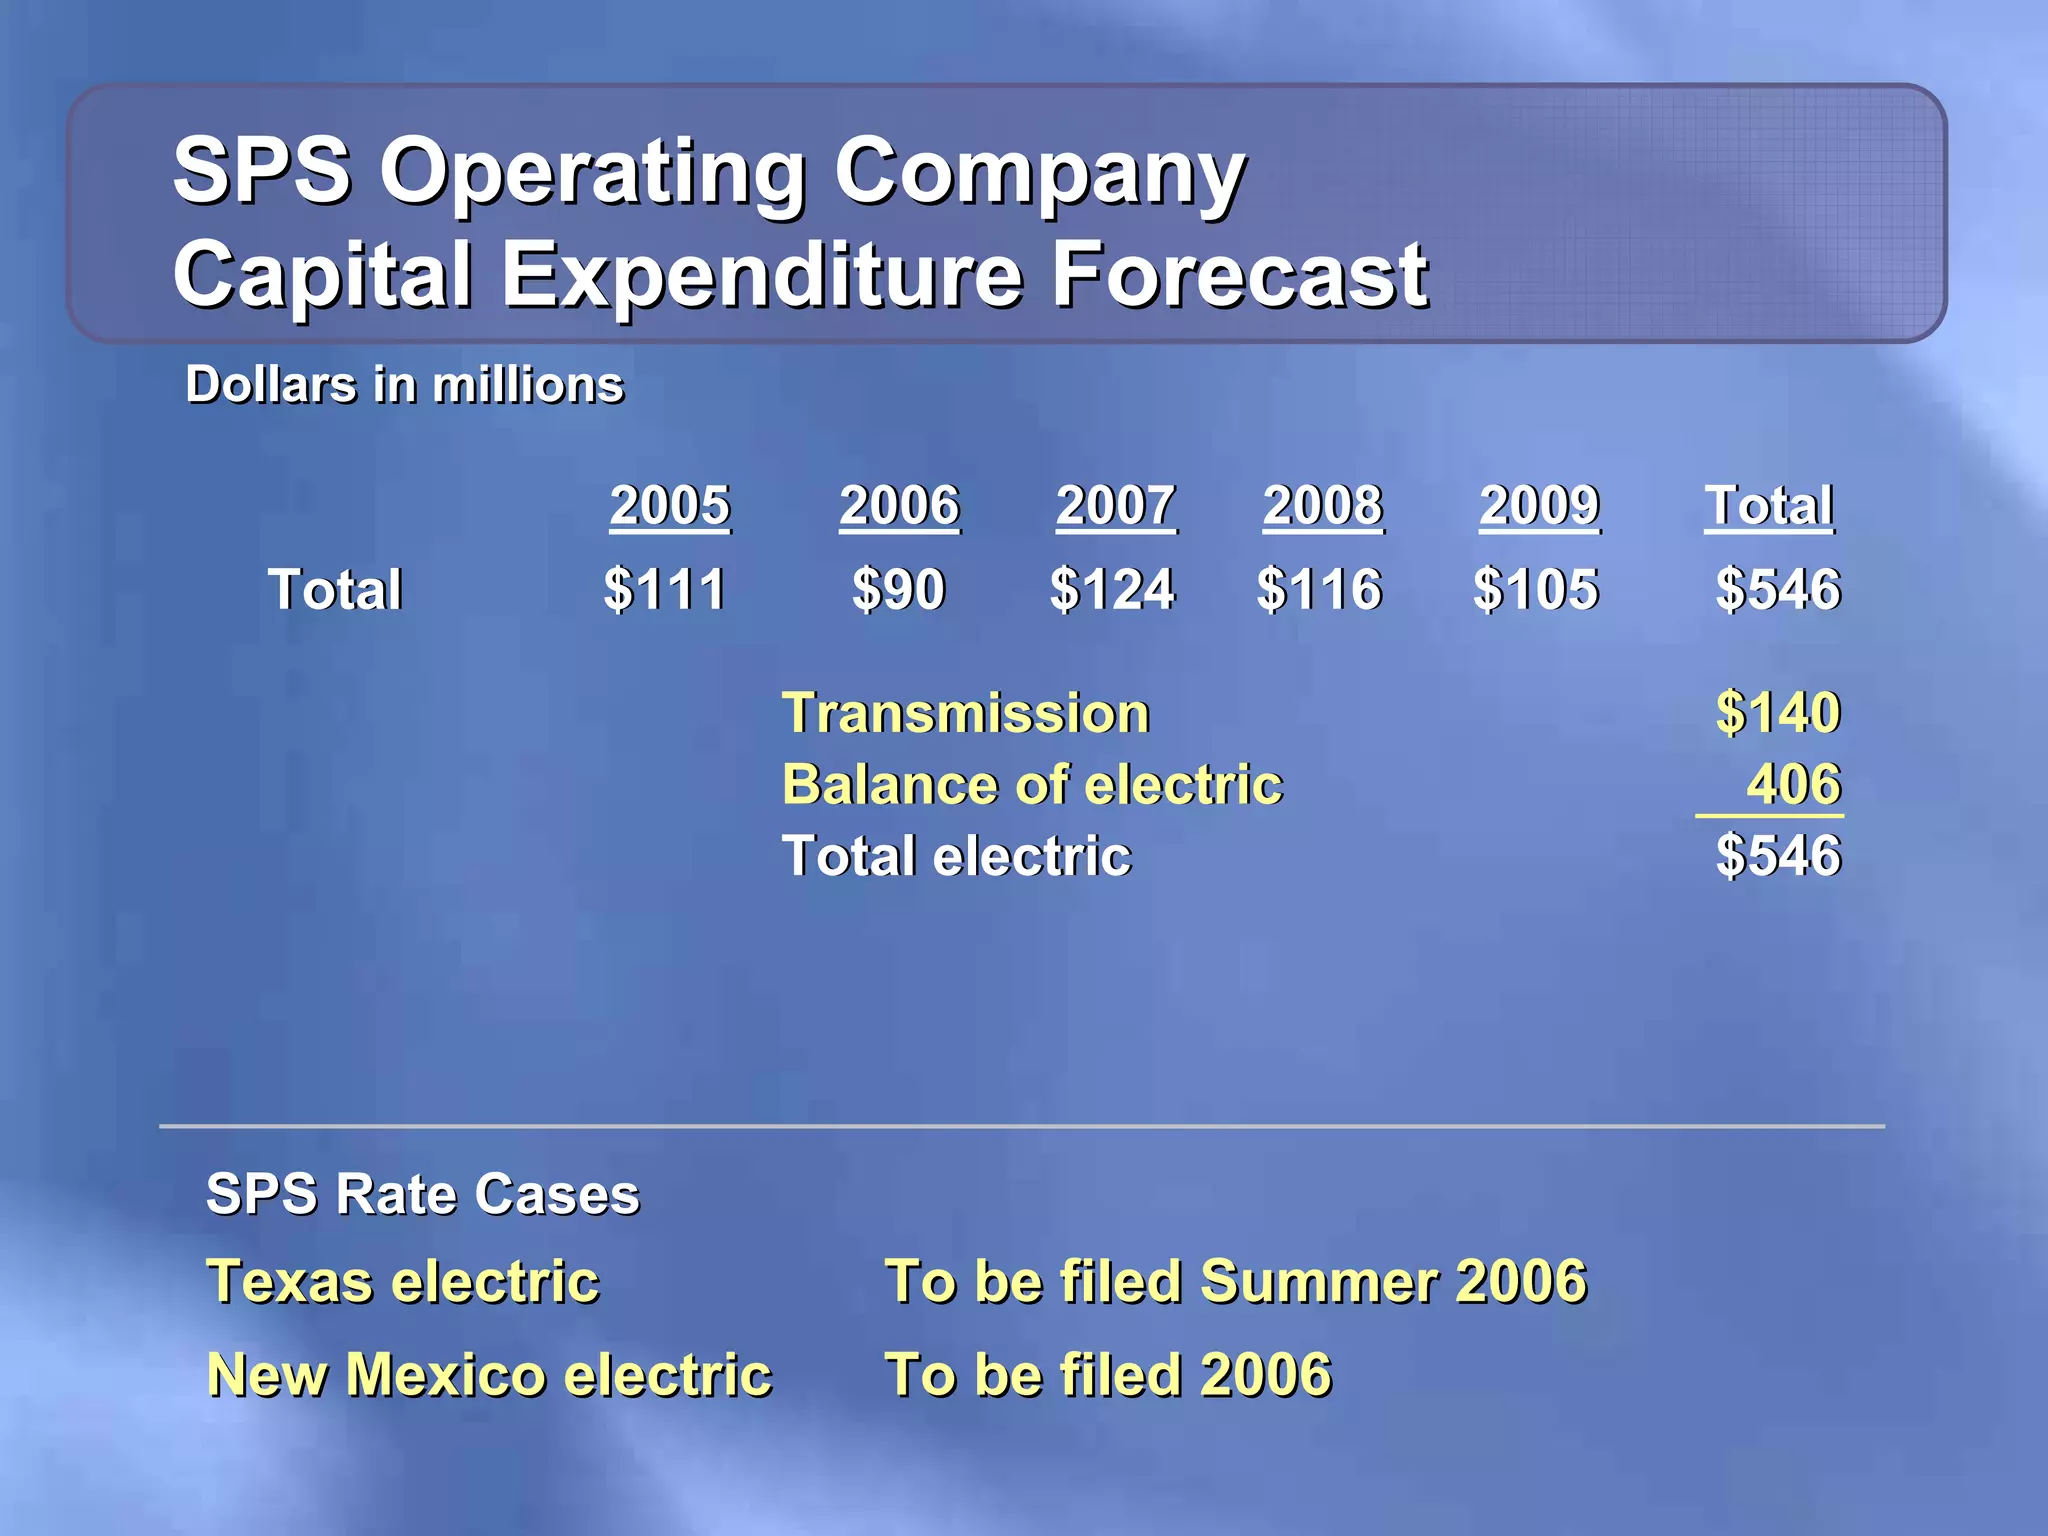
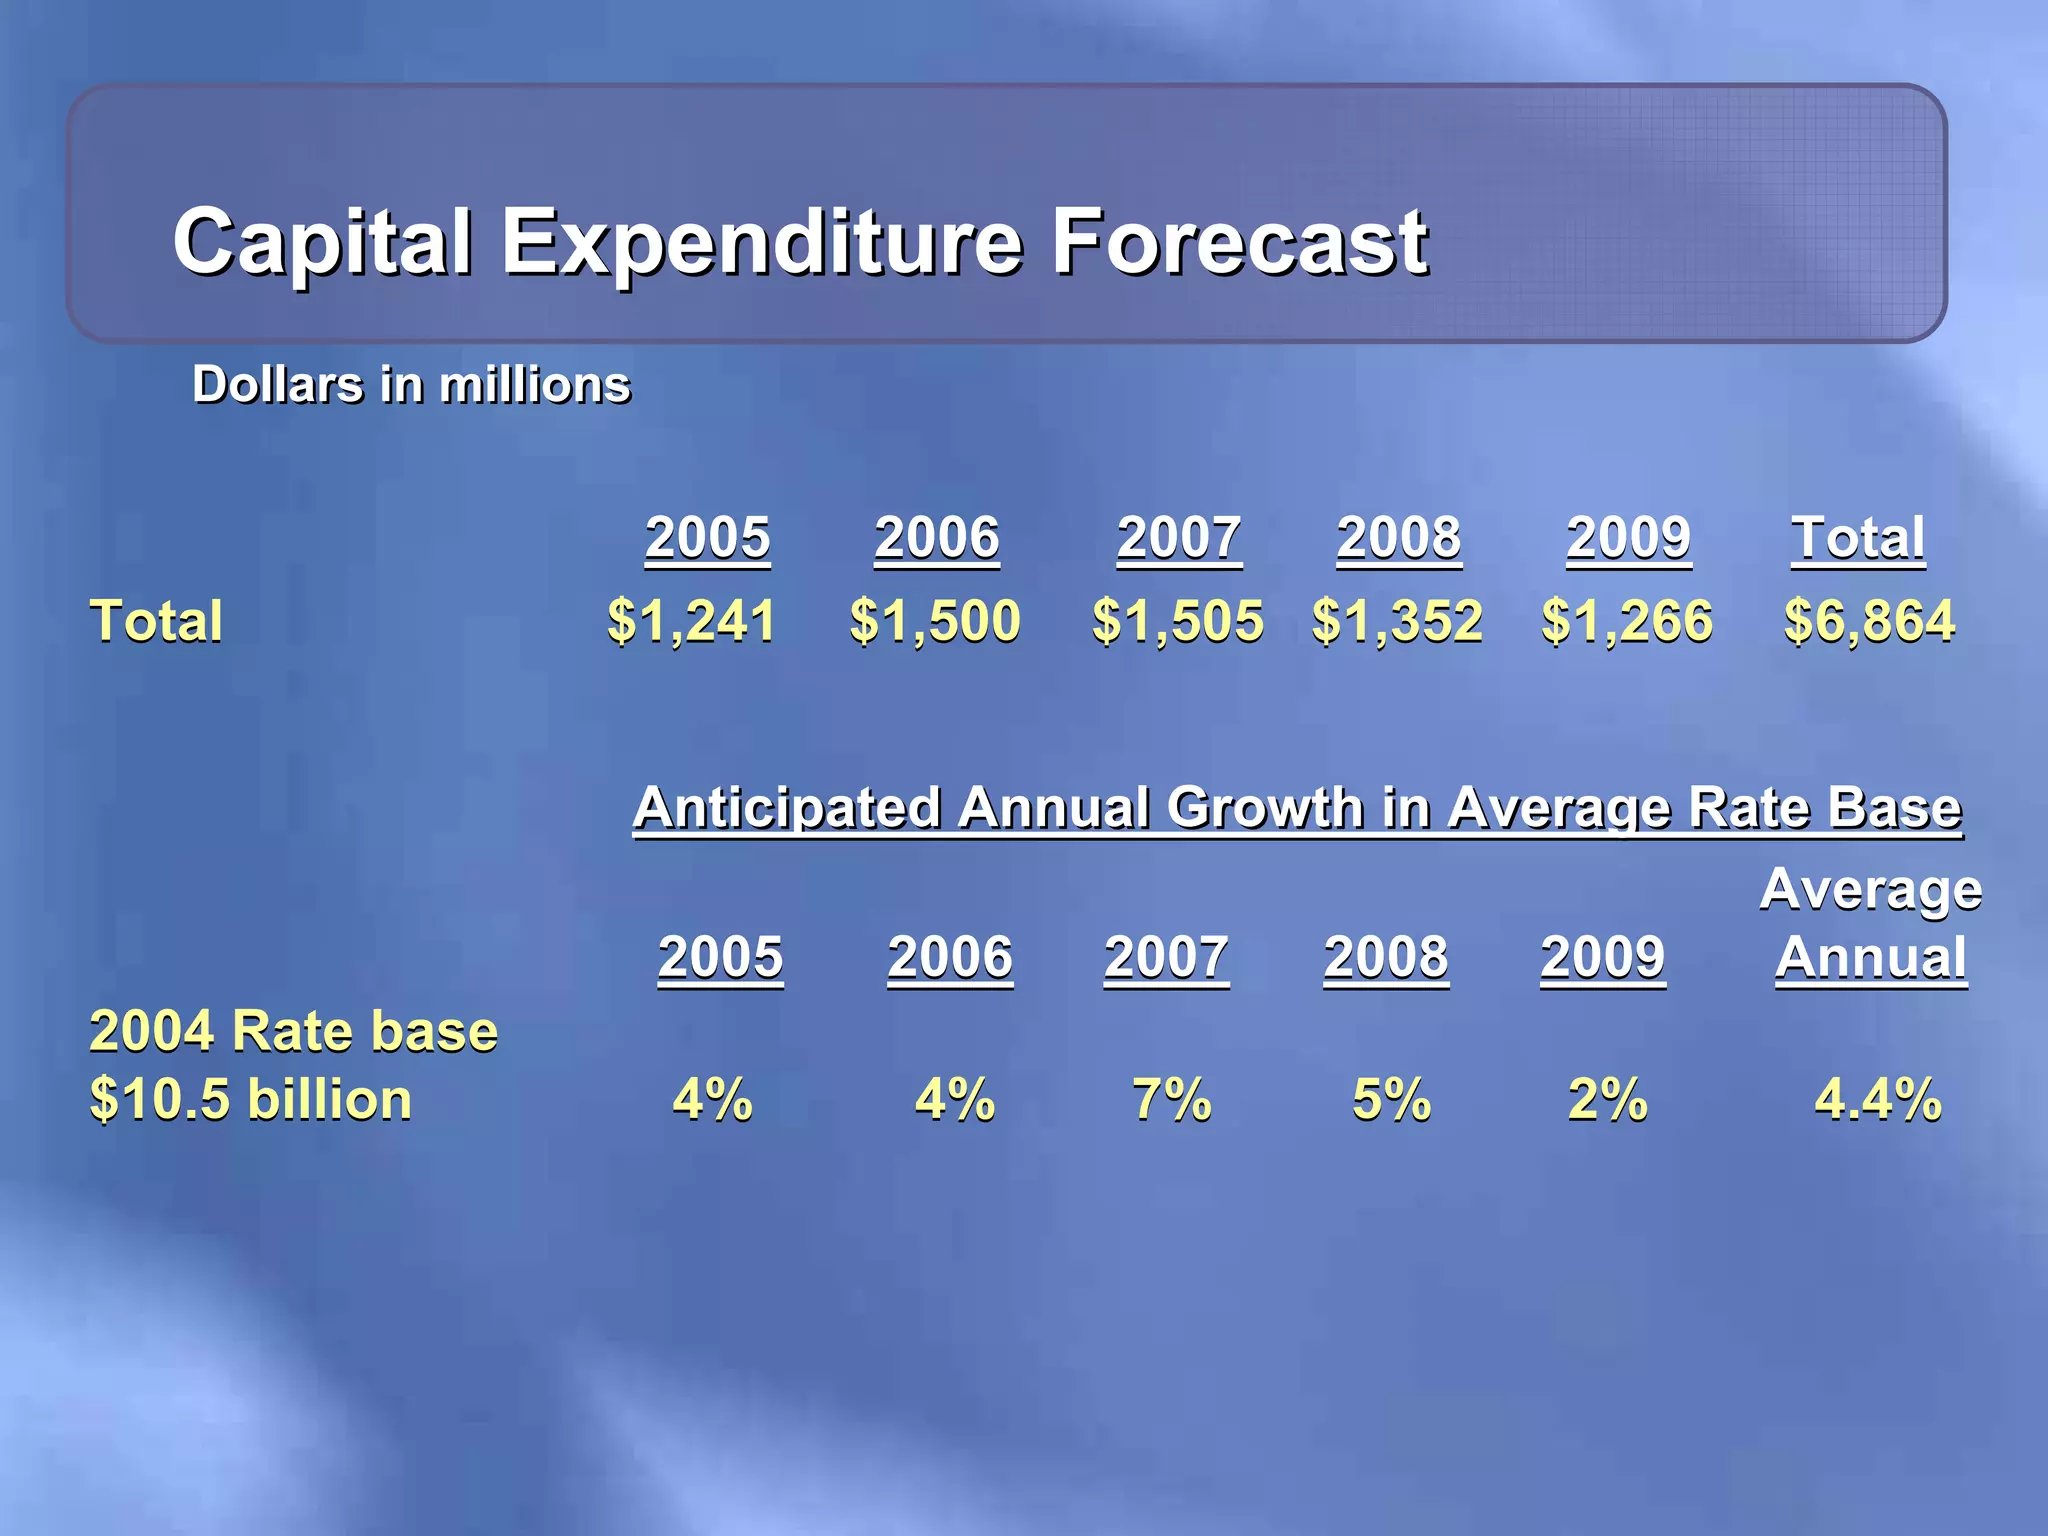
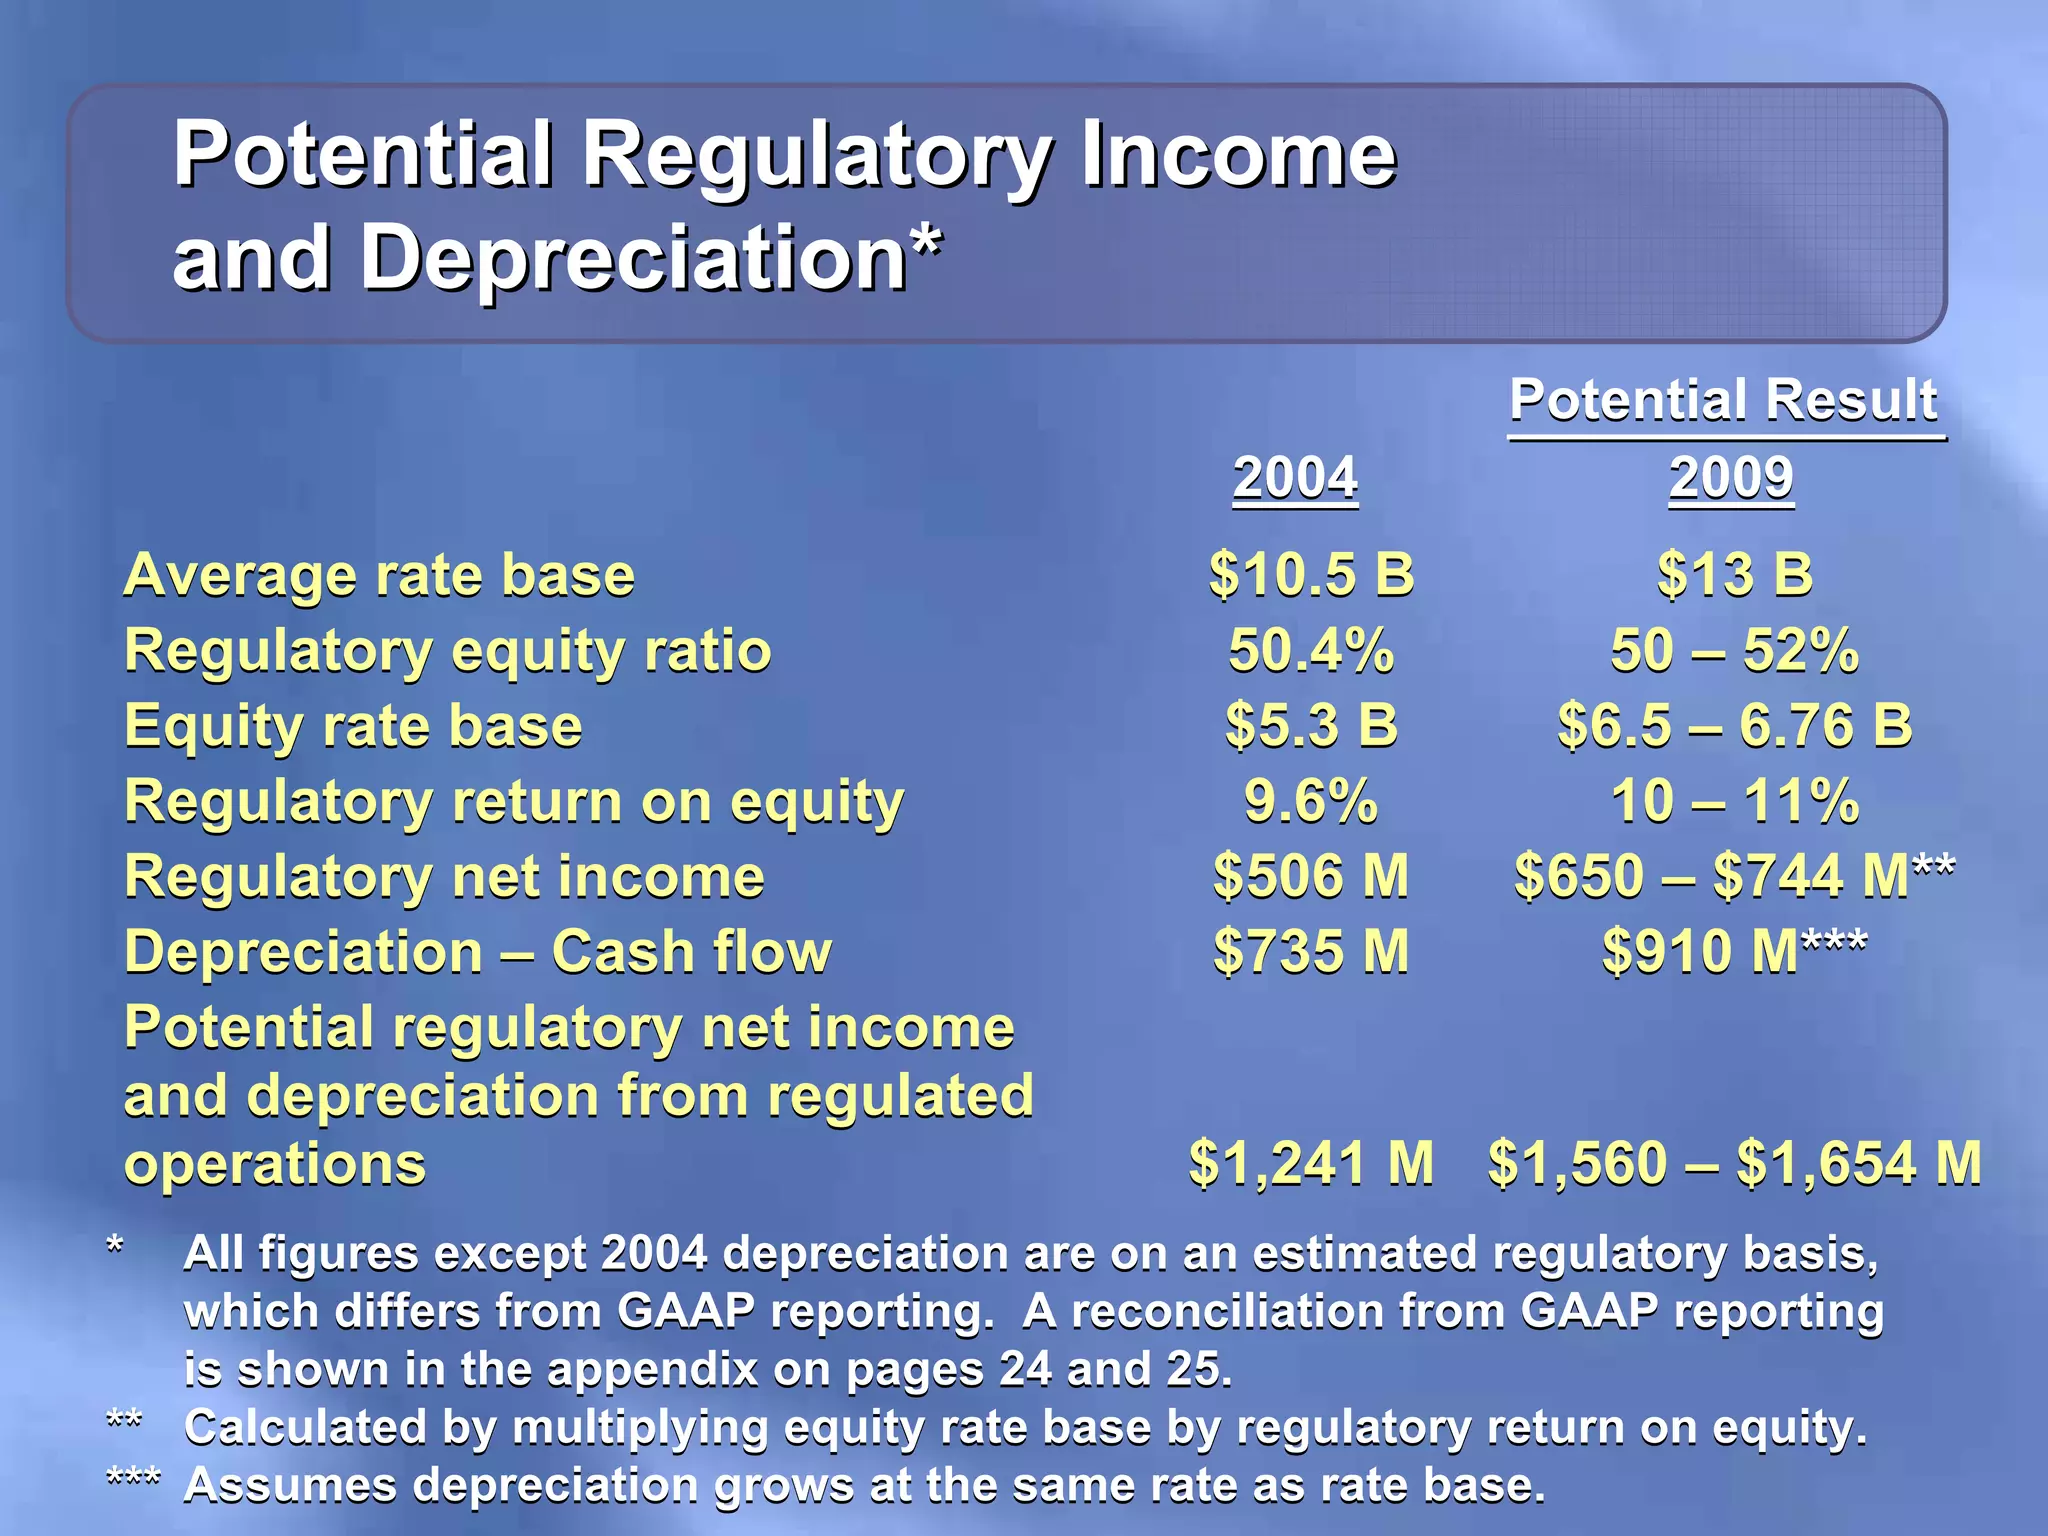
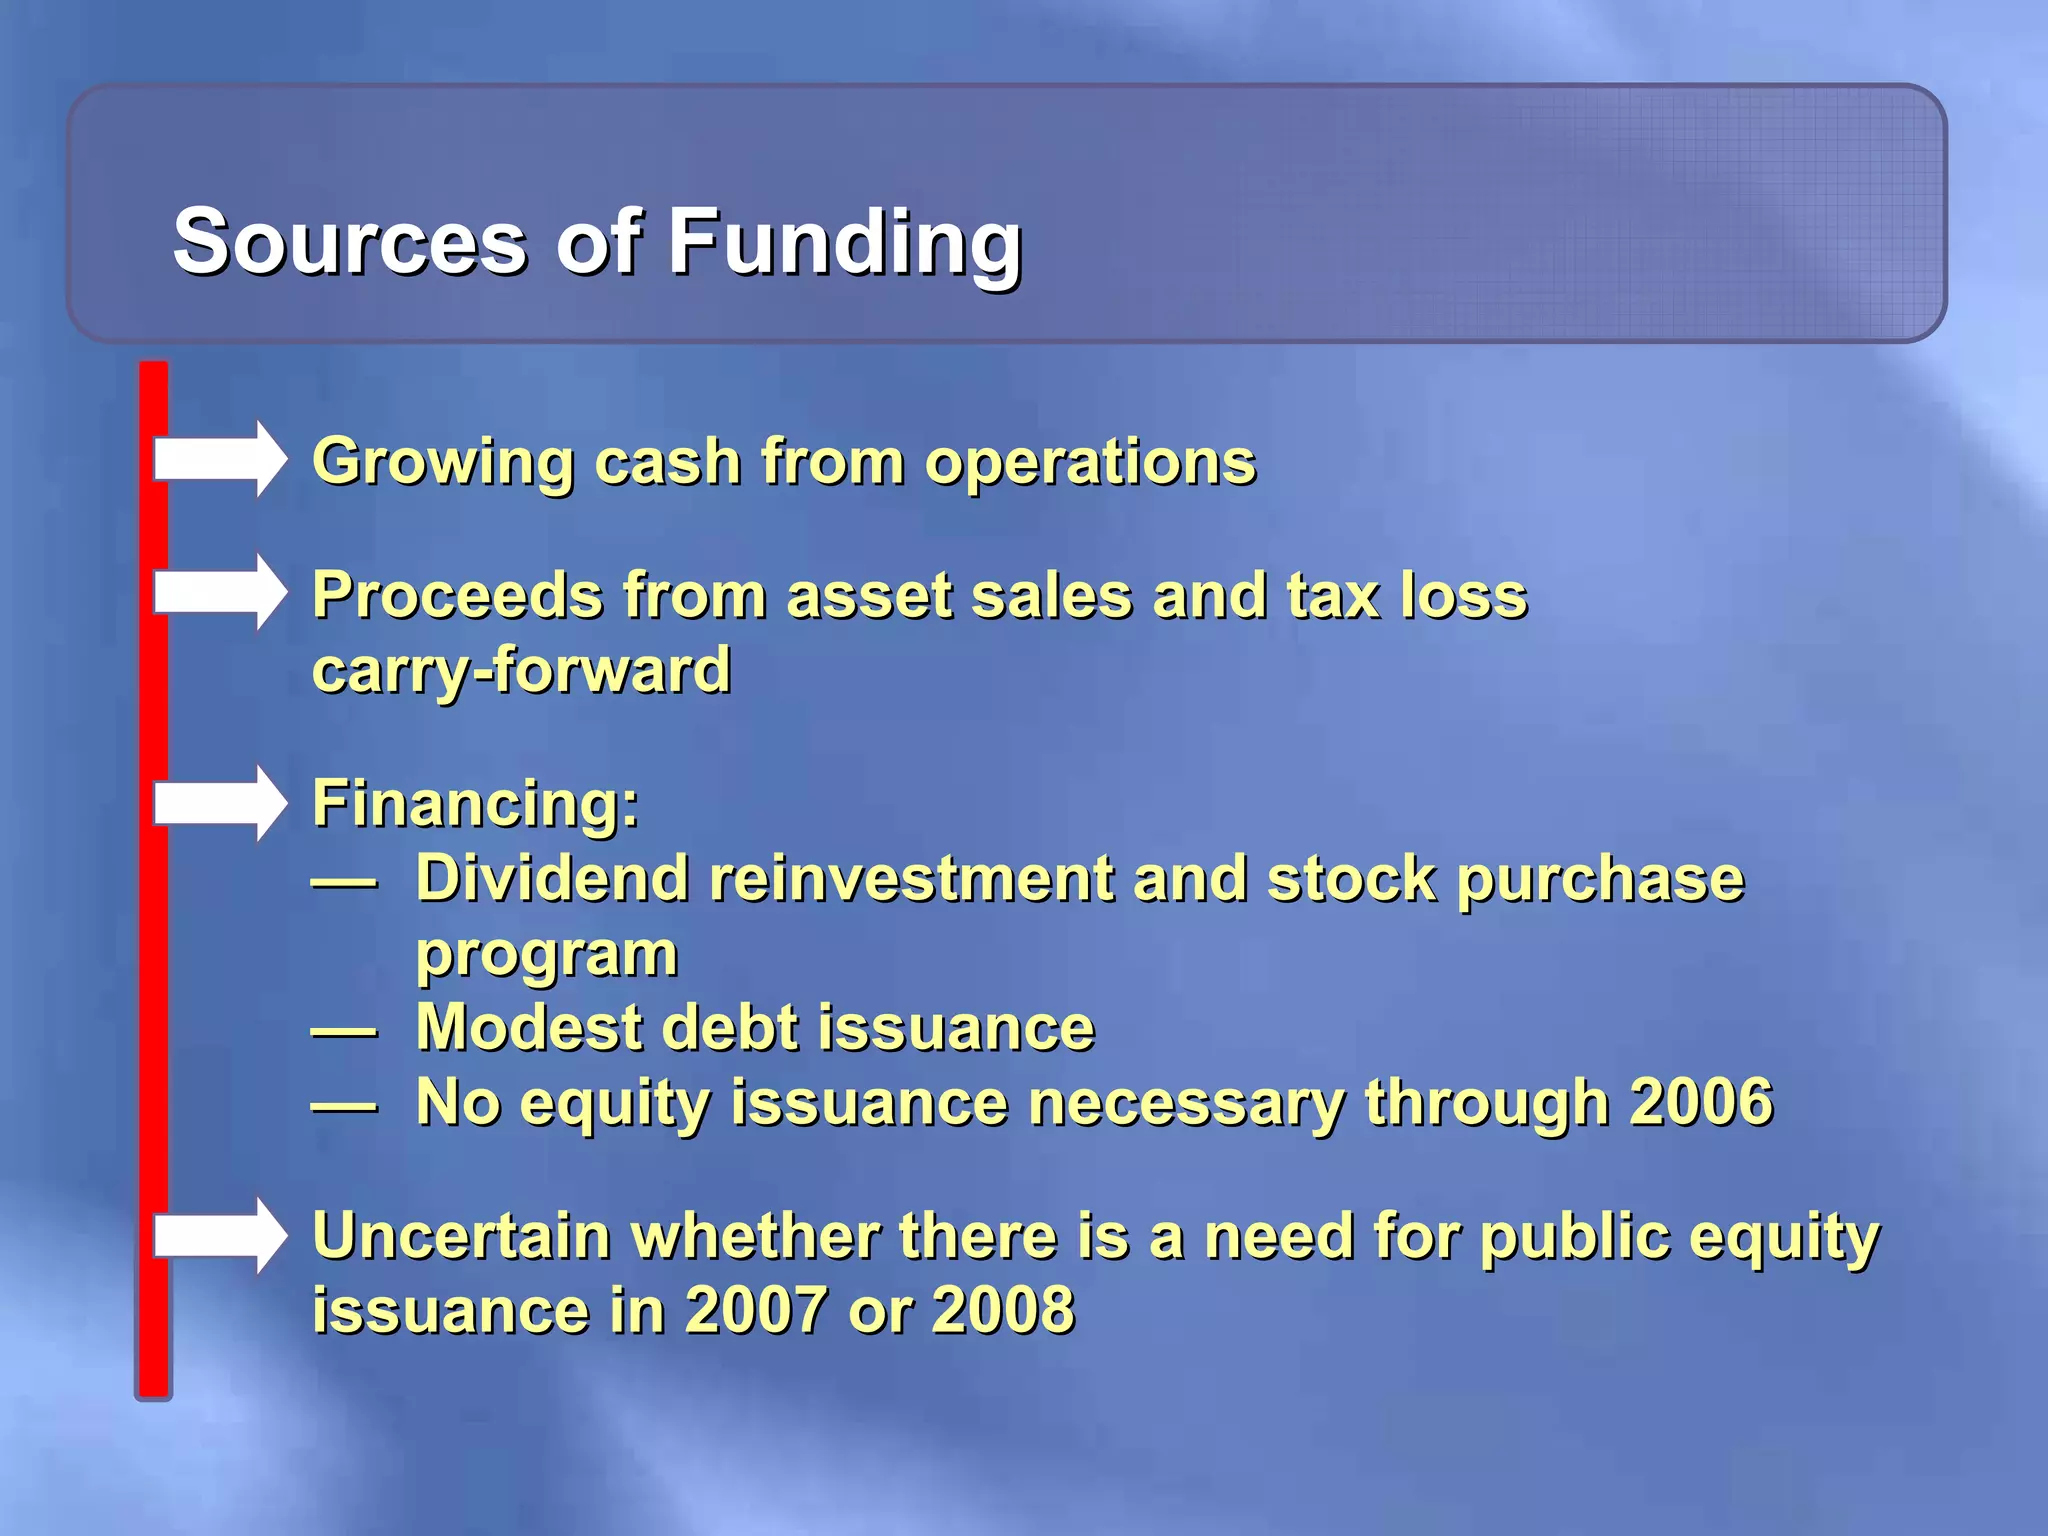
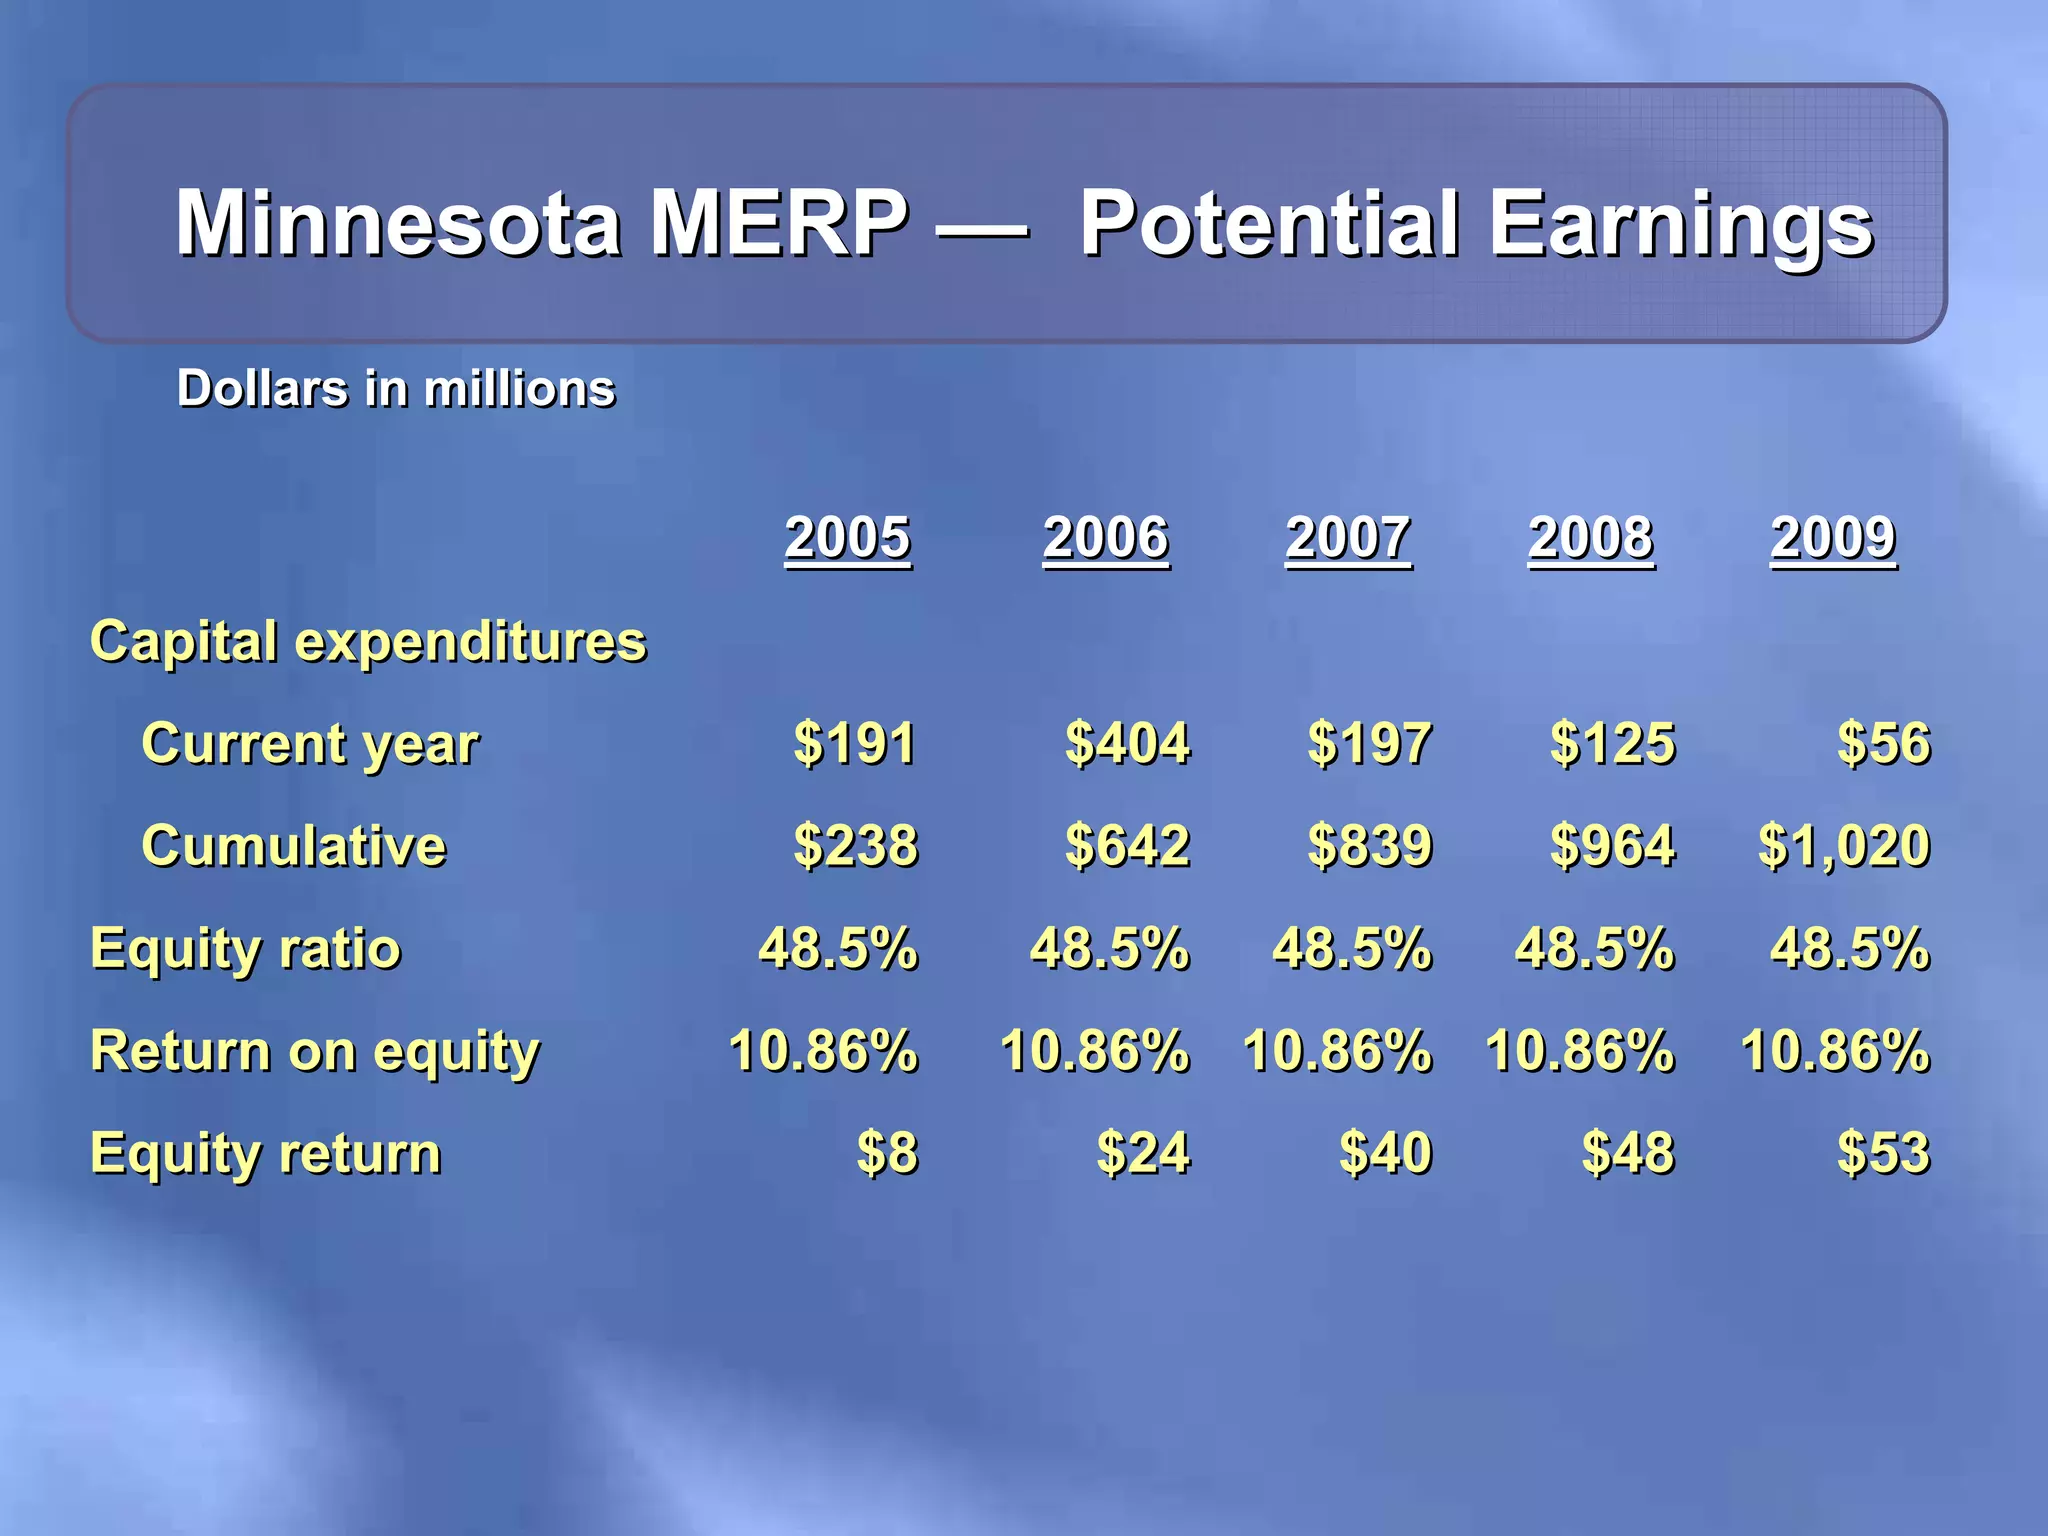
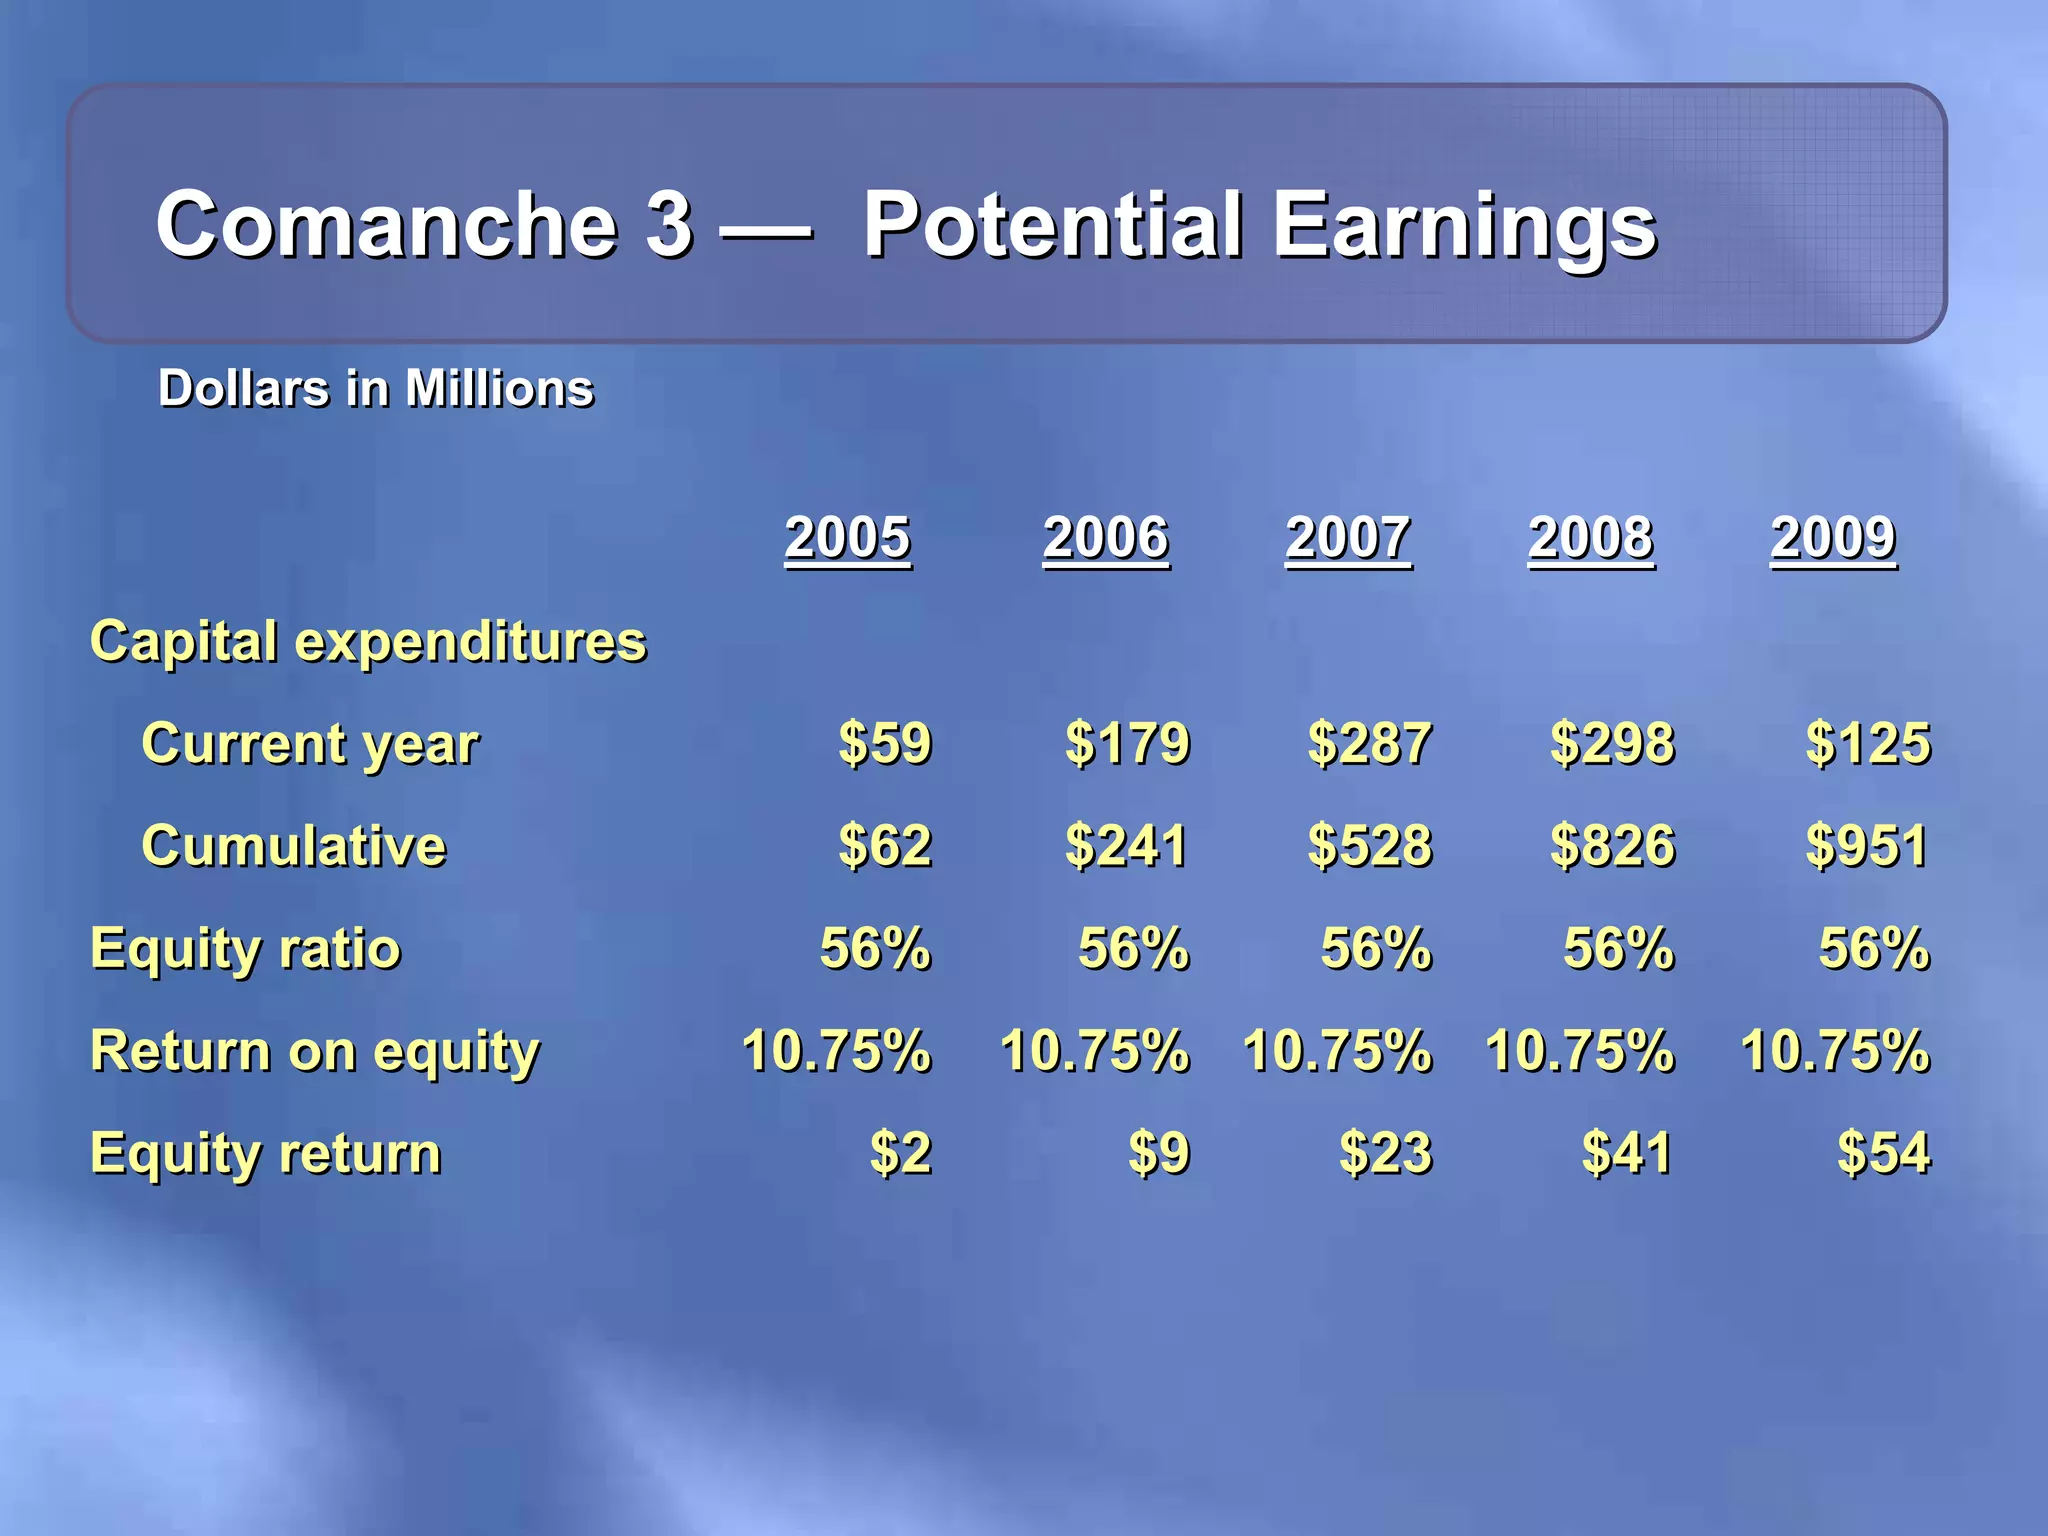
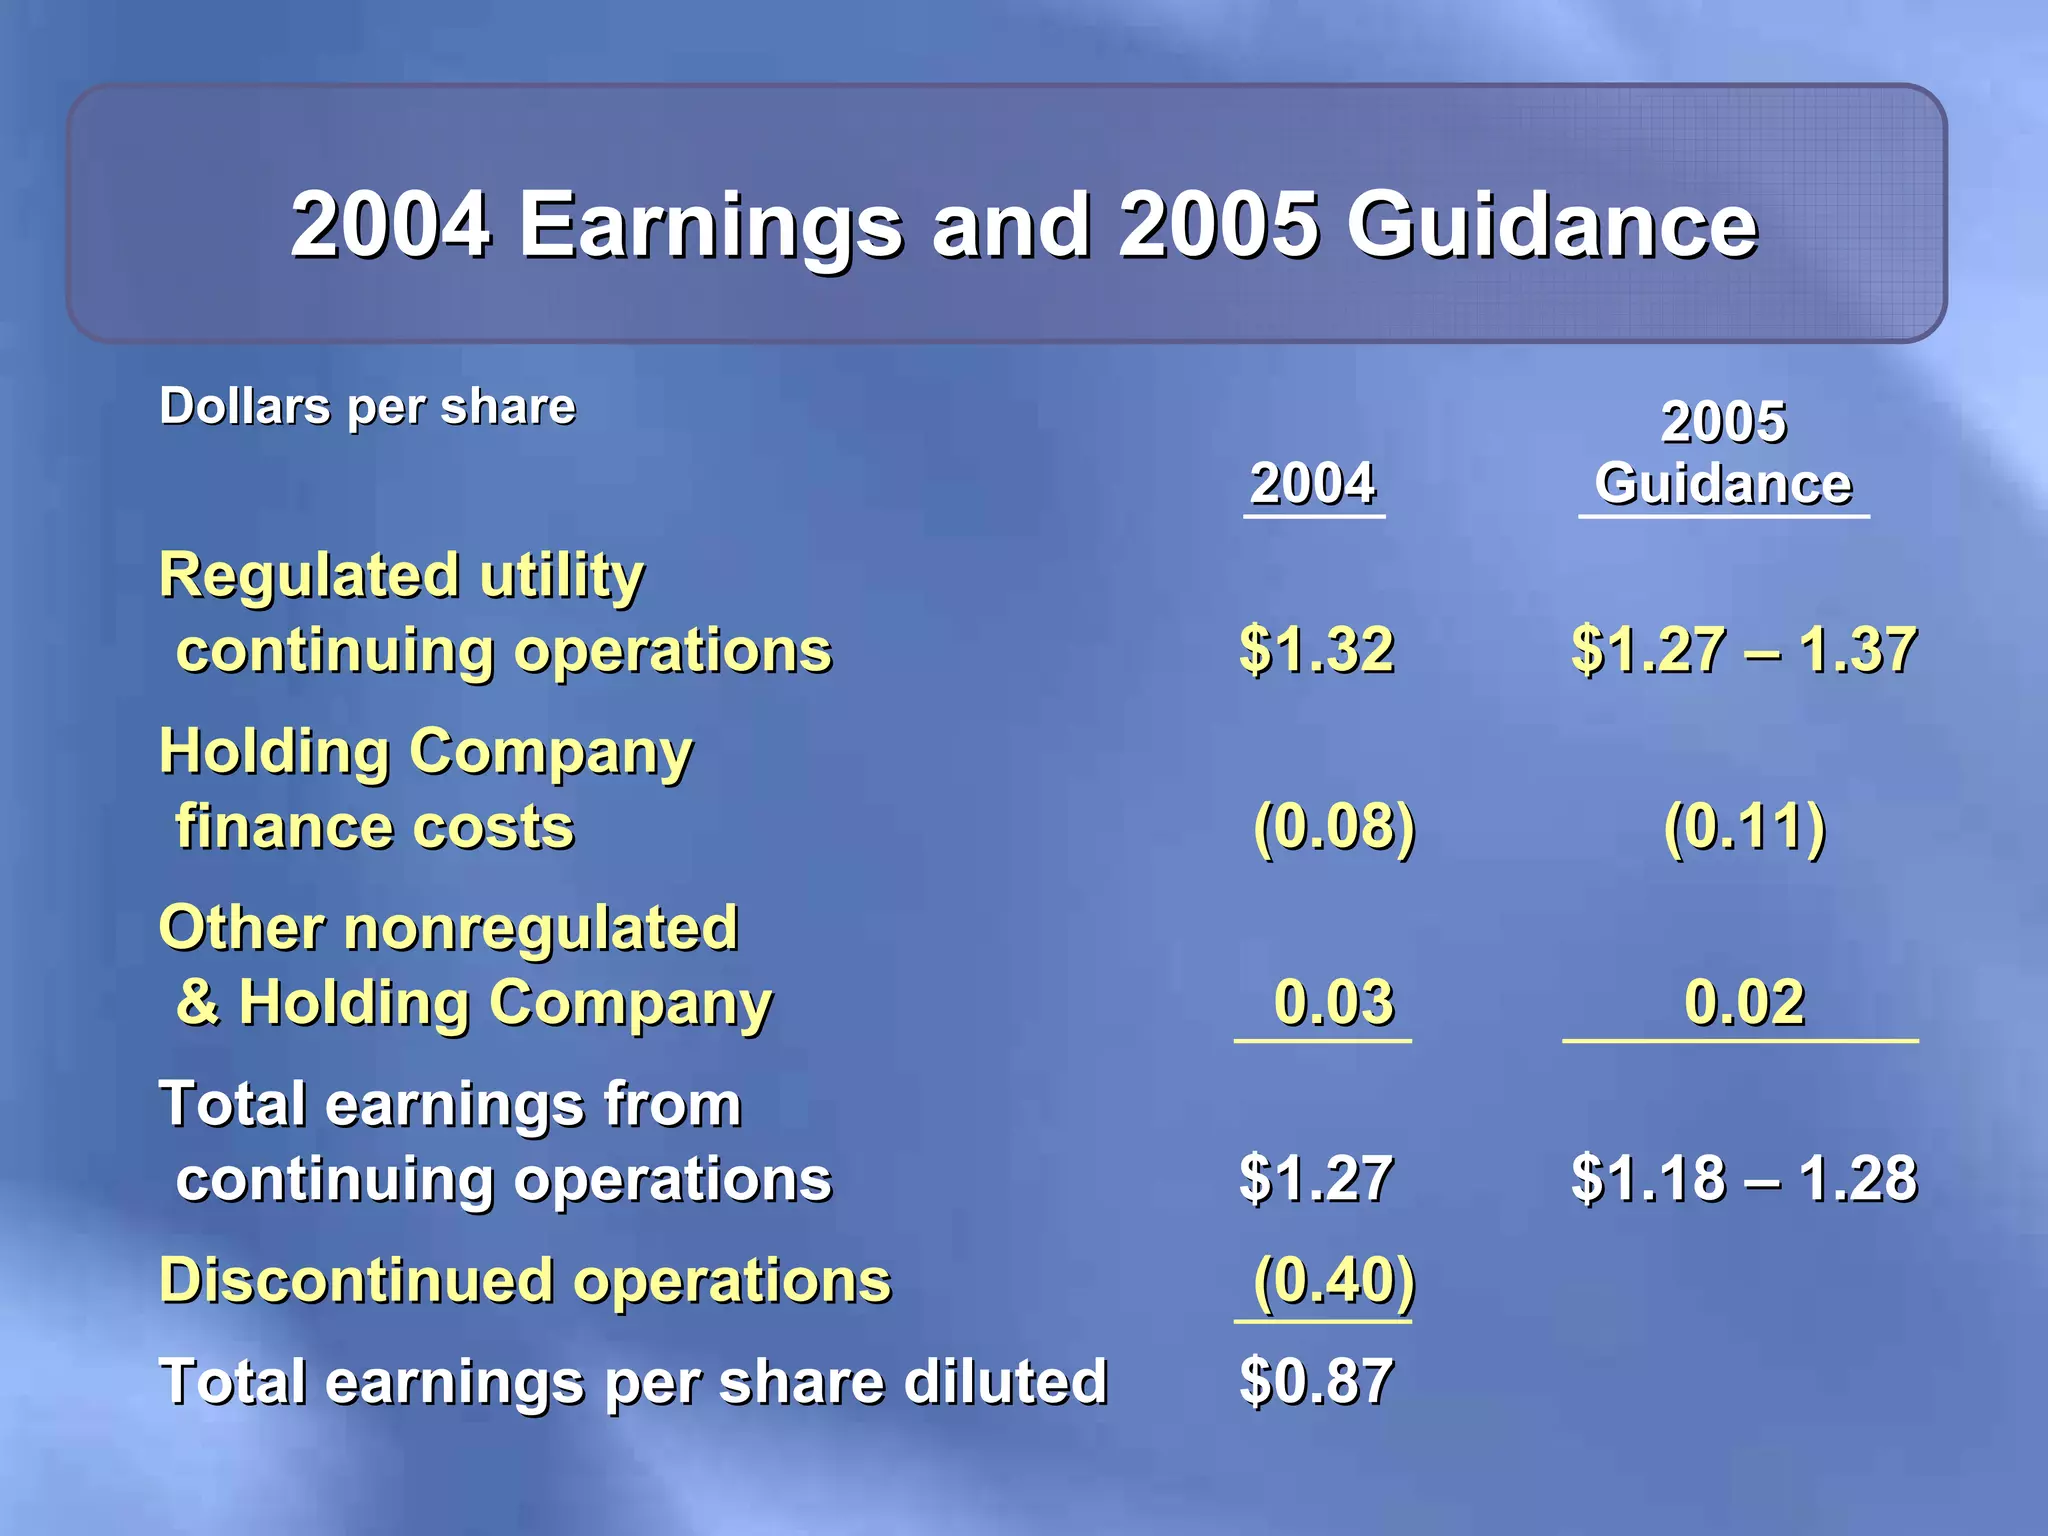
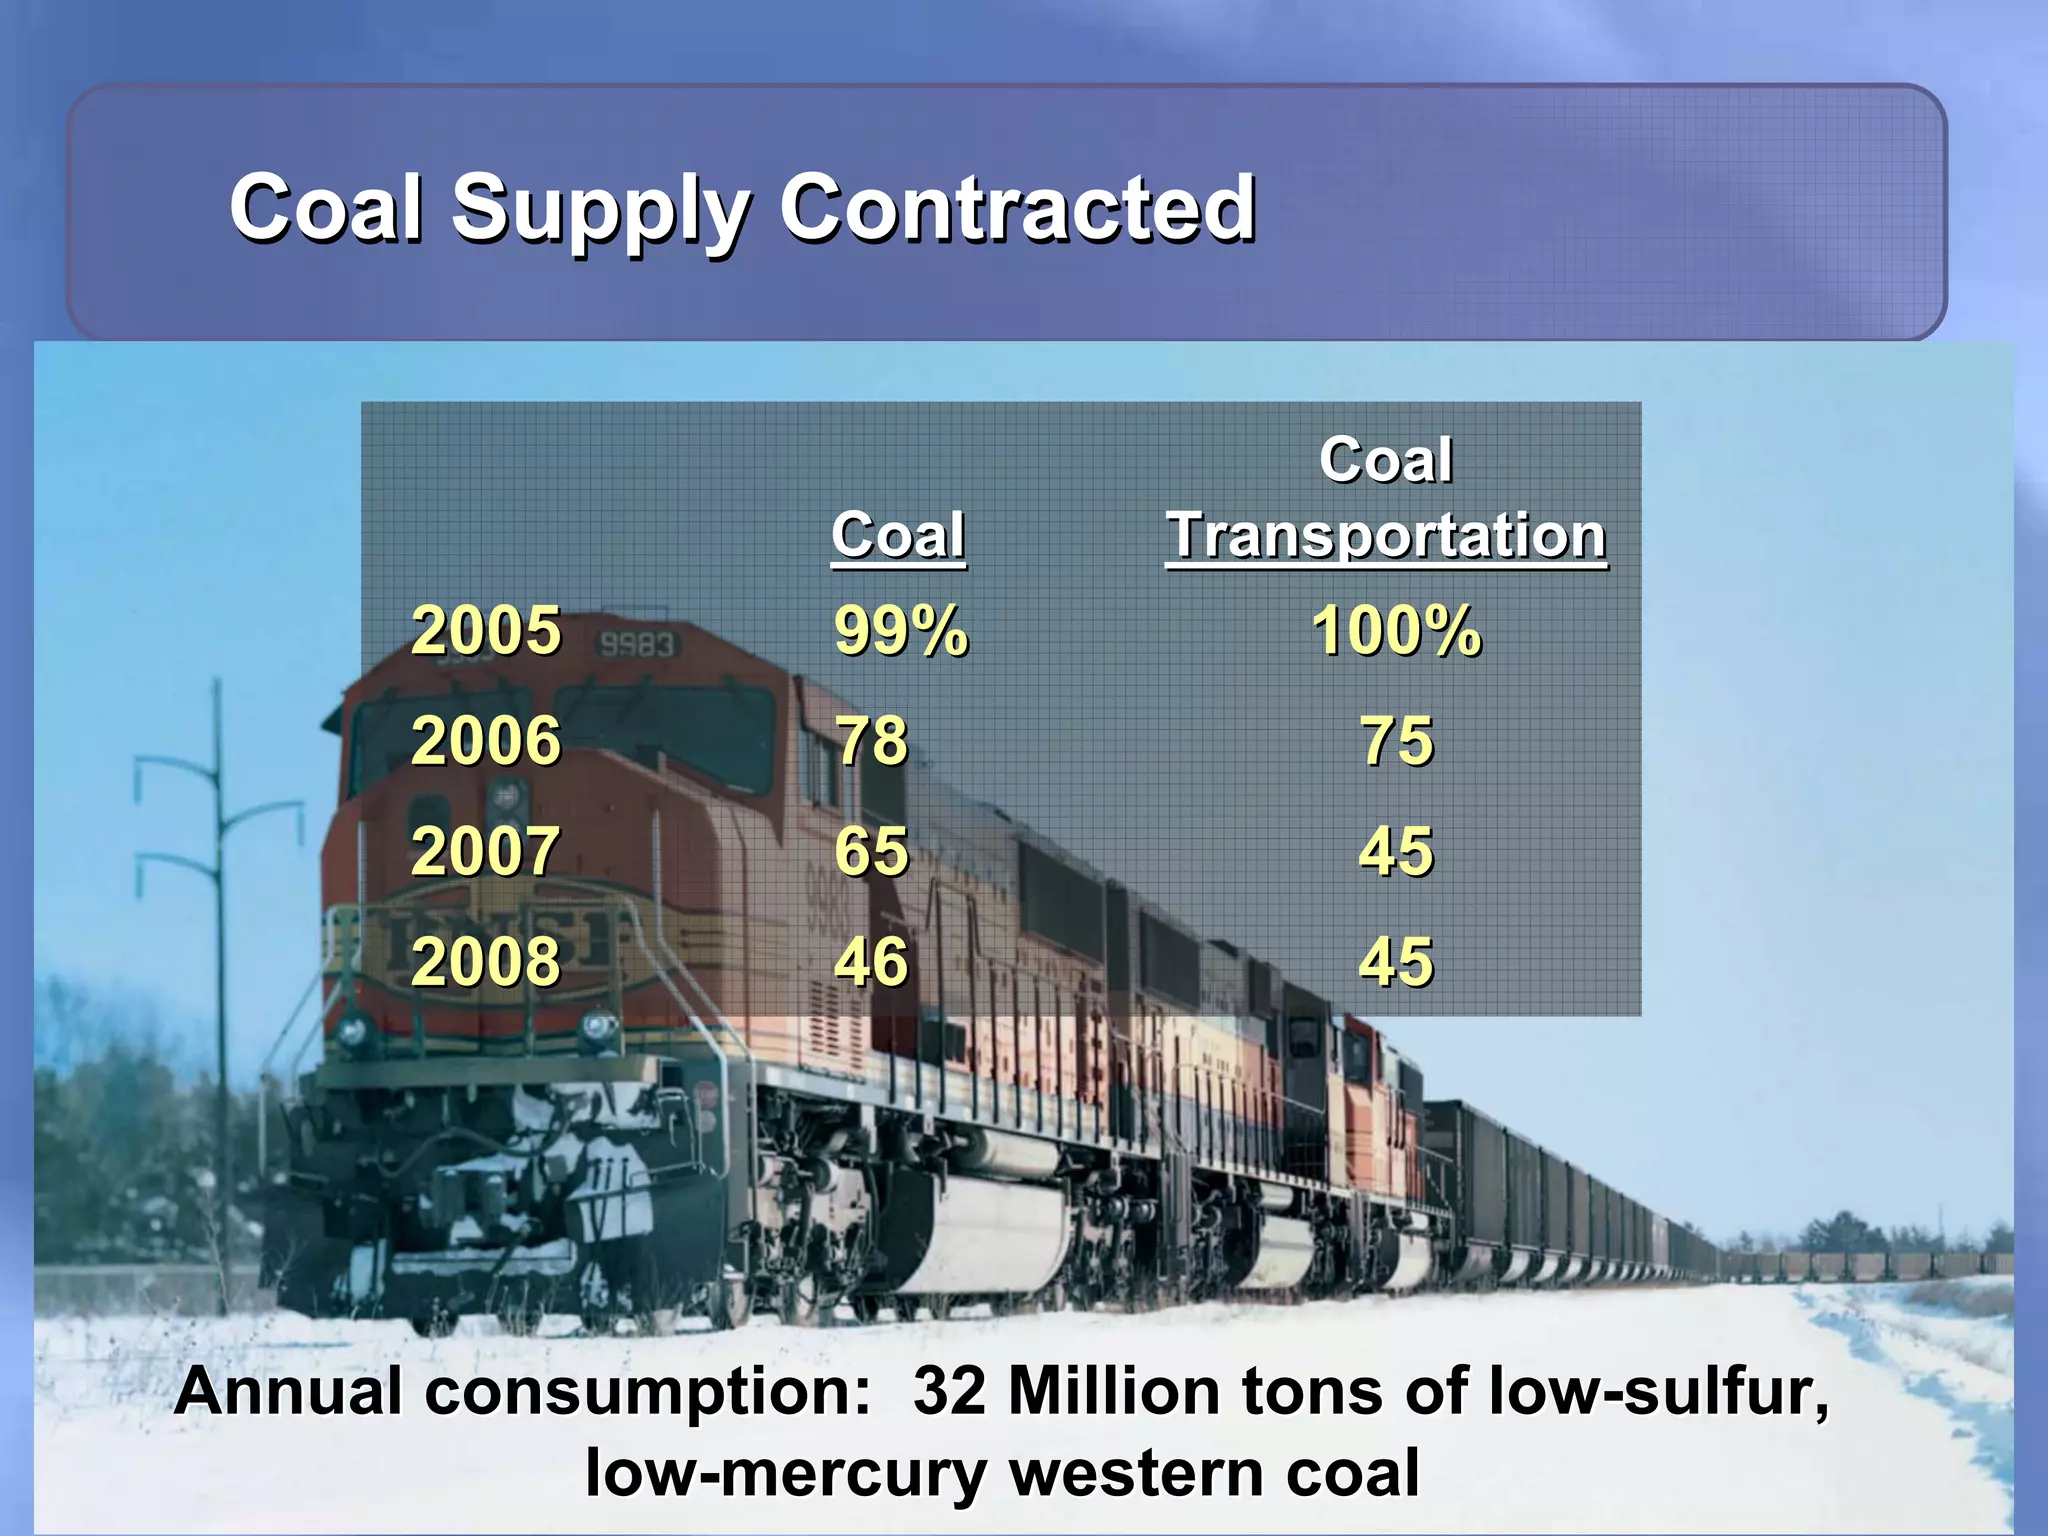
Deutsche Bank Electric Power Conference
            June 14 – 15, 2005
Safe Harbor
This material includes forward-looking statements that are subject to certain
risks, uncertainties and assumptions. Such forward-looking statements
include projected earnings, cash flows, capital expenditures and other
statements and are identified in this document by the words “anticipate,”
“estimate,” “expect,” “projected,” “objective,” “outlook,” “possible,”
“potential” and similar expressions. Actual results may vary materially.
Factors that could cause actual results to differ materially include, but are
not limited to: general economic conditions, including the availability of
credit, actions of rating agencies and their impact on capital expenditures;
business conditions in the energy industry; competitive factors; unusual
weather; effects of geopolitical events, including war and acts of terrorism;
changes in federal or state legislation; regulation; final approval and
implementation of the pending settlement of the securities, ERISA and
derivative litigation; costs and other effects of legal administrative
proceedings, settlements, investigations and claims; actions of accounting
regulatory bodies; risks associated with the California power market; the
higher degree of risk associated with Xcel Energy’s nonregulated businesses
compared with Xcel Energy’s regulated business; and other risk factors
listed from time to time by Xcel Energy in reports filed with the SEC,
including Exhibit 99.01 to Xcel Energy’s report on Form 10-K for year 2004.
Dick Kelly
President and Chief Operating Officer
Building the Core


Invest $6.9 billion in utility assets through 2009
                        AND
       Earn our allowed return on equity
Xcel Energy’s Capital Expenditure Plan

     Prudent

     Have regulatory, legislative
     and environmental support

     Manageable

     Add to earnings growth

     Deliver stronger credit metrics
Capital Expenditures $6.9 Billion
2005 – 2009

                          Customer Additions
  Mandated, Safety
                                27%
     & Other
       15%

  Replace,
 Refurbish,                             Comanche 3
  Upgrade                                  14%
    15%

 Nuclear Fuel
     5%                         MERP
             Generation          14%
                10%
Regulatory, Legislative
and Environmental Support

    Colorado MERP rider
    Minnesota MERP rider
    Comanche 3 decision — Forward CWIP
    and higher equity
    Minnesota transmission rider for renewables
    Minnesota and Texas transmission
    investment legislation
Minnesota Transmission Legislation
Senate File 1368

    Commission may approve rider recovery
    of new transmission investment
    Cash recovery on construction work
    in progress
    Return on equity at last allowed and
    provides for recovery above cost, if
    necessary, to improve economics or
    otherwise in the public interest
Texas Transmission Legislation
House Bill 989

    Commission may allow annual recovery of
    transmission infrastructure improvement

    Applies only in SPP or WECC power pools

    Awaiting governor’s signature
Capital Expenditure Outlook

     Relicensing nuclear plants

     Minnesota and Colorado resource needs

     CapEx 2020 — Minnesota transmission

     CAIR and mercury rules
Transparent Low-Risk Strategy

   Constructive legislative & regulatory climate

   Strategy delivers:
    — Competitive total return to shareholders
    — Improving credit metrics
Financial Overview


               Ben Fowke
Vice President and Chief Financial Officer
NSP — Minnesota Operating Company
  Capital Expenditure Forecast
  Dollars in millions

                        2005   2006     2007   2008     2009   Total
MERP                    $191   $404    $197    $125    $ 56    $ 973
Excluding MERP           454    428     516     446     549     2,393
Total                   $645   $832    $713    $571    $605    $3,366

                                      MERP                     $ 973
                                      Transmission                459
                                      Nuclear fuel                336
                                      Balance of electric       1,250
                                      Gas                         188
                                      Common                      160
                                      Total                    $3,366
NSP — Minnesota Rate Cases

North Dakota Gas   Approved June              $0.7 million
                                               increase
Minnesota Gas      Settlement pending         $5.8 million
                   10.4% ROE                  increase
                   Decision July 2005
Minnesota          To be filed Winter 2005
Electric           2006 test year
                   Interim rates early 2006
                   Decision Summer 2006
North Dakota       To be filed Winter 2005
Electric           Interim rates early 2006
                   Decision Summer 2006
South Dakota       To be filed mid-2006
Electric           Decision 2007
PSCo Operating Company
  Capital Expenditure Forecast
  Dollars in millions

                        2005   2006      2007    2008       2009   Total
Comanche 3              $ 59   $179      $287    $298       $125   $ 948
Excl. Comanche 3         366    320       306     293        363    1,648
Total                   $425   $499      $593    $591       $488   $2,596

                                      Comanche 3                   $ 948
                                      Transmission                    280
                                      Balance of electric             809
                                      Gas                             438
                                      Common                           98
                                      Thermal                          16
                                      Non-utility                       7
                                      Total                        $2,596
PSCo Rate Cases

 Colorado Gas        Filed May 27
                     Requested $33.4 million
                     11% ROE
                     55.49% common equity
                     Year-end rate base
                     Decision early 2006

 Colorado Electric   To be filed Spring 2006
                     Decision early 2007
SPS Operating Company
Capital Expenditure Forecast
Dollars in millions

                  2005     2006    2007    2008   2009   Total
   Total         $111      $90     $124   $116    $105   $546

                         Transmission                    $140
                         Balance of electric              406
                         Total electric                  $546


SPS Rate Cases
Texas electric              To be filed Summer 2006
New Mexico electric         To be filed 2006
NSP — Wisconsin Operating Company
Capital Expenditure Forecast
Dollars in millions

                  2005       2006     2007    2008   2009   Total
   Total              $60     $79     $75     $74    $68    $356

                            Transmission                    $ 73
                            Balance of electric              200
                            Gas                               45
                            Common                            38
                            Total                           $356
Wisconsin Electric and Gas Rate Case

Requested ROE 11.9%
Common equity ratio 56.32%
Electric requested: Revenue increase of $40.8 million
Gas requested: Revenue increase of $7.0 million
Rates expected to be in effect January 2006
Capital Expenditure Forecast
   Dollars in millions


                     2005      2006     2007   2008   2009    Total
Total               $1,241    $1,500   $1,505 $1,352 $1,266   $6,864


                     Anticipated Annual Growth in Average Rate Base
                                                            Average
                      2005    2006   2007    2008    2009    Annual
2004 Rate base
$10.5 billion            4%     4%      7%     5%     2%       4.4%
Potential Regulatory Income
      and Depreciation*
                                                               Potential Result
                                                   2004             2009
Average rate base                                 $10.5 B           $13 B
Regulatory equity ratio                            50.4%          50 – 52%
Equity rate base                                  $5.3 B        $6.5 – 6.76 B
Regulatory return on equity                         9.6%          10 – 11%
Regulatory net income                             $506 M       $650 – $744 M**
Depreciation – Cash flow                          $735 M          $910 M***
Potential regulatory net income
and depreciation from regulated
operations                                       $1,241 M $1,560 – $1,654 M
*     All figures except 2004 depreciation are on an estimated regulatory basis,
      which differs from GAAP reporting. A reconciliation from GAAP reporting
      is shown in the appendix on pages 24 and 25.
**    Calculated by multiplying equity rate base by regulatory return on equity.
***   Assumes depreciation grows at the same rate as rate base.
Sources of Funding

  Growing cash from operations

  Proceeds from asset sales and tax loss
  carry-forward

  Financing:
  — Dividend reinvestment and stock purchase
     program
  — Modest debt issuance
  — No equity issuance necessary through 2006

  Uncertain whether there is a need for public equity
  issuance in 2007 or 2008
Dividend

   Annual dividend increased by 3 cents May 2005

   Current annual dividend rate of 86 cents

   Annual dividend increases
   consistent with long-term
   earnings growth of 2 – 4%
Transparent Low-Risk Strategy

   Constructive legislative & regulatory climate

   Strategy delivers:
    — Competitive total return to shareholders
    — Improving credit metrics
Appendix
Rate Base and Returns
 Dollars in millions
                                 Rate Base   Earned   Auth-    Equity
                                   2004       ROE     orized   Ratio
                                  Average     2004     ROE      2004

Minnesota - Electric retail       $2,992     10.73%   11.47%   50.3%
Minnesota - Gas retail               402      8.50    11.40    50.3
North Dakota - Electric retail       166     10.80    12.00    50.3
North Dakota - Gas retail             39      8.18    11.50    47.6
Colorado - Electric retail         3,042      9.18    10.75    50.1
Colorado - Gas retail                996      8.76    11.00    50.1
Texas - Electric retail              889      9.39    11.50    48.7
NSP (W) - Retail electric            538       NR     11.90    55.8
NSP (W) - Retail gas                  70       NR     11.90    55.8
Non-reported                        1.4 B
Total including non-reported       10.5 B
NR: Non-reportable
Reconciliation of Estimated Regulatory
  Reporting from GAAP
                                                                           Dollars in millions
Common Equity
                                            NSP (M)     NSP (W)      PSCo        SPS     Total
2004 GAAP common stockholder’s equity (1)     $2,007       $433       $2,287     $781    $5,507
2003 GAAP common stockholder’s equity (1)      1,809        425        2,140      814     5,188
Average GAAP common stockholder’s equity       1,908        429        2,213      798     5,348
Adjustments                                       -5         -5           64      -11        43
Adjusted average equity for purposes of
   regulatory equity ratio                    $1,903       $424       $2,277     $787    $5,391


Debt
Source: 2004 Operating Company 10-K’s
                                   NSP (M)              NSP (W)      PSCo        SPS     Total
2004 GAAP total debt (1) (2)                  $2,032       $348       $2,502     $861    $5,743
2003 GAAP total debt (1) (2)                   2,003        337        1,845      825     5,010
Average GAAP total debt                        2,018        342        2,173      843     5,376
Adjustments                                     -140         -6           94      -16       -68
Adjusted average debt for purposes of
   regulatory equity ratio                    $1,878       $336       $2,267     $827    $5,308

Regulatory equity ratio                                                                   50.4%

(1) Source: 2004 Operating Company 10-K’s
(2) Consists of long-term debt, current portion of long-term debt and short-term debt
See note on the bottom of the following page for additional information
Reconciliation of Estimated Regulatory
  Reporting from GAAP (Continued)
                                                                          Dollars in millions
Net Income
                                          NSP (M)      NSP (W)      PSCo       SPS       Total
2004 GAAP net income (1)                    $230          $54        $218       $55       $557
Adjustments                                  -25                      -26                  -51
Adjusted net income for purposes of
   regulatory net income                    $205          $54        $192       $55       $506
Calculation of Regulatory Net Income
Estimated regulatory rate base ($10.5 B) x Regulatory equity ratio (50.4%)
    = Estimated equity rate base ($5.3 B)
Regulatory net income ($506 M) Ă· Estimated equity rate base ($5.3 B) = Estimated regulatory
   return on equity (9.6%)

Depreciation & Amortization – Cash Flows
                                          NSP (M)      NSP (W)      PSCo       SPS       Total
2004 GAAP depreciation
  and amortization – cash flow (1)          $352          $48        $234      $100       $735

(1) Source: 2004 Operating Company 10-K’s
Financial results for regulatory reporting frequently differ from GAAP.
Regulatory reporting includes the use of 12 and 13 month averages for capitalization, eliminates
inter-company transactions, excludes non-regulated investments, includes or excludes revenues
and or expenses associated with various recovery mechanisms and other factors, all of which may
vary from one regulatory jurisdiction to another.
Net Income Growth Potential

                                                   Annual
                                     2005 – 2009   Growth
                            2004      Potential     Rate

Rate base                  $10.5 B     $13 B         4.4%
Utility equity
capitalization              50%      50 – 52%      0 to 0.8%
Earned return on
utility rate base equity    9.7%     10 – 11%      0 to 2.6%
Strengthen Balance Sheet
with Increased Equity
                                            Net Income
                                            Sensitivity
                                          100 Basis Point
               Dec 31, 2004    Target       Change in
                 Equity        Equity      Equity Ratio
Company           Ratio        Ratio          Millions

NSP (M)            50%        49 to 51%        $3
NSP (W)            56         54 to 56          1
SPS                48         48 to 50          2
PSCo               48         55 to 56          4
Xcel Energy
consolidated       42         44 to 46
Earn Return Authorized by Regulators

                                         Net Income
                                         Sensitivity
                                       100 Basis Point
                        2004
                                      Change in ROE **
                     Rate Base *
                                           Millions
                      Billions
    Colorado           $4.0                $20
    Minnesota           3.4                 17
    Texas               0.9                  4
    Wisconsin           0.6                  3


    * State regulatory jurisdiction
    ** Assuming 50% common equity
Minnesota MERP — Potential Earnings
   Dollars in millions

                          2005     2006   2007    2008    2009
Capital expenditures
 Current year              $191    $404    $197    $125      $56
 Cumulative                $238    $642    $839    $964   $1,020
Equity ratio             48.5%    48.5%   48.5%   48.5%   48.5%
Return on equity         10.86%   10.86% 10.86% 10.86%    10.86%
Equity return               $8      $24     $40     $48     $53
Comanche 3 — Potential Earnings
  Dollars in Millions

                         2005     2006   2007    2008   2009
Capital expenditures
 Current year              $59    $179    $287   $298     $125
 Cumulative                $62    $241    $528   $826     $951
Equity ratio              56%      56%    56%     56%     56%
Return on equity        10.75%   10.75% 10.75% 10.75%   10.75%
Equity return              $2       $9    $23     $41      $54
2004 Earnings and 2005 Guidance
Dollars per share                             2005
                                   2004     Guidance
Regulated utility
continuing operations              $1.32    $1.27 – 1.37
Holding Company
finance costs                      (0.08)      (0.11)
Other nonregulated
& Holding Company                   0.03       0.02
Total earnings from
continuing operations              $1.27    $1.18 – 1.28
Discontinued operations            (0.40)
Total earnings per share diluted   $0.87
Coal Supply Contracted

                                  Coal
                   Coal      Transportation
       2005        99%            100%
       2006        78              75
       2007        65              45
       2008        46              45


Annual consumption: 32 Million tons of low-sulfur,
           low-mercury western coal
Electric Fuel and Purchased Energy
Cost Recovery Mechanisms
Minnesota:    Monthly recovery of prospective costs
Colorado:     Recovery of costs with sharing of
              deviations up to + $11.25 million
              from benchmark
Texas:        File for semi-annual adjustments –
              required if + 4% annually
Wisconsin:    Biennial rate case – file for interim
              adjustment if costs fall outside + 2%
              annually
New Mexico:   Recovery of costs with 2 month lag
Retail Electric Rate * Comparison

     Cents per KWh                 * EEI typical bills – Summer 2004
18
16
14
12
10
 8
                     6.01 6.06
 6
     4.87
 4
 2
 0
                          r                             i
      illo City ouis nve aul ines City ukee enix ago iam ston ork
    ar e . L                                                  Y
                                                cM
                  De St. P Mo sas ilwa Pho Chi          Bo ew
 m ak        t
AL         S                s
                      ls/ De Kan M                        N
    t
   l                p
 a
S                 M
xel_061405

More Related Content

Viewers also liked

xel 2000 ar2
xel 2000 ar2xel 2000 ar2
xel 2000 ar2finance26
 
YUM 09/23/08
YUM 09/23/08YUM 09/23/08
YUM 09/23/08finance26
 
xcel energy Regulation
xcel energy  Regulationxcel energy  Regulation
xcel energy Regulationfinance26
 
2007 Xcel 10-K
2007 Xcel 10-K2007 Xcel 10-K
2007 Xcel 10-Kfinance26
 
xcel energy Finance
xcel energy  Financexcel energy  Finance
xcel energy Financefinance26
 
xcel energy 10K_03/09/05
xcel energy 10K_03/09/05xcel energy 10K_03/09/05
xcel energy 10K_03/09/05finance26
 

Viewers also liked (6)

xel 2000 ar2
xel 2000 ar2xel 2000 ar2
xel 2000 ar2
 
YUM 09/23/08
YUM 09/23/08YUM 09/23/08
YUM 09/23/08
 
xcel energy Regulation
xcel energy  Regulationxcel energy  Regulation
xcel energy Regulation
 
2007 Xcel 10-K
2007 Xcel 10-K2007 Xcel 10-K
2007 Xcel 10-K
 
xcel energy Finance
xcel energy  Financexcel energy  Finance
xcel energy Finance
 
xcel energy 10K_03/09/05
xcel energy 10K_03/09/05xcel energy 10K_03/09/05
xcel energy 10K_03/09/05
 

Similar to xel_061405

xel_061405_print
xel_061405_printxel_061405_print
xel_061405_printfinance26
 
xel_061405_print
xel_061405_printxel_061405_print
xel_061405_printfinance26
 
XEL_032206
XEL_032206XEL_032206
XEL_032206finance26
 
XEL_032206
XEL_032206XEL_032206
XEL_032206finance26
 
xcel energy 4_10MinneapolisInvestorMtgSECApril2007
xcel energy  4_10MinneapolisInvestorMtgSECApril2007xcel energy  4_10MinneapolisInvestorMtgSECApril2007
xcel energy 4_10MinneapolisInvestorMtgSECApril2007finance26
 
xcel energy 4_10MinneapolisInvestorMtgSECApril2007
xcel energy  4_10MinneapolisInvestorMtgSECApril2007xcel energy  4_10MinneapolisInvestorMtgSECApril2007
xcel energy 4_10MinneapolisInvestorMtgSECApril2007finance26
 
5_2 AGASEC 04/29 /2007
5_2 AGASEC 04/29 /20075_2 AGASEC 04/29 /2007
5_2 AGASEC 04/29 /2007finance26
 
xcel energy 7258B9DD-EF98-40EE-97CF-0BFED2089B2B_0309_NEW4Texas-KCRoadshow
xcel energy  7258B9DD-EF98-40EE-97CF-0BFED2089B2B_0309_NEW4Texas-KCRoadshowxcel energy  7258B9DD-EF98-40EE-97CF-0BFED2089B2B_0309_NEW4Texas-KCRoadshow
xcel energy 7258B9DD-EF98-40EE-97CF-0BFED2089B2B_0309_NEW4Texas-KCRoadshowfinance26
 
xcel energy 5_25CanadianPresentation2007
xcel energy  5_25CanadianPresentation2007xcel energy  5_25CanadianPresentation2007
xcel energy 5_25CanadianPresentation2007finance26
 
xcel energy 5_25CanadianPresentation2007
xcel energy  5_25CanadianPresentation2007xcel energy  5_25CanadianPresentation2007
xcel energy 5_25CanadianPresentation2007finance26
 
XEL_031406
XEL_031406XEL_031406
XEL_031406finance26
 
XEL_031406
XEL_031406XEL_031406
XEL_031406finance26
 
XEL_031406
XEL_031406XEL_031406
XEL_031406finance26
 
xcel energy Lehman_Sept_2008-SEC
xcel energy  Lehman_Sept_2008-SECxcel energy  Lehman_Sept_2008-SEC
xcel energy Lehman_Sept_2008-SECfinance26
 
xcel energy Lehman_Sept_2008-SEC
xcel energy  Lehman_Sept_2008-SECxcel energy  Lehman_Sept_2008-SEC
xcel energy Lehman_Sept_2008-SECfinance26
 
xcel energy 3_19_2007MidwestInvMtgsSECMarch2007
xcel energy  3_19_2007MidwestInvMtgsSECMarch2007xcel energy  3_19_2007MidwestInvMtgsSECMarch2007
xcel energy 3_19_2007MidwestInvMtgsSECMarch2007finance26
 
xel_062106
xel_062106xel_062106
xel_062106finance26
 
xel_062106
xel_062106xel_062106
xel_062106finance26
 
EEI_1004
EEI_1004EEI_1004
EEI_1004finance26
 
xcel energy West_Coast_Road
xcel energy  West_Coast_Roadxcel energy  West_Coast_Road
xcel energy West_Coast_Roadfinance26
 

Similar to xel_061405 (20)

xel_061405_print
xel_061405_printxel_061405_print
xel_061405_print
 
xel_061405_print
xel_061405_printxel_061405_print
xel_061405_print
 
XEL_032206
XEL_032206XEL_032206
XEL_032206
 
XEL_032206
XEL_032206XEL_032206
XEL_032206
 
xcel energy 4_10MinneapolisInvestorMtgSECApril2007
xcel energy  4_10MinneapolisInvestorMtgSECApril2007xcel energy  4_10MinneapolisInvestorMtgSECApril2007
xcel energy 4_10MinneapolisInvestorMtgSECApril2007
 
xcel energy 4_10MinneapolisInvestorMtgSECApril2007
xcel energy  4_10MinneapolisInvestorMtgSECApril2007xcel energy  4_10MinneapolisInvestorMtgSECApril2007
xcel energy 4_10MinneapolisInvestorMtgSECApril2007
 
5_2 AGASEC 04/29 /2007
5_2 AGASEC 04/29 /20075_2 AGASEC 04/29 /2007
5_2 AGASEC 04/29 /2007
 
xcel energy 7258B9DD-EF98-40EE-97CF-0BFED2089B2B_0309_NEW4Texas-KCRoadshow
xcel energy  7258B9DD-EF98-40EE-97CF-0BFED2089B2B_0309_NEW4Texas-KCRoadshowxcel energy  7258B9DD-EF98-40EE-97CF-0BFED2089B2B_0309_NEW4Texas-KCRoadshow
xcel energy 7258B9DD-EF98-40EE-97CF-0BFED2089B2B_0309_NEW4Texas-KCRoadshow
 
xcel energy 5_25CanadianPresentation2007
xcel energy  5_25CanadianPresentation2007xcel energy  5_25CanadianPresentation2007
xcel energy 5_25CanadianPresentation2007
 
xcel energy 5_25CanadianPresentation2007
xcel energy  5_25CanadianPresentation2007xcel energy  5_25CanadianPresentation2007
xcel energy 5_25CanadianPresentation2007
 
XEL_031406
XEL_031406XEL_031406
XEL_031406
 
XEL_031406
XEL_031406XEL_031406
XEL_031406
 
XEL_031406
XEL_031406XEL_031406
XEL_031406
 
xcel energy Lehman_Sept_2008-SEC
xcel energy  Lehman_Sept_2008-SECxcel energy  Lehman_Sept_2008-SEC
xcel energy Lehman_Sept_2008-SEC
 
xcel energy Lehman_Sept_2008-SEC
xcel energy  Lehman_Sept_2008-SECxcel energy  Lehman_Sept_2008-SEC
xcel energy Lehman_Sept_2008-SEC
 
xcel energy 3_19_2007MidwestInvMtgsSECMarch2007
xcel energy  3_19_2007MidwestInvMtgsSECMarch2007xcel energy  3_19_2007MidwestInvMtgsSECMarch2007
xcel energy 3_19_2007MidwestInvMtgsSECMarch2007
 
xel_062106
xel_062106xel_062106
xel_062106
 
xel_062106
xel_062106xel_062106
xel_062106
 
EEI_1004
EEI_1004EEI_1004
EEI_1004
 
xcel energy West_Coast_Road
xcel energy  West_Coast_Roadxcel energy  West_Coast_Road
xcel energy West_Coast_Road
 

More from finance26

xcel energy merrill_09/16//03
xcel energy  merrill_09/16//03xcel energy  merrill_09/16//03
xcel energy merrill_09/16//03finance26
 
xcel energy merrill_09/16/03
xcel energy  merrill_09/16/03xcel energy  merrill_09/16/03
xcel energy merrill_09/16/03finance26
 
xcel energy merrill_09/16/03
xcel energy  merrill_09/16/03xcel energy  merrill_09/16/03
xcel energy merrill_09/16/03finance26
 
xcel energy BofA_09/16/03
xcel energy  BofA_09/16/03xcel energy  BofA_09/16/03
xcel energy BofA_09/16/03finance26
 
xcel energy BofA_09/16/03
xcel energy  BofA_09/16/03xcel energy  BofA_09/16/03
xcel energy BofA_09/16/03finance26
 
xcel energy BofA_09/16/03
xcel energy  BofA_09/16/03xcel energy  BofA_09/16/03
xcel energy BofA_09/16/03finance26
 
xel_102303b
xel_102303bxel_102303b
xel_102303bfinance26
 
xel_102303b
xel_102303bxel_102303b
xel_102303bfinance26
 
xel_102303b
xel_102303bxel_102303b
xel_102303bfinance26
 
xel_111403
xel_111403xel_111403
xel_111403finance26
 
xel_111403
xel_111403xel_111403
xel_111403finance26
 
xel_111403
xel_111403xel_111403
xel_111403finance26
 
xel_021104
xel_021104xel_021104
xel_021104finance26
 
xel_021104
xel_021104xel_021104
xel_021104finance26
 
xel_021104
xel_021104xel_021104
xel_021104finance26
 
xel_072804
xel_072804xel_072804
xel_072804finance26
 
xel_090804
xel_090804xel_090804
xel_090804finance26
 
xel_092404
xel_092404xel_092404
xel_092404finance26
 
xel_092404
xel_092404xel_092404
xel_092404finance26
 
xel_092404
xel_092404xel_092404
xel_092404finance26
 

More from finance26 (20)

xcel energy merrill_09/16//03
xcel energy  merrill_09/16//03xcel energy  merrill_09/16//03
xcel energy merrill_09/16//03
 
xcel energy merrill_09/16/03
xcel energy  merrill_09/16/03xcel energy  merrill_09/16/03
xcel energy merrill_09/16/03
 
xcel energy merrill_09/16/03
xcel energy  merrill_09/16/03xcel energy  merrill_09/16/03
xcel energy merrill_09/16/03
 
xcel energy BofA_09/16/03
xcel energy  BofA_09/16/03xcel energy  BofA_09/16/03
xcel energy BofA_09/16/03
 
xcel energy BofA_09/16/03
xcel energy  BofA_09/16/03xcel energy  BofA_09/16/03
xcel energy BofA_09/16/03
 
xcel energy BofA_09/16/03
xcel energy  BofA_09/16/03xcel energy  BofA_09/16/03
xcel energy BofA_09/16/03
 
xel_102303b
xel_102303bxel_102303b
xel_102303b
 
xel_102303b
xel_102303bxel_102303b
xel_102303b
 
xel_102303b
xel_102303bxel_102303b
xel_102303b
 
xel_111403
xel_111403xel_111403
xel_111403
 
xel_111403
xel_111403xel_111403
xel_111403
 
xel_111403
xel_111403xel_111403
xel_111403
 
xel_021104
xel_021104xel_021104
xel_021104
 
xel_021104
xel_021104xel_021104
xel_021104
 
xel_021104
xel_021104xel_021104
xel_021104
 
xel_072804
xel_072804xel_072804
xel_072804
 
xel_090804
xel_090804xel_090804
xel_090804
 
xel_092404
xel_092404xel_092404
xel_092404
 
xel_092404
xel_092404xel_092404
xel_092404
 
xel_092404
xel_092404xel_092404
xel_092404
 

Recently uploaded

Instant Issue Debit Cards - School Designs
Instant Issue Debit Cards - School DesignsInstant Issue Debit Cards - School Designs
Instant Issue Debit Cards - School Designsegoetzinger
 
call girls in Nand Nagri (DELHI) 🔝 >༒9953330565🔝 genuine Escort Service 🔝✔️✔️
call girls in  Nand Nagri (DELHI) 🔝 >༒9953330565🔝 genuine Escort Service 🔝✔️✔️call girls in  Nand Nagri (DELHI) 🔝 >༒9953330565🔝 genuine Escort Service 🔝✔️✔️
call girls in Nand Nagri (DELHI) 🔝 >༒9953330565🔝 genuine Escort Service 🔝✔️✔️9953056974 Low Rate Call Girls In Saket, Delhi NCR
 
Interimreport1 January–31 March2024 Elo Mutual Pension Insurance Company
Interimreport1 January–31 March2024 Elo Mutual Pension Insurance CompanyInterimreport1 January–31 March2024 Elo Mutual Pension Insurance Company
Interimreport1 January–31 March2024 Elo Mutual Pension Insurance CompanyTyöeläkeyhtiö Elo
 
Unveiling the Top Chartered Accountants in India and Their Staggering Net Worth
Unveiling the Top Chartered Accountants in India and Their Staggering Net WorthUnveiling the Top Chartered Accountants in India and Their Staggering Net Worth
Unveiling the Top Chartered Accountants in India and Their Staggering Net WorthShaheen Kumar
 
Call Girls Service Nagpur Maya Call 7001035870 Meet With Nagpur Escorts
Call Girls Service Nagpur Maya Call 7001035870 Meet With Nagpur EscortsCall Girls Service Nagpur Maya Call 7001035870 Meet With Nagpur Escorts
Call Girls Service Nagpur Maya Call 7001035870 Meet With Nagpur Escortsranjana rawat
 
The Triple Threat | Article on Global Resession | Harsh Kumar
The Triple Threat | Article on Global Resession | Harsh KumarThe Triple Threat | Article on Global Resession | Harsh Kumar
The Triple Threat | Article on Global Resession | Harsh KumarHarsh Kumar
 
Vip B Aizawl Call Girls #9907093804 Contact Number Escorts Service Aizawl
Vip B Aizawl Call Girls #9907093804 Contact Number Escorts Service AizawlVip B Aizawl Call Girls #9907093804 Contact Number Escorts Service Aizawl
Vip B Aizawl Call Girls #9907093804 Contact Number Escorts Service Aizawlmakika9823
 
BPPG response - Options for Defined Benefit schemes - 19Apr24.pdf
BPPG response - Options for Defined Benefit schemes - 19Apr24.pdfBPPG response - Options for Defined Benefit schemes - 19Apr24.pdf
BPPG response - Options for Defined Benefit schemes - 19Apr24.pdfHenry Tapper
 
VIP Kolkata Call Girl Serampore 👉 8250192130 Available With Room
VIP Kolkata Call Girl Serampore 👉 8250192130  Available With RoomVIP Kolkata Call Girl Serampore 👉 8250192130  Available With Room
VIP Kolkata Call Girl Serampore 👉 8250192130 Available With Roomdivyansh0kumar0
 
VIP Kolkata Call Girl Jodhpur Park 👉 8250192130 Available With Room
VIP Kolkata Call Girl Jodhpur Park 👉 8250192130  Available With RoomVIP Kolkata Call Girl Jodhpur Park 👉 8250192130  Available With Room
VIP Kolkata Call Girl Jodhpur Park 👉 8250192130 Available With Roomdivyansh0kumar0
 
Call Girls In Yusuf Sarai Women Seeking Men 9654467111
Call Girls In Yusuf Sarai Women Seeking Men 9654467111Call Girls In Yusuf Sarai Women Seeking Men 9654467111
Call Girls In Yusuf Sarai Women Seeking Men 9654467111Sapana Sha
 
Classical Theory of Macroeconomics by Adam Smith
Classical Theory of Macroeconomics by Adam SmithClassical Theory of Macroeconomics by Adam Smith
Classical Theory of Macroeconomics by Adam SmithAdamYassin2
 
Quantitative Analysis of Retail Sector Companies
Quantitative Analysis of Retail Sector CompaniesQuantitative Analysis of Retail Sector Companies
Quantitative Analysis of Retail Sector Companiesprashantbhati354
 
AfRESFullPaper22018EmpiricalPerformanceofRealEstateInvestmentTrustsandShareho...
AfRESFullPaper22018EmpiricalPerformanceofRealEstateInvestmentTrustsandShareho...AfRESFullPaper22018EmpiricalPerformanceofRealEstateInvestmentTrustsandShareho...
AfRESFullPaper22018EmpiricalPerformanceofRealEstateInvestmentTrustsandShareho...yordanosyohannes2
 
Lundin Gold April 2024 Corporate Presentation v4.pdf
Lundin Gold April 2024 Corporate Presentation v4.pdfLundin Gold April 2024 Corporate Presentation v4.pdf
Lundin Gold April 2024 Corporate Presentation v4.pdfAdnet Communications
 
government_intervention_in_business_ownership[1].pdf
government_intervention_in_business_ownership[1].pdfgovernment_intervention_in_business_ownership[1].pdf
government_intervention_in_business_ownership[1].pdfshaunmashale756
 
Andheri Call Girls In 9825968104 Mumbai Hot Models
Andheri Call Girls In 9825968104 Mumbai Hot ModelsAndheri Call Girls In 9825968104 Mumbai Hot Models
Andheri Call Girls In 9825968104 Mumbai Hot Modelshematsharma006
 
Attachment Of Assets......................
Attachment Of Assets......................Attachment Of Assets......................
Attachment Of Assets......................AmanBajaj36
 
Stock Market Brief Deck for 4/24/24 .pdf
Stock Market Brief Deck for 4/24/24 .pdfStock Market Brief Deck for 4/24/24 .pdf
Stock Market Brief Deck for 4/24/24 .pdfMichael Silva
 

Recently uploaded (20)

Instant Issue Debit Cards - School Designs
Instant Issue Debit Cards - School DesignsInstant Issue Debit Cards - School Designs
Instant Issue Debit Cards - School Designs
 
call girls in Nand Nagri (DELHI) 🔝 >༒9953330565🔝 genuine Escort Service 🔝✔️✔️
call girls in  Nand Nagri (DELHI) 🔝 >༒9953330565🔝 genuine Escort Service 🔝✔️✔️call girls in  Nand Nagri (DELHI) 🔝 >༒9953330565🔝 genuine Escort Service 🔝✔️✔️
call girls in Nand Nagri (DELHI) 🔝 >༒9953330565🔝 genuine Escort Service 🔝✔️✔️
 
Interimreport1 January–31 March2024 Elo Mutual Pension Insurance Company
Interimreport1 January–31 March2024 Elo Mutual Pension Insurance CompanyInterimreport1 January–31 March2024 Elo Mutual Pension Insurance Company
Interimreport1 January–31 March2024 Elo Mutual Pension Insurance Company
 
Unveiling the Top Chartered Accountants in India and Their Staggering Net Worth
Unveiling the Top Chartered Accountants in India and Their Staggering Net WorthUnveiling the Top Chartered Accountants in India and Their Staggering Net Worth
Unveiling the Top Chartered Accountants in India and Their Staggering Net Worth
 
Call Girls Service Nagpur Maya Call 7001035870 Meet With Nagpur Escorts
Call Girls Service Nagpur Maya Call 7001035870 Meet With Nagpur EscortsCall Girls Service Nagpur Maya Call 7001035870 Meet With Nagpur Escorts
Call Girls Service Nagpur Maya Call 7001035870 Meet With Nagpur Escorts
 
The Triple Threat | Article on Global Resession | Harsh Kumar
The Triple Threat | Article on Global Resession | Harsh KumarThe Triple Threat | Article on Global Resession | Harsh Kumar
The Triple Threat | Article on Global Resession | Harsh Kumar
 
Vip B Aizawl Call Girls #9907093804 Contact Number Escorts Service Aizawl
Vip B Aizawl Call Girls #9907093804 Contact Number Escorts Service AizawlVip B Aizawl Call Girls #9907093804 Contact Number Escorts Service Aizawl
Vip B Aizawl Call Girls #9907093804 Contact Number Escorts Service Aizawl
 
BPPG response - Options for Defined Benefit schemes - 19Apr24.pdf
BPPG response - Options for Defined Benefit schemes - 19Apr24.pdfBPPG response - Options for Defined Benefit schemes - 19Apr24.pdf
BPPG response - Options for Defined Benefit schemes - 19Apr24.pdf
 
VIP Kolkata Call Girl Serampore 👉 8250192130 Available With Room
VIP Kolkata Call Girl Serampore 👉 8250192130  Available With RoomVIP Kolkata Call Girl Serampore 👉 8250192130  Available With Room
VIP Kolkata Call Girl Serampore 👉 8250192130 Available With Room
 
VIP Kolkata Call Girl Jodhpur Park 👉 8250192130 Available With Room
VIP Kolkata Call Girl Jodhpur Park 👉 8250192130  Available With RoomVIP Kolkata Call Girl Jodhpur Park 👉 8250192130  Available With Room
VIP Kolkata Call Girl Jodhpur Park 👉 8250192130 Available With Room
 
Call Girls In Yusuf Sarai Women Seeking Men 9654467111
Call Girls In Yusuf Sarai Women Seeking Men 9654467111Call Girls In Yusuf Sarai Women Seeking Men 9654467111
Call Girls In Yusuf Sarai Women Seeking Men 9654467111
 
Commercial Bank Economic Capsule - April 2024
Commercial Bank Economic Capsule - April 2024Commercial Bank Economic Capsule - April 2024
Commercial Bank Economic Capsule - April 2024
 
Classical Theory of Macroeconomics by Adam Smith
Classical Theory of Macroeconomics by Adam SmithClassical Theory of Macroeconomics by Adam Smith
Classical Theory of Macroeconomics by Adam Smith
 
Quantitative Analysis of Retail Sector Companies
Quantitative Analysis of Retail Sector CompaniesQuantitative Analysis of Retail Sector Companies
Quantitative Analysis of Retail Sector Companies
 
AfRESFullPaper22018EmpiricalPerformanceofRealEstateInvestmentTrustsandShareho...
AfRESFullPaper22018EmpiricalPerformanceofRealEstateInvestmentTrustsandShareho...AfRESFullPaper22018EmpiricalPerformanceofRealEstateInvestmentTrustsandShareho...
AfRESFullPaper22018EmpiricalPerformanceofRealEstateInvestmentTrustsandShareho...
 
Lundin Gold April 2024 Corporate Presentation v4.pdf
Lundin Gold April 2024 Corporate Presentation v4.pdfLundin Gold April 2024 Corporate Presentation v4.pdf
Lundin Gold April 2024 Corporate Presentation v4.pdf
 
government_intervention_in_business_ownership[1].pdf
government_intervention_in_business_ownership[1].pdfgovernment_intervention_in_business_ownership[1].pdf
government_intervention_in_business_ownership[1].pdf
 
Andheri Call Girls In 9825968104 Mumbai Hot Models
Andheri Call Girls In 9825968104 Mumbai Hot ModelsAndheri Call Girls In 9825968104 Mumbai Hot Models
Andheri Call Girls In 9825968104 Mumbai Hot Models
 
Attachment Of Assets......................
Attachment Of Assets......................Attachment Of Assets......................
Attachment Of Assets......................
 
Stock Market Brief Deck for 4/24/24 .pdf
Stock Market Brief Deck for 4/24/24 .pdfStock Market Brief Deck for 4/24/24 .pdf
Stock Market Brief Deck for 4/24/24 .pdf
 

xel_061405

  • 1. Deutsche Bank Electric Power Conference June 14 – 15, 2005
  • 2. Safe Harbor This material includes forward-looking statements that are subject to certain risks, uncertainties and assumptions. Such forward-looking statements include projected earnings, cash flows, capital expenditures and other statements and are identified in this document by the words “anticipate,” “estimate,” “expect,” “projected,” “objective,” “outlook,” “possible,” “potential” and similar expressions. Actual results may vary materially. Factors that could cause actual results to differ materially include, but are not limited to: general economic conditions, including the availability of credit, actions of rating agencies and their impact on capital expenditures; business conditions in the energy industry; competitive factors; unusual weather; effects of geopolitical events, including war and acts of terrorism; changes in federal or state legislation; regulation; final approval and implementation of the pending settlement of the securities, ERISA and derivative litigation; costs and other effects of legal administrative proceedings, settlements, investigations and claims; actions of accounting regulatory bodies; risks associated with the California power market; the higher degree of risk associated with Xcel Energy’s nonregulated businesses compared with Xcel Energy’s regulated business; and other risk factors listed from time to time by Xcel Energy in reports filed with the SEC, including Exhibit 99.01 to Xcel Energy’s report on Form 10-K for year 2004.
  • 3. Dick Kelly President and Chief Operating Officer
  • 4. Building the Core Invest $6.9 billion in utility assets through 2009 AND Earn our allowed return on equity
  • 5. Xcel Energy’s Capital Expenditure Plan Prudent Have regulatory, legislative and environmental support Manageable Add to earnings growth Deliver stronger credit metrics
  • 6. Capital Expenditures $6.9 Billion 2005 – 2009 Customer Additions Mandated, Safety 27% & Other 15% Replace, Refurbish, Comanche 3 Upgrade 14% 15% Nuclear Fuel 5% MERP Generation 14% 10%
  • 7. Regulatory, Legislative and Environmental Support Colorado MERP rider Minnesota MERP rider Comanche 3 decision — Forward CWIP and higher equity Minnesota transmission rider for renewables Minnesota and Texas transmission investment legislation
  • 8. Minnesota Transmission Legislation Senate File 1368 Commission may approve rider recovery of new transmission investment Cash recovery on construction work in progress Return on equity at last allowed and provides for recovery above cost, if necessary, to improve economics or otherwise in the public interest
  • 9. Texas Transmission Legislation House Bill 989 Commission may allow annual recovery of transmission infrastructure improvement Applies only in SPP or WECC power pools Awaiting governor’s signature
  • 10. Capital Expenditure Outlook Relicensing nuclear plants Minnesota and Colorado resource needs CapEx 2020 — Minnesota transmission CAIR and mercury rules
  • 11. Transparent Low-Risk Strategy Constructive legislative & regulatory climate Strategy delivers: — Competitive total return to shareholders — Improving credit metrics
  • 12. Financial Overview Ben Fowke Vice President and Chief Financial Officer
  • 13. NSP — Minnesota Operating Company Capital Expenditure Forecast Dollars in millions 2005 2006 2007 2008 2009 Total MERP $191 $404 $197 $125 $ 56 $ 973 Excluding MERP 454 428 516 446 549 2,393 Total $645 $832 $713 $571 $605 $3,366 MERP $ 973 Transmission 459 Nuclear fuel 336 Balance of electric 1,250 Gas 188 Common 160 Total $3,366
  • 14. NSP — Minnesota Rate Cases North Dakota Gas Approved June $0.7 million increase Minnesota Gas Settlement pending $5.8 million 10.4% ROE increase Decision July 2005 Minnesota To be filed Winter 2005 Electric 2006 test year Interim rates early 2006 Decision Summer 2006 North Dakota To be filed Winter 2005 Electric Interim rates early 2006 Decision Summer 2006 South Dakota To be filed mid-2006 Electric Decision 2007
  • 15. PSCo Operating Company Capital Expenditure Forecast Dollars in millions 2005 2006 2007 2008 2009 Total Comanche 3 $ 59 $179 $287 $298 $125 $ 948 Excl. Comanche 3 366 320 306 293 363 1,648 Total $425 $499 $593 $591 $488 $2,596 Comanche 3 $ 948 Transmission 280 Balance of electric 809 Gas 438 Common 98 Thermal 16 Non-utility 7 Total $2,596
  • 16. PSCo Rate Cases Colorado Gas Filed May 27 Requested $33.4 million 11% ROE 55.49% common equity Year-end rate base Decision early 2006 Colorado Electric To be filed Spring 2006 Decision early 2007
  • 17. SPS Operating Company Capital Expenditure Forecast Dollars in millions 2005 2006 2007 2008 2009 Total Total $111 $90 $124 $116 $105 $546 Transmission $140 Balance of electric 406 Total electric $546 SPS Rate Cases Texas electric To be filed Summer 2006 New Mexico electric To be filed 2006
  • 18. NSP — Wisconsin Operating Company Capital Expenditure Forecast Dollars in millions 2005 2006 2007 2008 2009 Total Total $60 $79 $75 $74 $68 $356 Transmission $ 73 Balance of electric 200 Gas 45 Common 38 Total $356
  • 19. Wisconsin Electric and Gas Rate Case Requested ROE 11.9% Common equity ratio 56.32% Electric requested: Revenue increase of $40.8 million Gas requested: Revenue increase of $7.0 million Rates expected to be in effect January 2006
  • 20. Capital Expenditure Forecast Dollars in millions 2005 2006 2007 2008 2009 Total Total $1,241 $1,500 $1,505 $1,352 $1,266 $6,864 Anticipated Annual Growth in Average Rate Base Average 2005 2006 2007 2008 2009 Annual 2004 Rate base $10.5 billion 4% 4% 7% 5% 2% 4.4%
  • 21. Potential Regulatory Income and Depreciation* Potential Result 2004 2009 Average rate base $10.5 B $13 B Regulatory equity ratio 50.4% 50 – 52% Equity rate base $5.3 B $6.5 – 6.76 B Regulatory return on equity 9.6% 10 – 11% Regulatory net income $506 M $650 – $744 M** Depreciation – Cash flow $735 M $910 M*** Potential regulatory net income and depreciation from regulated operations $1,241 M $1,560 – $1,654 M * All figures except 2004 depreciation are on an estimated regulatory basis, which differs from GAAP reporting. A reconciliation from GAAP reporting is shown in the appendix on pages 24 and 25. ** Calculated by multiplying equity rate base by regulatory return on equity. *** Assumes depreciation grows at the same rate as rate base.
  • 22. Sources of Funding Growing cash from operations Proceeds from asset sales and tax loss carry-forward Financing: — Dividend reinvestment and stock purchase program — Modest debt issuance — No equity issuance necessary through 2006 Uncertain whether there is a need for public equity issuance in 2007 or 2008
  • 23. Dividend Annual dividend increased by 3 cents May 2005 Current annual dividend rate of 86 cents Annual dividend increases consistent with long-term earnings growth of 2 – 4%
  • 24. Transparent Low-Risk Strategy Constructive legislative & regulatory climate Strategy delivers: — Competitive total return to shareholders — Improving credit metrics
  • 25.
  • 27. Rate Base and Returns Dollars in millions Rate Base Earned Auth- Equity 2004 ROE orized Ratio Average 2004 ROE 2004 Minnesota - Electric retail $2,992 10.73% 11.47% 50.3% Minnesota - Gas retail 402 8.50 11.40 50.3 North Dakota - Electric retail 166 10.80 12.00 50.3 North Dakota - Gas retail 39 8.18 11.50 47.6 Colorado - Electric retail 3,042 9.18 10.75 50.1 Colorado - Gas retail 996 8.76 11.00 50.1 Texas - Electric retail 889 9.39 11.50 48.7 NSP (W) - Retail electric 538 NR 11.90 55.8 NSP (W) - Retail gas 70 NR 11.90 55.8 Non-reported 1.4 B Total including non-reported 10.5 B NR: Non-reportable
  • 28. Reconciliation of Estimated Regulatory Reporting from GAAP Dollars in millions Common Equity NSP (M) NSP (W) PSCo SPS Total 2004 GAAP common stockholder’s equity (1) $2,007 $433 $2,287 $781 $5,507 2003 GAAP common stockholder’s equity (1) 1,809 425 2,140 814 5,188 Average GAAP common stockholder’s equity 1,908 429 2,213 798 5,348 Adjustments -5 -5 64 -11 43 Adjusted average equity for purposes of regulatory equity ratio $1,903 $424 $2,277 $787 $5,391 Debt Source: 2004 Operating Company 10-K’s NSP (M) NSP (W) PSCo SPS Total 2004 GAAP total debt (1) (2) $2,032 $348 $2,502 $861 $5,743 2003 GAAP total debt (1) (2) 2,003 337 1,845 825 5,010 Average GAAP total debt 2,018 342 2,173 843 5,376 Adjustments -140 -6 94 -16 -68 Adjusted average debt for purposes of regulatory equity ratio $1,878 $336 $2,267 $827 $5,308 Regulatory equity ratio 50.4% (1) Source: 2004 Operating Company 10-K’s (2) Consists of long-term debt, current portion of long-term debt and short-term debt See note on the bottom of the following page for additional information
  • 29. Reconciliation of Estimated Regulatory Reporting from GAAP (Continued) Dollars in millions Net Income NSP (M) NSP (W) PSCo SPS Total 2004 GAAP net income (1) $230 $54 $218 $55 $557 Adjustments -25 -26 -51 Adjusted net income for purposes of regulatory net income $205 $54 $192 $55 $506 Calculation of Regulatory Net Income Estimated regulatory rate base ($10.5 B) x Regulatory equity ratio (50.4%) = Estimated equity rate base ($5.3 B) Regulatory net income ($506 M) Ă· Estimated equity rate base ($5.3 B) = Estimated regulatory return on equity (9.6%) Depreciation & Amortization – Cash Flows NSP (M) NSP (W) PSCo SPS Total 2004 GAAP depreciation and amortization – cash flow (1) $352 $48 $234 $100 $735 (1) Source: 2004 Operating Company 10-K’s Financial results for regulatory reporting frequently differ from GAAP. Regulatory reporting includes the use of 12 and 13 month averages for capitalization, eliminates inter-company transactions, excludes non-regulated investments, includes or excludes revenues and or expenses associated with various recovery mechanisms and other factors, all of which may vary from one regulatory jurisdiction to another.
  • 30. Net Income Growth Potential Annual 2005 – 2009 Growth 2004 Potential Rate Rate base $10.5 B $13 B 4.4% Utility equity capitalization 50% 50 – 52% 0 to 0.8% Earned return on utility rate base equity 9.7% 10 – 11% 0 to 2.6%
  • 31. Strengthen Balance Sheet with Increased Equity Net Income Sensitivity 100 Basis Point Dec 31, 2004 Target Change in Equity Equity Equity Ratio Company Ratio Ratio Millions NSP (M) 50% 49 to 51% $3 NSP (W) 56 54 to 56 1 SPS 48 48 to 50 2 PSCo 48 55 to 56 4 Xcel Energy consolidated 42 44 to 46
  • 32. Earn Return Authorized by Regulators Net Income Sensitivity 100 Basis Point 2004 Change in ROE ** Rate Base * Millions Billions Colorado $4.0 $20 Minnesota 3.4 17 Texas 0.9 4 Wisconsin 0.6 3 * State regulatory jurisdiction ** Assuming 50% common equity
  • 33. Minnesota MERP — Potential Earnings Dollars in millions 2005 2006 2007 2008 2009 Capital expenditures Current year $191 $404 $197 $125 $56 Cumulative $238 $642 $839 $964 $1,020 Equity ratio 48.5% 48.5% 48.5% 48.5% 48.5% Return on equity 10.86% 10.86% 10.86% 10.86% 10.86% Equity return $8 $24 $40 $48 $53
  • 34. Comanche 3 — Potential Earnings Dollars in Millions 2005 2006 2007 2008 2009 Capital expenditures Current year $59 $179 $287 $298 $125 Cumulative $62 $241 $528 $826 $951 Equity ratio 56% 56% 56% 56% 56% Return on equity 10.75% 10.75% 10.75% 10.75% 10.75% Equity return $2 $9 $23 $41 $54
  • 35. 2004 Earnings and 2005 Guidance Dollars per share 2005 2004 Guidance Regulated utility continuing operations $1.32 $1.27 – 1.37 Holding Company finance costs (0.08) (0.11) Other nonregulated & Holding Company 0.03 0.02 Total earnings from continuing operations $1.27 $1.18 – 1.28 Discontinued operations (0.40) Total earnings per share diluted $0.87
  • 36. Coal Supply Contracted Coal Coal Transportation 2005 99% 100% 2006 78 75 2007 65 45 2008 46 45 Annual consumption: 32 Million tons of low-sulfur, low-mercury western coal
  • 37. Electric Fuel and Purchased Energy Cost Recovery Mechanisms Minnesota: Monthly recovery of prospective costs Colorado: Recovery of costs with sharing of deviations up to + $11.25 million from benchmark Texas: File for semi-annual adjustments – required if + 4% annually Wisconsin: Biennial rate case – file for interim adjustment if costs fall outside + 2% annually New Mexico: Recovery of costs with 2 month lag
  • 38. Retail Electric Rate * Comparison Cents per KWh * EEI typical bills – Summer 2004 18 16 14 12 10 8 6.01 6.06 6 4.87 4 2 0 r i illo City ouis nve aul ines City ukee enix ago iam ston ork ar e . L Y cM De St. P Mo sas ilwa Pho Chi Bo ew m ak t AL S s ls/ De Kan M N t l p a S M