This document provides guidelines for conducting market and opinion research using the internet. It discusses basic principles such as ensuring voluntary participation, disclosing the researcher's identity, safeguarding respondent anonymity, using privacy policy statements, maintaining data security, addressing reliability and validity, guidelines for interviewing children, and restrictions on unsolicited email. It also provides additional guidance on these principles and guidelines for using internet access panels, including best practices for panel recruitment, project management, monitoring, maintenance, and privacy/data protection. The document aims to help researchers uphold ethical standards and comply with relevant laws and codes of practice when conducting internet-based research.
This document provides 26 questions for researchers to ask online sample providers to better evaluate their methodology and ensure sample quality. The questions cover topics like company profile, sample sources, panel recruitment, data quality validation, and privacy/compliance. The goal is to help researchers determine if a provider's online sampling approach is appropriate for their research objectives and needs.
The Obama 2008 presidential campaign utilized new media to build the Obama brand from low name recognition to the presidency over two years. [1] The campaign prioritized new media and staffed it equally with other divisions, gathering a database of 13 million supporters through compelling content on platforms like Facebook, YouTube, email and mobile. [2] Testing, measurement, and optimization were central to the data-driven new media strategy of fundraising, volunteer mobilization, and communicating a focused, consistent message of change. [3] Obama's grassroots, supporter-centered approach revolutionized political new media and helped him become the 2008 Marketer of the Year.
2009, Opera, State Of The Mobile Web, Mayinternetstats
This document summarizes Opera Mini's growth and performance in May 2009. Some key points:
- Opera Mini saw 8% growth in users since April and over 136% growth since May 2008.
- India moved up and Ukraine moved down in the top 10 countries by users. Southeast Asian countries also saw strong growth, particularly Vietnam which grew over 400% in users.
- Google and Yahoo remained the most used search engines overall, though regional players like Baidu and Yandex dominated in China and Russia.
- The mobile web continued expanding rapidly, with over 9.6 billion pages viewed on Opera Mini in May 2009, up 11% from April.
Opera Mini saw impressive growth in March 2009 with over 23 million unique users, an increase of 12.1% from the previous month. Total pages viewed increased 17.4% to over 8.6 billion and data consumed increased 19.3% to over 148 million MB. Chile surpassed Brazil as the top Latin American country for Opera Mini usage. Nigeria joined the top 10 global list for the first time. Country snapshots showed strong growth across many markets including Russia, Indonesia, China and others.
This document provides a summary of key digital marketing trends in 2008. It found that while internet usage grew, the economic slowdown caused declines in some areas like retail e-commerce and display advertising. Search and video continued to grow substantially. Top trends included a focus on jobs, coupons and politics websites due to the economy, as well as growth of social media and video sites like YouTube and Hulu. Google became the top overall website.
The document provides a summary of mobile web usage in 2008 based on data from the Opera Mini browser. It finds that social networking sites dominated mobile web traffic globally and in most countries. The top three social networks globally were VKontakte, Facebook, and Friendster. Facebook saw enormous growth rates in many countries like Indonesia (+4380%) and Egypt (+3400%). The document predicts continued strong growth in mobile web and social networking usage in 2009, especially in developing countries.
Over the past few years, listening to radio via the internet has grown significantly in the UK. The survey found that 14.5 million people, or 28.9% of UK adults, have listened to the radio online. 9.4 million people do so at least weekly. Listen Again services, which allow listening to missed broadcasts, are popular, with 9.3 million people using them. 6 million people have downloaded podcasts. The average podcast user subscribes to 3.59 podcasts and listens for just over an hour per week. Comedy and music are the most popular genres. iTunes is the most commonly used software for accessing podcasts. Podcasting appears to have a marginal positive impact on live radio listening.
Wyniki Wyszukiwania Googlea Satysfkacja Uzytkownikow
1. Wyniki wyszukiwania Google a satysfakcja użytkowników
BLUERANK | Gdańska 80 90-613 Łódź | tel. +48 42 632-33-21
Strona 1 z 4
Raport
Wyniki wyszukiwania Google
a satysfakcja użytkowników
Mamy przyjemność zaprezentować wyniki sondy zrealizowanej dla Bluerank przez IMAS International
za pomocą usługi Omnibus Online. Badanie przeprowadzone zostało na próbie 557 respondentów, w
wieku 18 – 54 lata. Sonda miała na celu zbadanie poziomu zadowolenia użytkowników wyszukiwarki
Google. Respondenci odpowiadali na trzy pytania, oceniając wiarygodność, przydatność oraz czytelność
wyników wyszukiwania.
Respondenci uważają wyniki wyszukiwania Google za przydatne
oraz prezentowane w sposób zrozumiały i przejrzysty,
ale nie są w pełni przekonani do wiarygodności rezultatów wyszukiwania.
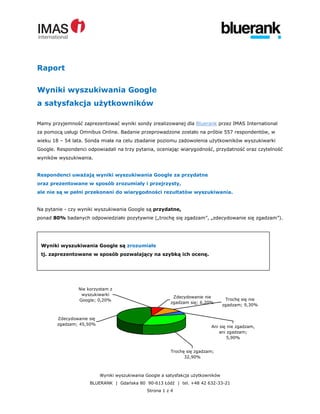
Na pytanie - czy wyniki wyszukiwania Google są przydatne,
ponad 80% badanych odpowiedziało pozytywnie („trochę się zgadzam”, „zdecydowanie się zgadzam”).
Ani się nie zgadzam,
ani zgadzam;
5,90%
Trochę się nie
zgadzam; 9,30%
Zdecydowanie nie
zgadzam się; 6,20%
Trochę się zgadzam;
32,90%
Nie korzystam z
wyszukiwarki
Google; 0,20%
Zdecydowanie się
zgadzam; 45,50%
Wyniki wyszukiwania Google są zrozumiałe
tj. zaprezentowane w sposób pozwalający na szybką ich ocenę.
2. Wyniki wyszukiwania Google a satysfakcja użytkowników
BLUERANK | Gdańska 80 90-613 Łódź | tel. +48 42 632-33-21
Strona 2 z 4
Natomiast już przy pytaniu - czy wyniki są wiarygodne,
pozytywnie wypowiedziało się tylko niecałe 70% respondentów.
Ani się nie zgadzam,
ani zgadzam;
7,20%
Trochę się nie
zgadzam; 17,60%
Zdecydowanie nie
zgadzam się; 5,30%
Trochę się zgadzam;
30,10%
Nie korzystam z
wyszukiwarki
Google; 0,20%
Zdecydowanie się
zgadzam; 39,60%
Najmniej wynikom wyszukiwania prezentowanym przez Google ufają osoby wykształcone,
w wieku 25 – 34 lata.
Na podstawie analizy odpowiedzi udzielanych przez respondentów (częstości ważone) zauważyć można
pewne prawidłowości, na przykład - osoby z grupy wiekowej 25 - 34 lata charakteryzuje nieco
mniejszy poziom zaufania do wyników wyszukiwania proponowanych przez wyszukiwarkę Google
(63,6%), niż w przypadku osób starszych (74,4%).
Wyniki wyszukiwania Google są wiarygodne
tj. nie wprowadzają w błąd, są zgodne z treścią, do której prowadzi link.
(podstawa - tylko odpowiedzi pozytywne, wg wieku)
Wyniki wyszukiwania Google są wiarygodne
tj. nie wprowadzają w błąd, są zgodne z treścią, do której prowadzi link
3. Wyniki wyszukiwania Google a satysfakcja użytkowników
BLUERANK | Gdańska 80 90-613 Łódź | tel. +48 42 632-33-21
Strona 3 z 4
50,00%
60,00%
70,00%
80,00%
18 - 24 lata 25 - 34 lata 35 - 44 lata 45 - 54 lata
Wraz ze wzrostem wieku, rośnie poziom akceptacji wyników, jako wiarygodnych. Jest tak
prawdopodobnie dlatego, że ludzie młodsi są bardziej świadomi technik SEO wpływających na algorytm
wyszukiwarki, co może tymczasowo wpływać na prezentowane rezultaty wyszukiwania. Ponadto,
przypuszczać można, iż ludzie starsi są mniej wybredni z racji krótkiego stażu w Internecie. Do
prezentowanych wyników wyszukiwania nie podchodzą selektywnie i krytycznie.
Warto również zauważyć, że osoby z wyższym wykształceniem reprezentują niższy poziom
zaufania do wyników wyszukiwania, niż osoby z wykształceniem średnim lub policealnym.
50,00%
60,00%
70,00%
80,00%
Podstawowe/
gimnazjum/
zawodowe
Średnie/policealne Wyższe/ licencjat
Prawdopodobnie jest to rezultat większej świadomości osób solidnie wykształconych, odnośnie praktyk
SEO uznawanych przez Google za niewłaściwe, a wpływających (tymczasowo) na wyniki wyszukiwania.
Wyniki wyszukiwania Google są wiarygodne
tj. nie wprowadzają w błąd, są zgodne z treścią, do której prowadzi link.
Podstawa - tylko odpowiedzi pozytywne, wg wykształcenia
4. Wyniki wyszukiwania Google a satysfakcja użytkowników
BLUERANK | Gdańska 80 90-613 Łódź | tel. +48 42 632-33-21
Strona 4 z 4
30% respondentów nie jest w pełni usatysfakcjonowanych wynikami wyszukiwania Google
Wyniki badania zadowolenia respondentów z uzyskiwanych w Google wyników wyszukiwania nie są tak
optymistyczne, jak może się to wydawać na pierwszy rzut oka. Co prawda sumarycznie – mamy 70%
zadowolonych użytkowników, ale jest także aż 30% tych, którzy nie są w pełni usatysfakcjonowani
tym, co prezentuje im Google!
Jedną z przyczyn takiego stanu rzeczy mogą być praktyki SEO (uznawane za nieuczciwe i
nieakceptowane przez Google), za sprawą których serwisy niższej jakości pojawiają się wysoko w
wynikach wyszukiwania. Działania w obrębie tzw. black hat SEO, takie jak: wykorzystywanie systemów
wymiany linków, stosowanie ukrytego tekstu na WWW lub osobne strony tworzone specjalnie dla
robotów Google… sprawiają, że internauci zorientowani na znalezienie (za pomocą wyszukiwarki)
konkretnych materiałów mają mniejsze zaufanie do wyświetlanych w Google wyników.
Google deklaruje nieustanne dążenie do stworzenia ‘idealnych’ algorytmów wyszukiwania, by kolejność
wyświetlanych wyników była w jak największym stopniu adekwatna do jakości witryn pojawiających się
na szczycie rezultatów wyszukiwania. Jeśli dołączyć do tego skuteczne wyeliminowanie (czy choćby
ograniczenie) praktyk black hat SEO, których dopuszczają się niektórzy webmasterzy… Jest duża
szansa na zwiększenie poziomu wiarygodności wyszukiwarki w oczach internautów.
Bluerank - agencja SEO / SEM specjalizująca się w planowaniu i realizacji międzynarodowych projektów search
engine marketing oraz search engine optimization. Działa na rynku austriackim, brytyjskim, niemieckim, polskim,
rosyjskim i węgierskim, jak również w Ameryce Północnej i Afryce, opracowując m.in. dla sektora 'classified media'
strategie pozycjonowania serwisów WWW w wyszukiwarkach lokalnych i globalnych, indywidualne rozwiązania na
potrzeby 'monetizing search' oraz wdrożenia 'usability of search'. Jako 'Google Qualified Company', oferuje również
kompleksową obsługę korporacji w zakresie reklamy typu PPC. Bluerank jest członkiem SEMPO - światowej
organizacji specjalistów związanych z SEM, a także IAB Polska (krajowy oddział Internet Advertising Bureau) -
stowarzyszenia profesjonalistów kształtujących rynek interaktywny na świecie).
http://www.bluerank.pl / http://bluerank.blogspot.com