Wyndham Midtown 45 Financial Analysis
•
1 like•328 views

The document provides information about the Wyndham Midtown 45 hotel in New York City. It was previously known as the Alex Hotel and was purchased by Wyndham Vacation Ownership in 2013 for $115 million. The 203-room hotel is located in Midtown Manhattan near Grand Central Terminal and attractions like the United Nations. While the hotel has recently underperformed financially, the document evaluates keeping it as a hotel versus converting it to a timeshare property. It provides details on the hotel's amenities, competitors in the area, and potential financial projections under different scenarios.

Recommended
Recommended
More Related Content
Similar to Wyndham Midtown 45 Financial Analysis
Similar to Wyndham Midtown 45 Financial Analysis (12)
Wyndham Midtown 45 Financial Analysis
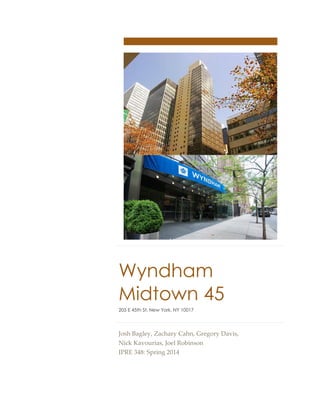
- 1. Wyndham Midtown 45 205 E 45th St, New York, NY 10017 Josh Bagley, Zachary Cahn, Gregory Davis, Nick Kavourias, Joel Robinson IPRE 348: Spring 2014
- 2. Wyndham Midtown 45 ii Wyndham Midtown 45 205 E 45th St, New York, NY 10017 Executive Summary This analysis of the Wyndham Midtown 45 Hotel, formerly known the Alex Hotel, will examine the hotel’s current standing and provide insight on the highest and best use of the asset. The Wyndham Midtown 45 Hotel, located at 205 East 45th Street, is a cornerstone of the midtown hotel market, yet is currently struggling to maintain an identity. The hotel, which is defined by 33 floors and 203 spacious rooms, was recently purchased by the Wyndham Vacation Ownership in February of 2013 for $115 million. Wyndham will begin converting rooms to timeshares in the near future. Still operating in the meantime as a four star hotel, the Wyndham is a great place to stay for a variety of different guests, and is located near key attractions like the United Nations building. Although the hotel has recently underperformed financially (81% occupancy with an ADR of $275 trailing 12 months ending October), we ultimately believe that the ownership of this asset should not convert the Wyndham into a timeshare property. Thus we will evaluate this asset as a hotel, but integrate the transition into our analysis of this asset as a whole.
- 3. Wyndham Midtown 45 iii Table of Contents Executive Summary.....................................................................................................................ii Hotel History & Structure........................................................................................................... 1 Hotel Location .............................................................................................................................. 2 Property Description ................................................................................................................... 6 Physical Structure .................................................................................................................... 6 David Rockwell ........................................................................................................................ 7 Amenities .................................................................................................................................. 9 Wyndham Worldwide .............................................................................................................. 12 Wyndham Worldwide Corporation.................................................................................... 12 Overview..........................................................................................................................................................12 Business Strategy.............................................................................................................................................14 Product Markets and Trends.........................................................................................................................15 Financial Resources.........................................................................................................................................16 Wyndham Worldwide and the Timeshare Industry ........................................................ 18 Manhattan Hospitality Industry.............................................................................................. 21 New York City Timeshares .................................................................................................. 21 The New York City Hotel Market ....................................................................................... 22 Macroeconomic Factors......................................................................................................... 29 Identified Hotel Guests ............................................................................................................. 30 Competitive Set Properties:...................................................................................................... 31 Fitzpatrick Grand Central Hotel.......................................................................................... 32 The Roger Smith Hotel.......................................................................................................... 33 Residence Inn New York Manhattan Midtown East ........................................................ 34
- 4. Wyndham Midtown 45 iv Affinia 50 ................................................................................................................................. 35 The Benjamin .......................................................................................................................... 36 Financial Analysis...................................................................................................................... 37 Financial Analysis Roadmap................................................................................................ 37 Section 1: RNAADR Analysis.......................................................................................................................38 Section 2: FIXVAR Analysis...........................................................................................................................38 Section 3: Equity Analysis..............................................................................................................................38 Most Likely Scenario Valuation of Wyndham Property...................................................... 39 Section 1: RNAADR Analysis .............................................................................................. 40 Competitive Set ...............................................................................................................................................40 Occupancy........................................................................................................................................................42 Secondary Competitors ..................................................................................................................................44 Supply and Demand.......................................................................................................................................46 Future Occupancy Rate Growth ...................................................................................................................50 Average Daily Rate .........................................................................................................................................50 FIXVAR Analysis- Most Likely Case .................................................................................. 52 Revenues ..........................................................................................................................................................53 Expenses ...........................................................................................................................................................55 Equity Valuation- Most likely Case..................................................................................... 56 Worst-Case Scenario Valuation of Wyndham Property....................................................... 61 FIXVAR WORST-CASE ........................................................................................................ 64 Equity Analysis Worst-Case..........................................................................................................................70 Best-Case Scenario Valuation of Wyndham Property.......................................................... 73 FIXVAR BEST-CASE ............................................................................................................. 76 Equity Analysis ...............................................................................................................................................78 Conclusion .................................................................................................................................. 82 Appendix....................................................................................Error! Bookmark not defined.
- 5. Wyndham Midtown 45 v
- 6. Wyndham Midtown 45 1 Hotel History & Structure The Alexico Group, led by Simon Elias and Izak Senbahar, previously owned the property before their fallout at the height of the financial crisis. Alexico also owned the Flatotel Hotel at at 135 West 52nd Street. The two hotels combined for a total of $368 million in liabilities in 2009, and thus the Alexico group defaulted on its loans. The joint venture of The Rockpoint, The Atlas, & The Procaccianti group purchased the debt on the two hotels, held by Anglo Irish Bank, at a discount in 2010 for an undisclosed sum, then sued to foreclose on the Alexico group. The Alexico group delayed the foreclosure on the two properties until 2012, when Elias and Senbahar eventually filed for bankruptcy protection. After much speculation of a sale, in February of 2013 the hotel was finally purchased by Wyndham Vacation Ownership for $115 million from the joint venture. Wyndham will be purchasing the property in pieces over the next three years, says the company. The 203-room hotel was renamed as the Wyndham Midtown 45, and will be converted to a time-share. It will be operated and managed by Wyndham Hotel Group, according to Jeff Wagoner, president of Wyndham Hotel Group Management.
- 7. Wyndham Midtown 45 2 Hotel Location The four-star Wyndham Midtown 45 hotel is located at 205 East 45th Street, right along 3rd Avenue in the Turtle Bay neighborhood. It is a convenient walk from Grand Central Terminal, five different subway lines, and beautiful Bryant Park. A short distance away, guests can enjoy high-end shopping along Fifth Avenue, or in the winter, ice skate in the iconic Rockefeller Plaza. The Wyndham Midtown 45 is surrounded by great places to eat, including the historic Palm Restaurant, Sparks Steakhouse, or one of Manhattan’s most famous Japanese restaurants, Sushi Yasuda. Late night, the property is a safe walking distance from some of the city’s most popular bars and clubs, such as The Perfect Pint and Whiskey Blue.
- 8. Wyndham Midtown 45 3 The hotel's location places it in a very convenient area for transit. Located next to 3rd Avenue, the hotel offers easy access to the Queens-Midtown Tunnel and the Queensboro Bridge. Both of these transit arteries offer quick access to the two Queens Airports (LaGuardia and John F. Kennedy) as well as an easy route to get out to Long Island. The proximity to FDR allows for guests to quickly move North or South along Manhattan. Using this highway is much faster than taking the streets to get around New York. A quick walk away from Grand Central Terminal allows guests easy access to Metro-North train service to the New York and Connecticut suburbs as well as some of the smaller cities located in the region. Subway access makes getting to Penn Station an easy trip, placing all of New Jersey (including Newark Airport) and Long Island within reach of a quick train ride. The Turtle Bay neighborhood houses a number of large companies. Many airlines have offices in this neighborhood including Avianca, Ethiopian Airlines, and Delta Airlines. Fujitsu also maintains a large office in this neighborhood. Just a few blocks away you will find the Chrysler Building and the MetLife building which both house a number of other large multi-national companies. These large companies combined with the busy retail corridors of Park Avenue and Lexington Avenue, and the bustling transportation hub of Grand Central Terminal place this hotel right in the middle of a powerhouse of economic activity.
- 9. Wyndham Midtown 45 4 For international delegates, the Wyndham Midtown 45 is an excellent choice as the United Nations is just a short walk away. The area also features a variety of diplomatic missions to the United States, which include: Consulate-General of the Bahamas Consulate-General of Germany Consulate-General of Israel in New York Consulate-General of Jamaica Consulate-General of Luxembourg Consulate-General of Nicaragua Consulate-General of Saudi Arabia Consulate-General of Singapore Consulate-General of Ukraine Consulate-General of the United Kingdom
- 10. Wyndham Midtown 45 5 Every other country that maintains a presence in the United Nations also has some form of diplomatic mission, and almost all are located in the Turtle Bay neighborhood with the hotel. This hotel has one of the shortest walking distances to the United Nations. Because of the United Nation's travel-centric nature, with diplomats frequently coming and going for events, it is only natural that they and their staff would want to stay at a hotel which is close by. This gives the hotel a very unique advantage that few others have; that of frequent travelers to the area for business. The Turtle Bay Association is one of the main unifying forces within this bustling neighborhood. It was founded in 1957 to ensure that the neighborhood kept its high quality of life. After a large amount of slaughterhouses were demolished in 1948 to make way for the United Nations and elevated trains were removed from the neighborhood, a vast expansion occurred which made it a much more modern and desirable place to live. The Association is responsible for the increase in landscaping throughout the neighborhood as well as scattered park-space. Despite all of the activity that occurs within this neighborhood it still maintains a serene atmosphere with tree- lined streets, a luxury in Manhattan.
- 11. Wyndham Midtown 45 6 Property Description Physical Structure Upon entering the lobby of this steel structured, brick and glass curtain walled building, one notices the tall ceilings and sleek, modern glass walls that are lit with soft, colorful lighting. A toasty inset gas fireplace warms the leather seating along the perimeter, around to the entrance of the modern-rustic style hotel bar. From the ceiling hang dimly lit chandeliers, glowing inside large, rusted iron cages. There is quaint ambience upon entering into the hotel. While many hotel owners would balk at the possibility of having a small lobby, but the Wyndham embraces this. This lobby gives the hotel a more intimate feeling. When a guest first arrives at the hotel they are not given the feeling that they are just another guest in a large sea of people, a feeling many hotels of this size and larger across the city give off. Instead, they are left with an impression that the hotel is much smaller and more exclusive.
- 12. Wyndham Midtown 45 7 The 203 guest rooms in the Wyndham Midtown 45 are larger than typical Manhattan hotel rooms and have an apartment-like feel. Each room is equipped with advanced technology capabilities, leather furnishings, and plush pillow-top bedding. Cream, beige, and chocolate accents lend an earthy vibe along with the custom blond wood furniture and accents. All features of wood and leather furniture were designed by architect David Rockwell and have been emulated by many around the city. David Rockwell David Rockwell is an American born architect and interior designer, drawing inspiration from his strong passion for theater, high-end crafts, and technology. He developed his skills and studied architecture at Syracuse University and the Architectural Association in London. In 1984, David Rockwell founded the Rockwell Group, a multi-disciplinary design and architecture firm, which is now composed of over 150 employees and has offices in the United States, Spain, and China. Combining David Rockwell’s personal inspirations with elements of local style, the Rockwell Group develops personalized narratives for each new project, including hotels, hospitals, Broadway sets, and museum exhibits.
- 13. Wyndham Midtown 45 8 David Rockwell has earned numerous honors and awards, including the National Design Award by the Smithsonian’s Cooper-Hewitt National Design Museum for outstanding achievement in Interior Design. He was also awarded the Presidential Design Award for the renovations to the Grand Central Terminal, and three Tony Award nominations for Best Scenic Design. The Rockwell Group was recognized by Fast Company Magazine as “one of the most innovative design practices” in their World’s 50 Most Innovative Companies issue. Grand Central Terminal
- 14. Wyndham Midtown 45 9 Amenities The property also features a variety of comprehensive amenities designed to cater to all guests possible needs. The hotel is host to the Atrium restaurant, a contemporary American style restaurant. This allows for a mix of both a traditional dining experience as well as in-room dining via room service. The restaurant also features as a bar, but this is not the typical hotel bar. Instead of just being a bar which caters to the hotel guests, this hotel has a bar which is very popular in the Midtown nightlife scene. It is a frequent occurrence for non-guests, such as those who live or work in the neighborhood to come here for a drink. This affords guests access to a quality New York City nightlife experience, without ever even having to put on a jacket. Having an impressive fitness center is a current industry edge, and the Wyndham Midtown 45 is embracing this; the hotel features a 24-hour fitness center filled with state-of-the-art equipment. While the gym was already considered modern by hotel standards, Wyndham decide to completely renovate it so much so that it could rival a guest's gym back home. . Additional services the hotel room service, a 24-hour valet parking service, a multilingual staff, free daily newspapers, free Wi-Fi, and even express dry-cleaning services. Combined with a fully equipped business center, this hotel provides the ideal balance for both leisure and business travelers.
- 15. Wyndham Midtown 45 10 The hotel is - the ideal location for hosting special events. It has a private dining room and suites for smaller events. The hotel’s integrated restaurant allows for it to cater any size event, from a small business meeting to a large wedding. Its Midtown Manhattan address makes it an easy property to get to for any type of event. There are five different room options to choose from: deluxe queen and king sized traditional rooms, studio, one bedroom, and two bedroom suites. Both deluxe queen and king sized rooms are over 350 square feet and offer city views. Studio suites are 400 square feet and feature a full kitchen and spectacular city views. All of the rooms are decorated in the same style with soft earth tones juxtaposed with sharp Scandinavian design. These are not your typical standard hotel rooms. Their
- 16. Wyndham Midtown 45 11 bold design sets them apart from many other hotels in the city. It adds a cosmopolitan atmosphere to any New York City trip, whether it is for business or for pleasure. The 103 studio, one bedroom and two bedroom suites offer multiple closets, Poggenpohl kitchens with Gaggenau cook tops and Sub Zero fridges. Additionally, there are Sharp flat-screen LCD TVs in every bedroom, living area, and even the bathrooms. Inside the limestone bathrooms there is immersive, glass enclosed, rain showers. The one bedroom suites are 600 square feet including a master bedroom with an ensuite bathroom and a walk-in closet, a separate living room, a full kitchen and city views. The two bedroom suites offer all the same amenities as single bedroom suites, but are 760 square feet. These suites offer better views than many New York City residents get.
- 17. Wyndham Midtown 45 12 Wyndham Worldwide Wyndham Worldwide Corporation Overview Wyndham Worldwide Corporation (NYSE: WYN) is a holding company founded in 2006 to act as a management group for the Wyndham Hotels Group and the
- 18. Wyndham Midtown 45 13 semi-independent RCI (formerly Resort Condominiums International). They are headquartered in Parsippany-Troy Hills, NJ and their current CEO is Stephen Holmes. The Wyndham Hotel Group is the group of hotel and resort chains owned, operated, or flagged by the company. The Wyndham Hotels brand, the company’s main brand, was founded in 1981 in Dallas, TX. The entire group consists of 7,400 hotels under 15 brands in 66 countries. Wyndham Hotel Group currently employs 4,000 worldwide employees. The Wyndham group has only partial market coverage, with flags (brands) spanning from budget/economy hotels to upper upscale hotels. The group does not currently have a luxury flag. The brands biggest competitors in order of total room count are the InterContinental Hotels Group (NYSE: IHG), Hilton Hotels (NYSE: HLT), and Marriott International (NASDAQ: MAR). While all three of these competitors have more rooms in total, Wyndham flags more hotels than any of them. Unlike Wyndham, all of these brands do operate at least one luxury flag. Overall the Wyndham group portfolio has grown from 2012 to 2013 by 2.3%. This growth is a good indicator of the brand’s strong position; and it is only marginally behind the growth of its top 3 competitors. They grew by 2.7%, 3.4%, and 2.7% respectively. For the two competitors ranked below it in terms of size, Choice Hotels and Accor, they shrank by 1.1% and 15.3% respectively. Wyndham should be well positioned in the market for the 2014.1 The Wyndham Hotel Management division is an offshoot of the main hotel operations. By leveraging Wyndham’s managerial experience, this division can effectively manage many upscale hotels, even ones not under any Wyndham flag. A large portion of the growth of the Wyndham hotel group is due to it acquiring additional hotels and brands. For hotels it flags, revenue is generated through a mix of a portion of revenue and flat fee. For hotels it operates it is the same structure, with a flat fee and a portion of revenue. For the few hotels it owns and the timeshares it sells, revenue is simply generated from the net income. 1 World Ranking 2013 of Hotel Groups and Brands http://www.hospitalitynet.org/news/4060119.html
- 19. Wyndham Midtown 45 14 RCI is a timeshare-trading network founded in 1974. It currently has 3.8 million members worldwide. The network does not own or develop any timeshares, however Wyndham does own and develop timeshares. Because of the way that the network is set up, this does not result in a conflict of interest. This also means that there is little Wyndham can do to use RCI to boost its own timeshare brand, nor can it suppress competitors. There are currently 6,300 affiliated resorts in over 100 countries. RCI’s revenues are fee based from transactions customers conduct through its system and membership dues. Its main competitors are Interval International, Dial and Exchange, and Trading Places International. It is the largest of all of its competitors. Business Strategy Wyndham’s driving corporate strategy is to cover as many locations with as many diversified hotels as the market can sustain. This is clearly evident too. Wyndham operates almost as many hotels as both Hilton Hotels and Marriott International combined the number 2 and 3 largest hotels. Wyndham is able to sustain this large amount of growth through its own supported new construction and flag deals for existing hotels to convert over to the Wyndham brand. It also uses its industry leading rewards program to keep travelers within the Wyndham family2 . Wyndham frequently cites this rewards program as one of the main drivers of sustained visits by guests in its investor conference calls. This strategy is also its biggest risk factor; it nearly caused the firm to go bankrupt in 1999 and forced it to undergo a major restructuring in 2004. Because of the competitive nature of the hospitality industry, there is also a risk that a different company’s actions could severely impact the brand and cause them to not reach revenue goals needed to sustain this growth. Some growth possibilities and drivers that Wyndham is considering are to better position the Wyndham flagship and Wingate brands as value-added alternatives to competing brands. They are also looking to better diversify their existing portfolio to maximize market potential. This will take the form of either hotels changing flags or new hotels being added to the Wyndham group. This is one of the main ways to optimize its economy and midscale portfolio and minimize competition among 2 Wyndham All-Brand Conference http://www.hospitalitynet.org/news/4048414.html
- 20. Wyndham Midtown 45 15 different flags. One of its continued growth drivers is to grow its international core brands: Wyndham, Ramada, Days Inn, Super 8, and Howard Johnson3 . This has been a successful expansion over past decade and something that the group plans to continue to push for. Product Markets and Trends From 2008 to 2013 there has been a steady amount of new hotel construction and openings that have happened. Between March 2008 and April 2013, a total of 89 new hotels were built in Manhattan alone. These hotels cumulatively added 15,799 rooms to the market. This accounts for a total market growth of 23.7%. Of those new hotels constructed, around 75% of the supply that entered the market entered in the period from March 2008 to December 2010. This is part of a general market prediction that after a recession the market tends to jump up, and new hotel owners were trying to capitalize upon that. It is likely that Wyndham will use this period to build out its current brands. The hotel group’s historical strategy has been to acquire brands and properties during 3 Wyndham Investor Presentation, http://www.corporate- ir.net/media_files/nys/wyn/s_rudnitsky_v2.pdf
- 21. Wyndham Midtown 45 16 economic downturns, and to build new properties with hotel owners as the economy improves. This trend is expected to continue and Wyndham has not indicated any deviation from this strategy. This current recession is proving to be much slower to exit than others in recent history. During the recession of the early 1990’s the trough, the lowest economic point, was reached in 27 months and the recession was considered over within 4 years. In the 2001 recession, the trough was reached sooner in 20 months, but it took about 4 years and 9 months for it to be considered over. The 2008 recession has been the most difficult for the country. Though the trough was reached in a comparatively quick 16 months the recession is predicted to until July 2014, a total of 5 years and 10 months. This slow recovery has prevented the big average daily rate (ADR, one of the standard measures for hotel profitability) increase that is usually seen after a recession. In April of 1992, the ADR change rate was at -5.2% which was its lowest. The peak following this was in October of 1998 with an ADR increase of 11.8%. While that is a gap of 6 years, it should be noted that the rate had been close to the October 1998 point since 1996. From the 2001 recession the market hit its lowest point in July of 2002 with its lowest point of a 17.2% decrease. The rebound in July of 2006 was roughly as large with an increase of 17.5% in average daily rates. With the 2008 recession these numbers have yet to be seen. The average daily rate dropped 22.7% in January of 2010, but it has only so far risen to a high of 10.1% in March of 2011. Given that the general trend calls for the largest increases around the 4-year mark, it is not untenable that the high point has not yet been reached. 4 Financial Resources5 The risk level of Wyndham Worldwide is considered average when compared with the rest of its industry. While its Beta of 1.32 is higher than many other firms within the hospitality index, it is only marginally higher. The company recently was 4 Manhattan Lodging Market: Why ADR Growth Is Lagging Behind the U.S. Average. March 2013 Issue. Pinnacle Advisory Group 5 Yahoo Finance
- 22. Wyndham Midtown 45 17 awarded a place on the Dow Jones Sustainable Growth Index, which is a key indicator of a very stable company. Analyst predictions for Wyndham estimate 4.2% growth this quarter, compared to an industry 70.10%. The current year it is expected to grow at 12.30% while the industry will grow at 41.60%. Next year’s growth predictions are 12.10% next year and the industry at 32.6%. Over the next five years growth is predicted at 12.29% with industry growth 21.66%. While it might seem that Wyndham is significantly behind industry growth, this is only because many other competitors are undergoing significant brand growth that Wyndham does not have to do because of its size and global presence. This is also why it is important to compare Wyndham to only its 3 main competitors and not the entire industry. As a large and well-established brand, many of the competitors that are causing the huge industry growth rates still cannot compete at the level of Wyndham. Based off of past performance and conservative future estimates, Wyndham should be able to easily meet these objectives. WYN IHG HLT MAR Stock Price (As of 2/28/14) 72.94 32.76 22.42 54.31 52 wk Range 52.84-75.25 32.55-32.78 22.08-22.58 38.17-54.32 1y Target Est 79.08 33.86 24.60 55.37 Trailing P/E 22.7 23.51 45.84 27.12 Forward P/E 15.12 19.73 28.37 19.10 PEG (5 Year) 1.32 2.71 1.74 1.68 Beta 1.32 1.36 N/A6 1.24 Revenue 5.01B 1.9B 9.43B 2.49B Net Income 432M 372M 450M 626M Total Debt 4.85B 1.28B 13.02B 3.15B 6 Not Available, HLT was first listed 12/12/13
- 23. Wyndham Midtown 45 18 Wyndham Worldwide and the Timeshare Industry Wyndam 45 Midtown is owned by Wyndham Worldwide, the parent company of hotels, resorts, and timeshare properties worldwide. Wyndham Worldwide timeshare business is managed by Wyndham Vacation Ownership, the world’s largest vacation ownership corporation, measured by the owners of vacation interests, individual ownership units, and the number of vacation ownership resorts. Wyndham Vacation Ownership has acquired or developed over 185 vacation ownership resorts, representing 23,000 individual ownership units and almost 1 million owners of vacation ownership interests. While headquartered in Orlando, Florida, Wyndham Vacation Ownership’s properties are spread throughout the United States, Mexico, Canada, The Caribbean, and the South Pacific. In 1991, Wyndham Vacation Ownership launched a point-based ownership system which revolutionized the timeshare industry. The system allows interest owners flexible options to choose the location, duration, timing, and accommodation options for their vacation interests, and helped Wyndham Vacation Ownership to become the largest vacation ownership company in the world. In the early and mid2000’s, the timeshare industry grew steadily, until sales dropped 8% to almost $10 billion in 2008. The following year, timeshare sales fell to just over $6 billion. The 36% decrease in sales in 2009 was mainly attributed to the mid-priced timeshare resorts unable to secure consumer financing.
- 24. Wyndham Midtown 45 19 Following the crash of the housing market, timeshare sales began to grow once again, and Wyndham Worldwide was prepared. With growth as the primary goal, Wyndham sought to increase their consumer base, and ultimately their bottom line. However, Wyndham realized that their current method of converting condos to timeshares was incredibly expensive and risky, with property and acquisition costs requiring the company to put up equity ranging from 20% to as high as 40% of costs. Chris Woronka, a lodging industry analyst at Deutsche Bank, claims that “Wall Street is telling [Wyndham] not to touch timeshare real estate”, leaving Wyndham Worldwide with very little long-term financing options. -As a result, Wyndham Vacation Ownership has most recently developed an innovative business model, the Wyndham Asset Affiliation Model. The new model utilizes Wyndham Vacation Ownership’s top-notch marketing and sales expertise to add additional, premiere vacation location options for interest owners by affiliating with world-class condominium resorts. Wyndham Vacation Ownership markets, develops, and sells its vacation ownership interests, as well as provides owners with consumer
- 25. Wyndham Midtown 45 20 financing, through its four primary brands, WorldMark by Wyndham, CLUB WYNDHAM, Shell Vacations Club, and Wyndham Vacation Resorts Asia Pacific. Wyndham Vacation Ownership’s Wyndham Asset Affiliation Model allows the company to convert condominiums into timeshare units, while they are still owned by the real estate developers and lenders in control of the resort. Wyndham has leveraged their knowledge of the timeshare industry to become a broker between timeshare buyers and developers who have limited access to the market. Wyndham’s strategy proved to be successful, as the company is maximizing its use of cash to increase profits and customer base. Tom Conforti, Wyndham Worldwide’s Chief Financial Officer, claims that sales commissions though the Wyndham Asset Affiliation Model are expected to average around 60%, or almost 10 times what a traditional real estate agent would earn selling a house. Along with Wyndham Vacation Ownership’s new strategy, the company expects about 65% of its overall profit to stem from customer financing activities offered through one of Wyndham’s four brands. While Wyndham Worldwide was one of the first timeshare resort companies to pioneer the “fee-for-service” model, they are not the only player in the market. In an analysis of
- 26. Wyndham Midtown 45 21 four top companies utilizing the “fee-for-service” model, together they generated net revenues of about $35 million in 2009. One year later, “fee-for-service” sales skyrocketed to almost $140 million for the industry, a 350% increase. This is an excellent sign that Wyndham has properly utilized their knowledge of the timeshare industry, as well as maximizing the value of their cash on hand to grow their business further. Manhattan Hospitality Industry New York City Timeshares The Manhattan Timeshare market is very thin in comparison to the hotel industry. It features two properties that dominate the market; the 300-unit Manhattan Club on West 56th Street and the 161-unit Hilton Grand Vacations Club on West 57th Street. The Manhattan Club has conveniently accommodated guests in the heart of Midtown for the last twenty years. In addition to the Hilton Grand Vacations Club, Hilton also owns 72 units on the top two floors of 1335 Sixth Avenue. In 2002, the company converted the top two floors of 1335 Sixth from hotel rooms into timeshares. Those timeshares sold out, and after its success, Hilton introduced the 57th Street ground-up timeshare in 2009 (TheRealDeal).
- 27. Wyndham Midtown 45 22 The New York City Hotel Market New York City remains to be one of the most expensive hotel markets in the United States. As of March 2013, according to HVS, the total room supply in Manhattan was approximately 29.5 million, generating total rooms revenue of $7.2 billion. Although total room supply in Manhattan accounted for 1.6% of the total supply in the United States, the market generates approximately 6.1% of total rooms revenue for the country. As of March 2013, the 348 hotels encompassing the entire New York City hotel market achieved an overall occupancy of 86.7 % at an average rate of approximately $280.00, compared to an occupancy level of 61.6 % at an average rate of $107.00 for the nation.
- 28. Wyndham Midtown 45 23 The graph below illustrates the fluctuation in NYC hotel performance from January 1987 to March 2013. The thick yellow, vertical lines represent the three recessions that have occurred during that time period, whilst the red and blue lines represent percent changes in hotel demand and supply (12-month moving averages), respectively. It is clear that in the periods shortly after each recession, demand for Manhattan lodging decreased significantly. After the most recent recession in 2008, which was the worst economic downturn since the Great Depression, New York City hotels experienced a decrease in demand of -4.3%, which was a significantly smaller decline compared to the previous two recessions. Furthermore, in 2010, NYC hotels experienced the largest post- recession percent increase in demand since the early ‘90’s. Despite a significant increase in supply, demand increased by 11.6% in August 2010, compared to 11%, 7.7%, and - 6.1% in 2004, 1995, and 1991, respectively.
- 29. Wyndham Midtown 45 24 One can make the claim that historically, the NYC Hotel market has been undersupplied. Over the last 25 years, average annual demand growth, at 2.1%, has outpaced corresponding growth in supply of 1.7%. This has translated well into high room rates and occupancies for New York City compared to national averages. However, there are concerns that new hotel supply entering the market over the next few years will drown demand. One of the main reasons why Manhattan is expected to see a drastic increase in hotel supply is because of record tourism numbers. According to The Real Deal, “the city saw approximately 54.3 million tourists in 2013, shattering 2012’s record of 52 million, and a 54 percent increase over 2002, the year after the September 11 terrorist attacks.” The numbers are only supposed to increase in 2014 with the hosting of Super Bowl XLVIII in New Jersey, which boosted hotel occupancies in both New Jersey and New York. According to HVS Hospitality Services’ Market Overview, the New York metro area average RevPAR will reach its highest levels in history by mid-year 2014, demonstrating a complete recovery from the challenges of the most recent recession. As large groups of travelers continue to emerge from Asia, South America, and Eastern Europe, potential for vast gains in the number of visitors to New York appear possible for the indefinite future. At the beginning of 2014, the city’s hotel inventory stood at an all-time high of about 99,000 rooms. From 2014 through 2016, an additional 84 hotels are expected to open, with most of them being in Manhattan 10 in Queens, nine in Brooklyn, three in Staten Island and one in the Bronx. They include the 330-room Bossert Hotel conversion in Brooklyn Heights; the renovation of the old Knickerbocker Hotel near Times Square into a 300-room full- service inn; a new 243-room Residence Inn by Marriott across from the new World Trade Center; and the Baccarat Hotel & Residences across from the Museum of Modern Art, which will have 114 rooms and 26 suites. Of the 28 Manhattan hotels projected to open this year, nine are in Midtown or Midtown South such as the 135-room Cambria
- 30. Wyndham Midtown 45 25 Suites Chelsea, being built on West 28th Street. Another nine are below 14th Street, including the 162-room Hotel Ludlow on the Lower East Side. Average room rates are expected to increase the most in 2014 on the East Side and Uptown, by about $15 a night from 2013. Rates in Times Square, Midtown, and Midtown South are expected to grow slightly less, by about $5-$10. Although this increase in supply has the potential to dampen room rates, economists at STR disagree. According to their research, at the end of 2013, average RevPAR for NYC hotels was $243. In 2014, it’s expected to reach a post-recession high of $264.91.
- 31. Wyndham Midtown 45 26 Researchers at STR are making the claim that RevPAR and ADR will increase in 2014, despite the drastic increase in hotel supply expected to incept in NYC’s near future. However, one can see how this is feasible due to the large amount of commercial office space expected to also come to market. Tens of millions of square feet of office space are due over the next few years, including the Hudson Yards project and the World Trade Center. According to the Real Deal, economists believe that this drastic increase in office square footage can be supported by the increase in hotel supply. As business travelers attend meetings at these new office locations, hotels included in this new supply will be able to support this increase in offices, business travelers, and demand. According to the graph below of forecasted supply and demand, which was created by HVS, the new supply of hotels created in 2014 is projected to outpace demand. However, in 2015, demand is supposed to grow past supply, possibly a result of the new office space coming to market.
- 32. Wyndham Midtown 45 27 The data below was taken from STR’s Forecast Report for New York City hotels as a whole, and was created in August 2013. STR has avoided disclosing the individual property information. The current average hotel occupancy in NYC for 2013 YTD is 82.5%. Average ADR and RevPAR for 2013 YTD were $241, and $199, respectively. Each of these figures represents positive growth from 2012. Occupancy (%) ADR ($) RevPAR ($) 2013 Q2 86.8% 267.0 231.91 2013 YTD 82.5% 240.5 198.54 2013 Q2 (% change year ago) 0.4% 3.7% 4.1% 2013 YTD (% change year ago) 3.3% 4.1% 7.5% Regional Forecasts
- 33. Wyndham Midtown 45 28 Annual Performance Occupancy ADR RevPAR Year % USD USD Actual 2009 77.0 216.3 166.5 2010 80.8 231.7 187.2 2011 81.2 244.6 198.5 2012 83.6 251.4 210.3 Forecast 2013 84.4 264.0 222.8 2014 82.1 272.1 223.4 2015 79.6 270.9 215.5 2016 79.0 276.3 218.4 2017 80.3 289.4 232.5 (Annual percentage change unless specified) 2011 2012 2013 2014 2015 2016 New York City GDP 0.8 1.2 2.7 3.7 3.4 3.7 City Employment 1.3 1.7 1.8 1.7 2.1 1.8 City Unemployment rate (%) 8.6 8.8 9.5 9.0 7.9 6.8 Household disposable income 0.3 0.9 -1.0 3.4 3.4 3.3
- 34. Wyndham Midtown 45 29 Every year over the last 5 years, New York City hotels have experienced a growth in occupancy, ADR, and RevPAR. However, STR has forecasted a decrease in occupancy through 2016, to only increase by 0.3% in 2016. This could be a result of the drastic increase in supply that expected in the New York City hotel market over the next few years. Despite this decline in occupancy, ADR is expected to increase through 2016, which is consistent with STR’s claim that ADR is expected to increase in 2014 to pre- recession highs of $300+. RevPAR is expected to fluctuate over the next several years. Macroeconomic Factors Based on the chart below, in terms of macroeconomic factors, the future is bright for the New York City economy. Based on annual percentage changes, City GDP, Employment, and Household disposable income are forecasted to increase through 2016. These are positive outlooks on the future NYC economy, which should translate into higher occupancies and rates for NYC hotels. The unemployment rate, which is closely tied to real estate demand across the country, is expected to decrease significantly through 2016, which will allow hotel owners to charge higher rates on rooms to earn more revenue and create more value for investors. Since the recession in 2008 and the bailouts of many U.S. financial services firms, the Fed has taken control of interest rates with the intent of encouraging consumer spending and keeping financing costs low. Janet Yellen, the new Federal Reserve chair, has made it clear that as long as the national unemployment rate is above 6.5% and the outlook on inflation does not exceed 2.5%, interest rates will not change. Each month since 2010, the Fed has been purchasing upwards of $80 billion of bonds each month to keep interest rates historically low, otherwise known as “quantitative easing”. Recently, however, the Fed has lowered this threshold to $65 billion of bonds per month (WSJ) As of the February 2014, the national unemployment rate was 6.7%. According to Bloomberg, the median forecast for unemployment, by a group of economists surveyed, was a decline to 6.2% in the fourth quarter. Consumer prices rose 1.2% in January from
- 35. Wyndham Midtown 45 30 a year earlier, a common metric used to measure annual inflation. After reviewing these statistics, there is possibility that by year-end 2014, the Fed could potentially decide to continue to “taper” or even end their bond-buying program, which will increase interest rates. This increase in interest rates will have a few implications on the market, the obvious one being an increase in borrowing costs. This could potentially have an adverse effect on development, making it harder to finance projects. An increase in interest rates will increase the cost of carrying credit for your customers, which could raise the issue of bad debt for hotel accountants Identified Hotel Guests The Wyndham houses many guests, but relies mostly on transient stays. With large rooms and access to full kitchens, the hotel is very attractive for larger parties looking to stay in midtown for a long-term stay. Because the Wyndham is one of the more affordable hotels in midtown, customers are often ones just looking for the best price. The property often markets on third party travel sites that attract such users. The hotel also benefits from the large number of corporate headquarters in midtown. Along with a number of different national embassies from the United Nations, large group customers include Cantor Fitzgerald, Six Flags, Viacom, and Univision Communications. The Wyndham cites this as one of the main reasons they would like to convert to timeshares. The supply of large group customers, who often have guests coming in and out of the
- 36. Wyndham Midtown 45 31 city, would benefit from this set up. Competitive Set Properties:
- 37. Wyndham Midtown 45 32 Fitzpatrick Grand Central Hotel 141 E 44th St New York, NY 10017 Rooms: 144 Suites: 11 Amenities: Complementary access to a nearby NY Sports Club 24-hour Valet Parking services Same day laundry and dry cleaning service The Wheeltapper- Onsite restaurant and bar equipped with a year-round outdoor patio The Wheeltapper patio serves as an event space for parties, special events, and receptions. Deluxe Queen- $199/night Deluxe Two Doubles- $249/night King Junior Suite- $269/night Garden Room West (Sleeps 2)- $299/night
- 38. Wyndham Midtown 45 33 The Roger Smith Hotel 501 Lexington Avenue New York, NY 10017 Rooms: 130 Amenities: Free WiFi Four distinct event spaces dedicated to hosting meetings and conferences. Lily’s Bar & Lounge- mezzanine level restaurant and bar, with private back room available Henry’s Rooftop Bar- open May to October Classic Queen- $139/night 2 Double Beds - $139/night Junior Suite Queen (with Sofabed)- $169/night Junior Suite 2 Doubles (with Sofabed)- $169/night One Bedroom Suite (1 King)- $239/night *All suites include kitchenettes
- 39. Wyndham Midtown 45 34 Residence Inn New York Manhattan Midtown East 148 East 48th Street New York, NY 10017 17 floors- 211 suites 4 meeting rooms, 1,320 sq ft of total meeting space Amenities: Free WiFi & Buffett Breakfast Full kitchens in every room 24-hour Business Center with access to computers and printers and quick-print stations Studio (1 King)- $179/night Studio (2 Queens)- $179/night Studio with balcony (1 King)- $199/night 1 Bedroom Suite (2 Queens) Sofabed- $279/night 1 Bedroom Executive Suite, (1 King) Sofabed, Corner room- $329/night
- 40. Wyndham Midtown 45 35 Affinia 50 155 East 50th Street New York, NY 10022 Recently completed renovation: 251 redesigned rooms including 100 with kitchens and 19 with terraces New restaurant in lobby: The Cupboard Amenities: Room Service 11:00 a.m.–11:00 p.m. Grocery shopping Business Center Continental Club Breakfast, served Monday - Friday in the Club Room Valet Parking 1 Guest Bedroom- $169/night Guest room Deluxe (1 King)- $179/night Guest room (2 Queens)- $219/night Studio suite w/ kitchenette (2 Queens)- $249/night
- 41. Wyndham Midtown 45 36 The Benjamin 125 East 50th Street New York, NY 10022 Guestrooms: 209 (all include kitchens, dining areas) 17 rooms with terraces 30-40 suites Amenities: 24-hour room service by Iron Chef Geoffrey Zakarian's restaurant, The National 24-hour fitness center on the 3rd floor High-speed Wi-Fi access - Complimentary Rates: Queen Guest room- $229/night King Studio - $249/night One Bedroom Suite- $349/night Terrace Suite- $409/night Two Bedroom Terrace Suite- $869/night
- 42. Wyndham Midtown 45 37 Financial Analysis Financial Analysis Roadmap The HVS valuation suite has been integral to our ability to value this property at its highest and best use. To better understand how we valued this hotel, we will first walk the reader through the three main valuation software files: first, the RNAADR Analysis, which allows us to forecast occupancy rates and average daily rates for the hotel over the next ten-years based on current market dynamics and future supply and demand growth. Then we focus on the main output from this analysis, yearly average daily rate, for the next ten-years. With our meticulously derived ADR, we can now begin calculating the room and other revenues/costs associated with the building in our FIXVAR analysis. Based on the revenues and expenses found in our ten-year analysis, we can finally solve for the net income of this property. With the net income (cash flows) carefully derived from the FIXVAR analysis, we can finally solve for the equity valuation for the property. The EQUITY analysis portion of this financial analysis suite will consider key inputs such as terminal cap rate, expected equity yield, and inflation, to solve for three equity values based on a 20 year amortized loan purchase of the building. We will first bring the user through these three reports to discover the most likely equity valuation scenario for this property. Once we derive this value, we will be able to change key inputs in our files to solve for the best-case and worst-case scenarios. With these values, we hope to provide the reader with an unbiased, yet detailed valuation for the Wyndham Midtown 45.
- 43. Wyndham Midtown 45 38 Section 1: RNAADR Analysis Purpose: Solve for the hotel’s expected occupancy rates and ADRs over the next ten- years based upon information provided about the hotel’s primary and secondary competitors, as well as, expected additions to supply. Section 2: FIXVAR Analysis Purpose: With our room revenue for the next ten-years solved for, the FIXVAR analysis allows us to add alternative expected revenues and costs: for example, food and beverage, property taxes, etc. With al revenues and expenses accounted for, we can finally solve for the ten-year net income expected for this property. Section 3: Equity Analysis Purpose: Finally, with the expected cash flows from the property accounted for, we can begin solving for the value of the hotel. We will use three approaches: a loan-to-value valuation, debt-coverage ratio valuation, and debt-yield valuation.
- 44. Wyndham Midtown 45 39 Most Likely Scenario Valuation of Wyndham Property (In the most likely scenario, we will be solving for the valuation of the hotel using input variables such as occupancy rate, ADR, cap rate, etc. that we believe should realistically occur. Following this valuation, we will also perform a best and worst-case scenario analysis.)
- 45. Wyndham Midtown 45 40 Section 1: RNAADR Analysis The goal of this section is to solve for the ten-year future Average Daily Room Rates of this hotel using historical information provided by Smith Travel Research and past income statements provided by the hotel. We will also be looking forward to estimates concerning the supply and demand dynamics of the Midtown Manhattan Hotel Market. Starting with the hotel’s 2013 performance, we will be able to value this hotel as of January 1, 2014. Competitive Set In order to find the value of this hotel property, we must first examine the addressable competition, supply, and demand trends in order to solve for the Wyndham Midtown’s ADR, projected ADR growth rate, occupancy rate, and projected occupancy rate growth. There are six properties that the Wyndham Midtown 45 identifies as being their closest competitors. These hotels, The Fitzpatrick Grand Central Hotel, The Rodger Smith Hotel, The Residence Inn New York Manhattan Midtown East, The Affinia 50 Hotel, and The Benjamin Hotel are of close geographical proximity, host guests of similar economic means, and are of comparable size (~200 rooms). (Google Maps- Midtown East)
- 46. Wyndham Midtown 45 41 Based on the Smith Travel Research reports provided by our property, we first examined the competitive set average for our group to the 12-month moving average ADR for the Wyndham provided by our property manager. Based on the proximity of these two numbers, we were able to confirm our belief that these properties were certainly comparable properties and realistic competitors. (STR – 2014) (RNAADR- Midtown East) Name of Establishment Class Rooms Fitzpatrick Grand Central Hotel Upscale Class 155 Wyndham Midtown 45 Upper Upscale Class 203 The Roger Smith Hotel Upscale Class 130 Residence Inn New York Manhattan Midtown East Upscale Class 211 Affinia 50 Luxury Class 209 The Benjamin Upper Upscale Class 209 # Rooms Date Opened During Base Year Historical ARC Occupancy % Wyndham Midtown 203 1/1/2014 203 81% Competitive Set 914 1/1/2014 914 81.4%
- 47. Wyndham Midtown 45 42 This competitive set, including the Wyndham hosts 1117 rooms, a total of 407,705 room nights per annum not contributing for losses/damages. Please see hotels listed below by class rating and room size. Occupancy The Wyndham Midtown 45, which boasts 203 spacious guestrooms, has done a good job keeping up with market occupancy rates in Midtown. The 12 month-moving average occupancy for the Wyndham Midtown is 81%. As you can see in the image below, the hotel was on par with its counterparts for 2013, only lagging by 0.4%. Over the last seven years, the competitive set has seen an average yearly occupancy of 82.6%. Due to lagging numbers in 2009 and 2010, we believe that this average occupancy is low and should stabilize in the 83 to 87 percent range. The properties most like the Wyndham include The Rodger Smith Hotel, The Residence Inn NY Midtown, and The Benjamin Hotel. These three hotels will serve as our primary competitors in this analysis. Our secondary competitors will be the Affinia 50 and the Fitzpatrick Hotel. Occupancy in this market, as you can see in the chart on the next page has a strong lower bound of 80% that the market will likely never break. However, as we can see when the occupancy rates start to rise in this market, we see additions to supply from new competition, which sharply brings down occupancy rates in to 80 to 82% range. This will be critical as we address the market dynamics of Midtown Manhattan over the next ten-years.
- 48. Wyndham Midtown 45 43 (STR- Midtown East) There are three particularly important market segments in Midtown. These include corporate, which is the largest, leisure, which is the second largest, and group, which makes up the third, but smallest market segment. Although this information is private and nearly impossible to get from competition, we estimate based off our property’s own performance that the corporate segment makes up 60% of sales, travel/leisure contributing 30% of sales, and group making up the final 10% of sales. Although we do not break down these segments in our RNAADR analysis, we have reason to believe that pricing in this market is consistent throughout the three groups. As we examine the timeshare conversion of this property, this market segmentation will be much more important. However, because we are valuing this property as a hotel, it is imperative that we maintain a consistent and objective look at these respective properties. With the occupancy rates we determined above, the Midtown hotel market should have sold 331,575 guest-rooms in 2013. Please see breakdown below. Occupancy (%) Total Year 83.5 2007 83.0 2008 78.6 2009 80.7 2010 85.0 2011 87.3 2012 81.4 2013 82.6 Avg
- 49. Wyndham Midtown 45 44 All Rooms Total Wyndham Midtown 60,017 60,017 Competitive Set 271,559 271,559 Total 331,575 331,575 (HVS RNAADR- Most Likely) Secondary Competitors The Wyndham Midtown has two competitors that we would consider being secondary competitors based on location, ADR, and class. These two hotels, the Affinia 50 and the Fitzpatrick are slightly nicer, boutique hotels, which cater to slightly wealthier patrons. These hotels’ performance will be weighted less once we begin determining the ADR output for this particular competitive set. # Rooms Date Opened During Base Year Historical ARC Comp. % Eff. HARC Occupancy % Affina 50 209 1/1/2014 209 100% 209 81% Fitzpatrick Hotel 155 1/1/2014 155 100% 155 81% (RNAADR- Midtown East) These hotels, which boast similar occupancy rates of 81.4%, hosted 108,148 guests in 2013, based on a 365 day year and no loss in room nights from damage or repairs. These
- 50. Wyndham Midtown 45 45 hotels are still strong competition in the market, but we will focus on the other hotels to better analyze key market dynamics, which will directly affect the Wyndham Midtown 45’s financial performance. All Rooms Total Affina 50 62,096 62,096 Fitzpatrick Hotel 46,052 46,052 Total 108,148 108,148 (RNAADR- Midtown East)
- 51. Wyndham Midtown 45 46 Supply and Demand With our occupancy rates determined, we can now examine the supply and demand dynamics playing in this market. Based on our selected competitive set, the Wyndham Midtown makes up 13.6% of market share compared to like sized, geographically located, and priced properties. Please see the breakdown of market share on the page below: (HVS RNAADR- Most Likely) The supply and demand in East Midtown has been greatly affected over the last five years due to the economic recession. As seen below, little to no supply has been Room Nights Captured by Market Segment All Rooms Total Room Nights Market Share Fair Share Overall Comp Index Wyndham Midtown 60,017 60,017 13.6% 13.7% 99.6% Competitive Set 271,559 271,559 61.8% 61.7% 100.1% Primary Market Total: 331,575 331,575 Affina 50 62,096 62,096 Fitzpatrick Hotel 46,052 46,052 Secondary Market Total: 108,148 108,148 24.6% 24.6% 100.1% Total 439,724 439,724
- 52. Wyndham Midtown 45 47 added to this market. Drops in demand brought tough times for East Midtown Manhattan hotel operators, but sharp bounce backs in 2012 and 2013 have given many hotel owners a reason to be optimistic. Demand (Room Nights) Total Year YEAR 335,215 2007 333,053 2008 315,723 2009 286,352 2010 282,229 2011 289,241 2012 322,371 2013 309,169 Average (STR- Midtown East) In order to determine forward looking demand growth, we will use the Smith Travel Research files to examine both the last seven years and the next 4 to try to determine a stabilized forward looking rate. Due to the sporadic demand growth rates caused by the economic recession, we will rely more heavily on STR’s forward-looking rates. Solving for an average of old growth rates is no longer an option for this property. Here we solved for a weighted average growth rate, placing a greater weight on the forecasted rates. Based on these numbers, we expect demand to grow by 2.9% in the East Midtown Manhattan market.
- 53. Wyndham Midtown 45 48 Demand Year % Change 2009 -0.7% 2010 10.5% 2011 5.7% 2012 5.7% 2013 4.4% 2014 4.3% 2015 1.5% 2016 1.8% 2017 1.6% (STR- Midtown East) 2007 2008 2009 2010 2011 2012 Room Demand 335,215 333,053 315,723 286,352 282,229 289,241 Room Supply 401,500 401,500 401,500 354,950 332,150 331,385 Market Occupancy 83.49% 82.95% 78.64% 80.67% 84.97% 87.28% (RNAADR- Midtown East)
- 54. Wyndham Midtown 45 49 5 Years 4 Years 3 Years 2 Years 1 Year Compound Growth In Demand -2.91% -3.46% -2.88% 0.50% 2.48% Compound Growth In Supply -3.77% -4.68% -6.20% -3.38% -0.23% (RNAADR- Midtown East) With our key inputs fully examined, we can now create educated estimates regarding the demand and supply growth in the Midtown Manhattan hotel market. Based on the erratic economic decline and growth we have seen over the last five or six years, it is tough to simply average the demand and supply numbers together and create a forward looking figure. Thus we put more emphasis on the 2011 and 2012 numbers to create figures for this market. Justifying our demand growth numbers on the 2 to 3% growth rates we have seen in 2011 and 2012, we believe that 2.9% demand growth is a reasonable estimate, especially with the economy continuing to improve. Supply growth is making a steady comeback, which is likely to make many players in this market nervous. However, before we decide on a consistent supply growth rate, we must first consider new hotels coming to this market. The hotel coming to this market next, which will make the largest impact on Midtown is the NY YIMBY. With a forward-looking, stabilized demand rate, we must now examine the new supply Supply Room Nights Total Year YEAR 401,500 2007 401,500 2008 401,500 2009 354,950 2010 332,150 2011 331,385 2012 395,842 2013 374,118 Average
- 55. Wyndham Midtown 45 50 coming to the market. One hotel in particular, the YIMBY Midtown will be adding 93 rooms a night to the market on 1/1/15. The 93-room luxury boutique hotel with spa, rooftop bar and lounge will be a force to reckon with. The new hotel will likely be pricier than the hotels in our competitive set; however, new supply will certainly affect this market. Based on our Smith Travel Research reports, we expect an assumed compound supply growth rate of 2% in this market. There are many obstacles to joining this market. With lots of empty rooms, many developers are looking in other areas. Although this 2% rate seems a bit pessimistic, we are fairly confident East Midtown hotels have limited new supply risk at this time. Based on these additions to supply, we can now analyze the market occupancy rates expected for the next ten-years. With these numbers, we can now evaluate the expected occupancy rates for the Wyndham Midtown, the primary competitors, and the secondary competitors. Future Occupancy Rate Growth After strong performance in the previous two years, we expect market occupancy rates to grow in 2014. However, beginning in 2015, we expect occupancy rates for this market to take a small hit due to the increased supply from the NY YIMBY. Once the market stabilizes, we expect the market to come back steadily to the 81% to 86% range in the 2020s. As we previously discussed, the renovations to the Wyndham Hotel will likely increase demand in the next few years. Hotels closer to the Aloft will be hurt, so when the hotel goes into operation in 2015 and 2016, we expect to see Wyndham’s rising occupancy rate slip a bit back down to the 80%-81% range. Based on our limited future supply growth rate, we expect that Wyndham Midtown will steadily remain in this range. Towards the end of the ten-year holding period, however, we expect this property to start to underperform due to outdated amenities and rooms. Please see Appendix A for our occupancy analysis for the Wyndham and Appendix B for the occupancy analysis of the competitive set. Average Daily Rate The Wyndham Midtown performed on par with the market in 2013 with a $275 ADR. Only outperforming the Wyndham by 1%, the competitive set saw an average ADR of ~$278.
- 56. Wyndham Midtown 45 51 ADR Total Year YEAR 306.92 2007 311.87 2008 234.32 2009 259.55 2010 276.82 2011 273.45 2012 278.59 2013 278.21 AVERAGE (HVS- Midtown East) As we would have guessed, this competitive set saw large decreases in ADR due to the financial crisis. In 2007, ADR was $306. We expect this competitive set to hit this level in the next two or three years, then steadily grow past it in the next five to seven years. Based on ADR inflation in the East Midtown market, we expect a 3.0% increase over the next 10 years. Based on the last five years, we have seen large fluctuations in growth rates. As markets grow and the economy improves, the inflation rate is likely to rise. A steady 3.0% lets us account for the fluctuating nature in which inflation can grow. Below is a graph depicting the ADR we expect to received over the next 10 years based on all of the information we solved for in the RNAADR analysis.
- 57. Wyndham Midtown 45 52 2013 2014 2015 2016 2017 2018 2019 2020 2021 2022 2023 $ 275.00 $ 283.25 $ 291.75 $ 300.50 $ 309.51 $ 318.80 $ 328.36 $ 338.22 $ 348.36 $ 358.81 $ 369.58 (RNAADR- Midtown East) Based on the expected ADR and occupancy rates supplied in the previous appendices, we expect the room revenues provided in chart below, seen in thousands of dollars. With expected room revenue of $17,216,011 in 2014, we can now begin the FIXVAR analysis, which will take into consideration all other revenue and cost channels and provide us with the net incomes or cash flows of the property for the next ten-years. 2013 2014 2015 2016 2017 2018 2019 2020 2021 2022 2023 $16,5 05 $17,2 16 $17,3 62 $18,0 10 $18,6 32 $19,2 20 $19,8 19 $20,4 04 $21,0 23 $21,5 76 $22,1 74 $275. 00 $283. 25 $291. 75 $300. 50 $309. 51 $318. 80 $328. 36 $338. 22 $348. 36 $358. 81 $369. 58 (RNAADR- Midtown East) FIXVAR Analysis- Most Likely Case The purpose of our FIXVAR analysis is to solve for the future annual incomes produced by this property. With this information, we will be able to solve for an equity valuation of the property. To begin we take the key outputs from our RNAADR report. Because we are solving the net incomes of the next ten-years, we use a base year of 2014. Both occupancy rate for 2014 and ADR are seen below.
- 58. Wyndham Midtown 45 53 Base Year: 2014 Number of Rooms: 203 Days Open Per Year: 365 Occupancy 82.03% Average Rate: $283.25 (FIXVAR- Midtown East) Revenues Based on this information we are able to solve for the total revenue based on 365 operating days and no room-loss. This multifaceted hotel has alternate revenue sources that must be accounted for. This includes food and beverage, telephone usage, and rental income. As we discussed before, the room revenue generated by this property in the most-likely scenario is $17,216,011. The Atrium Restaurant and Bar could potentially be a lucrative revenue source for the hotel as well. The restaurant and bar, which are operated in-house are a main focus for this midtown hotel. Starting to gain popularity as a spot for midtown professionals to grab lunch and drinks, the Atrium has also been a cool place for young socialites to grab dinner and “pre-game” a night out on the town. The hotel projects they can greatly improve operating efficiency
- 59. Wyndham Midtown 45 54 in the restaurant and provide returns around 35% on their food and beverage costs. The Atrium restaurant, which is smaller than most would like, is often lacking guests. With capital improvements to the lobby and Atrium, we expect serious income growth. For food we expect to drive $652,000 for the year. Although this seems low for a hotel of this size, unfortunately, the Wyndham hotel’s dining has been performing poorly in the last few years. Although the hotel now benefits from a slightly improved food and dining setting, the hotel only had $111,000 in food and dining revenue in 2012. Most of the capital improvements to the Atrium came in early 2013 as the building was purchased by the Wyndham Group. This is about $1786 a night. Assuming the average dinner comes out to $100 at the Atrium restaurant (work groups of 3 are most common guest size), this would be a conservative rate of 17 reservations a day. The beverage department, which is slightly more profitable than food offered at lunch, dinner, and room service will be heavily dependent on getting young people in the bar before they go out to other night clubs and bars in the area. Based on the $465,000 number we projected, the Atrium restaurant will be doing $1273 a night in beverage revenue. Our projection for telephone expenses is taken from the 2012 income statement provided by the Alex hotel. We project the hotel will drive $272,000 in phone revenue based on a 3% compound growth rate from 2012. Rentals and other income include weddings and banquets, which we expect to stay consistent with 2012 numbers. Please see Appendix C for our FIXVAR revenue inputs that have been discussed above. Based on all sources of revenue for 2014, the Wyndham should gross $18,741,000 in 2014.
- 60. Wyndham Midtown 45 55 Expenses In order to solve for room expenses, we decided to use the hotel’s 2012 room expense, which had comparable occupancy rates and then increase this number by a 3% year over year growth rate. Although the Wyndham’s current management team believes they can decrease this number with increased operating efficiency, we believe the number is consistent with industry standards and a good estimate for the most likely case. As we discussed before food and beverage expects to operate with a 35% margin, thus expenses for this category are 65% of revenues. Regardless of how the Atrium performs, we simplified this calculation by keeping expenses at 65% of revenue. In order to solve for telephone expenses, we simply used the 2012 income statement expense category and multiplied by a 3% year over year growth rate, which is also how we calculated “rental and other income” expense for weddings and banquets. Maintaining the hotel is a huge cost, most of those expenses get wrapped up into the room expense, however higher level management expenses are attributed to Administrative and General expense, as well as, our base management fee, which stands at 2.8%. The hotel plans on doing little marketing in 2014 as they will likely be doing significant capital improvements, thus a $399,000 marketing budget for 2014 has been put into place. The hotel is owned and partly operated by the Wyndham Group, so a franchise fee is nullified. Lastly, property operation and maintenance, which were provided by the manager of the Wyndham Midtown 5 are expected to close at $507,000 for the year. Lastly energy costs, which have actually fallen in the last two years due to small energy efficiency retrofit and the user of advanced lighting systems will come to $439,000 for the year. All expense numbers can be found in Appendix D. Lastly, we must discuss our fixed expenses. These include management fees, property tax, insurance, and reserves. The hotel is not operating on a ground lease, so there is no land rent. However, the base management fee of 2.8%, will cost the hotel $375,000 for the year. There is no management incentive fee for this property. Property taxes of $1.4 million have been provided to us by our property manager based on the expected profitability of the property and it’s appraisal used in the 2013 purchase of the property. Insurance costs of $129,000 for the year have also been provided by the property manager. A reserve for replacement has been set by upper management at 2.8%. Fixed Expenses can be found in Appendix E. With all revenues and expenses accounted for,
- 61. Wyndham Midtown 45 56 we are now able to determine our net income for the year of 2014. An expected income for the Wyndham Midtown 45, operating wholly as a hotel will come to $6,532,000. Assuming the inflation rates provided by the HVS FIXVAR file, we can now solve for the 10 year cash flows of this property. Please See Appendix F. Equity Valuation- Most likely Case Using all of the information we solved for in the previous models, we can now solve for the value of the property. Assuming the following value inputs; most of which being industry standards for Manhattan hotels. These will be key variables as we explore the best and worst-case scenarios for this property. The terminal cap rate for the property is likely to be the most important for valuation. This is the cap rate we use to estimate the resale value of a property at the end of the holding period. The expected net operating income (NOI) per year is divided by the terminal cap rate (expressed as a percentage) to get the terminal value. Terminal capitalization rates are based on forecasts and estimates and changes based on the person doing the calculation.
- 62. Wyndham Midtown 45 57 Valuation Inputs First Projection Year: 2014 Holding Period: 10 Stabilized Year: 2015 Equity Yield: 0.145 Terminal Cap Rate: 0.0775 Selling Expenses: 0.03 Mortgage Interest Rate: 0.0625 Mortgage Amortization: 20 Mortgage Payments Per Year: 12 (HEVM- Midtown East) Our valuation inputs for the most likely case are as follows. We will value the hotel based on a ten-year holding period, in which we will take out a 20-year amortized loan paid out monthly. The loan interest rate is 6.25%, an industry standard at this time. As discussed in this report, we expect cash flows to stabilize in 2015. The equity yield for this property is set to 14.5%. Although a 15 to 16% equity yield may be more appropriate for other Manhattan hotels, we expect this hotel to slightly underperform competitors. Thus an equity yield has been set to 14.5%. Probably the most important variable here, the terminal cap rate, a rate used to estimate the resale value of a property at the end of the holding period. The expected net operating income (NOI) per year is
- 63. Wyndham Midtown 45 58 divided by the terminal cap rate (expressed as a percentage) to get the terminal value; we will set to 7.75% for our most likely case. Although there is a chance we can see cap rates dip further in this market in the future, we believe this slightly conservative number will give us a better estimation of the hotel’s true holding value. Lastly, selling expenses, which range in the 3 to 4% range for this market, are pretty standard. Based on the fact that transactions and communication are only becoming simpler and more cost-effective, we decided a lower, 3% rate was more realistic. Next we input the net incomes that we deduced from our FIXVAR file. These are as follows. Please see below: YEAR (ooo) 2014: 6,533 2015: 6,422 2016: 6,718 2017: 6,989 2018: 7,222 2019: 7,457 2020: 7,674 2021: 7,908 2022: 8,080 2023: 8,282 2024: 8,532 (HEVM- Midtown East)
- 64. Wyndham Midtown 45 59 With our most likely set of cash flows determined for the property, we must finally include inputs for Loan-To-Value ratio, A lending risk assessment ratio that financial institutions and others lenders examine before approving a mortgage. Typically, assessments with high LTV ratios are generally seen as higher risk. The Wyndham Group, a financially stable organization benefits from a long history of strong credit. Thus a LTV of 60% has been determined for this property. Debt Coverage Ratio (DCR): 1.50 Year NOI To Be Used: 2015 Debt Yield: 14.50% Year NOI To Be Used: 2015 (HEVM- Midtown East) The Debt coverage ratio, or DCR, is the ratio of cash available for debt servicing to interest, principal and lease payments. It is a popular benchmark used in the measurement of an entity's ability to produce enough cash to cover its debt (including lease) payments. Again using a stabilized NOI of 2015, we also determine our debt yield to be equivalent to our equity yield of 14.5%. Based on this information, we can now value the property through three methods: a loan-to-value output, a debt coverage output, and a debt yield output. Although all three are important, we place the most importance on our loan-to-value equity valuation output. This is the most common equity valuation method of the three. Please see Appendix G for LTV output valuation. The HVS software using inputs for the LTV valuations file, value this property at $82,945,000. This includes $49,767,000 as the value of the mortgage component, and
- 65. Wyndham Midtown 45 60 $33,178,000 as the value of the equity component. This gives us an IRR of 10.4% on the total property valuation. This is a value of $408,587 per room. Although this is slightly lower than the market average, we again would like to reiterate, that it is our belief in the most likely scenario that this hotel will underperform over the next ten-years. Based on this valuation the property, we see a total appreciation of 32.73%, which translates to an annual appreciation of 2.87%. The stabilized going in cap rate stays consistent with our going out, terminal cap rate of 7.75%. Using the debt coverage ratio output, Appendix H, for the most likely case, we come to a similar total property value of $83,441,000, which represents an IRR of 10.31%. The mortgage component of this valuation is $51,061,000 and the equity component is $32,380,000. This valuation gives us a per room valuation of $411,041. Lastly our debt-yield ratio output gives us a valuation of 81,629,000 for the ten-year holding period in Appendix I. This represents a 10.64% IRR on the property and a per room valuation of $402,111. The mortgage component of this valuation accounts for $46,331,000 and the equity component is valued at $35,298,000. This valuation represents an annual appreciation of 3.04% or 34.87% over the life of this property.
- 66. Wyndham Midtown 45 61 Worst-Case Scenario Valuation of Wyndham Property (In the worst-case scenario, we will be solving for the valuation of the hotel using input variables such as occupancy rate, ADR, cap rate, etc. that we believe could realistically occur in a poor hotel operating market. Following this valuation, we will also perform a best-case scenario analysis.)
- 67. Wyndham Midtown 45 62 The purpose of the worst-case scenario is to deduce a valuation based on realistic estimates about what would happen if the hotel underperforms in key categories, such as ADR and occupancy growth, or if the hotel faces a more challenging market with increased supply growth, decreased demand, higher cap rates, etc. We will begin by changing key inputs in the RNAADR analysis, adjust those inputs in our FIXVAR analysis, take our newly found net incomes for the ten-year holding period, and solve for a valuation of the property. The first major change we made was decreasing demand growth for the midtown market. The 2.9% growth rate we used in our most-likely case was able to support even occupancy rates over the ten-year period. However, with a decreased demand growth rate, we will see a fall in occupancy rates for both this hotel and the midtown market. By changing the stabilized demand growth rate to 2.2% all hotels in this market will struggle financially. There are a few reasons this could change: for one, increased supply in other segments could pull guests out of midtown, increased means of transportation will keep people from staying the night in Manhattan in years to come. We also estimated that there could be increased additions to supply. The 2% rate we chose in our most likely case may be slightly optimistic. By changing this number to 2.25% , we will represent what is likely to happen when this market starts hitting occupancy rates in the 85% range. Competitors will view the market as undersupplied and come moving in to gain market share. As seen in Appendix J, the occupancy rate for the Wyndham Midtown is hurt, mostly in the later years. The hotel is going to get a nice pick-up with capital improvements; however, by the end of the ten-year period, we expect that the property will be a bit rundown and an underperformer. Notice the downward trend in occupancy and market share over this period. Harsh market conditions will greatly reduce the rate at which our ADR grows. In this worst-case scenario, we have decided a 2.25% ADR growth rate is more appropriate. Please see ADR inflation graph below:
- 68. Wyndham Midtown 45 63 Enter expected ADR inflation rates for each segment below. 2014 2015 2016 2017 2018 2019 2020 2021 2022 2023 All Rooms 2.25% 2.25% 2.25% 2.25% 2.25% 2.25% 2.25% 2.25% 2.25% 2.25% None 0.00% 0.00% 0.00% 0.00% 0.00% 0.00% 0.00% 0.00% 0.00% Using the inflation rates above, below is the forecast of ADR by segment by year. Wyndham Midtown 2013 2014 2015 2016 2017 2018 2019 2020 2021 2022 2023 All Rooms $ 275.00 $ 281.19 $ 287.51 $ 293.98 $ 300.60 $ 307.36 $ 314.28 $ 321.35 $ 328.58 $ 335.97 $ 343.53 (HVS RNAADR- Wyndham Midtown) The decreased ADR growth will greatly decrease the profitability of this hotel. Lower rates mean lower room revenue, with almost no change to the room expenses. The graph above depicts the ADR rates we will use to solve for the room revenue over the ten-year holding period of this hotel in the worst-case scenario analysis. With this information, in conjunction to our occupancy rates that we solve for earlier, we can now
- 69. Wyndham Midtown 45 64 solve for the room revenue that will be produced by the hotel. As we can see there is very little change in the first few holding years. However, in later years, the hotel greatly underperforms and causes financial strain for ownership. Below are the net incomes of the property displayed in 1000s, only slightly decreased in the first few years. However seeing significant drops in net income in later years (2019-2023). 2013 2014 2015 2016 2017 2018 2019 2020 2021 2022 2023 $16,5 05 $16,9 32 $16,8 38 $17,1 76 $17,4 71 $17,7 16 $17,9 56 $18,1 68 $18,3 98 $18,5 51 $18,7 34 $275. 00 $281. 19 $287. 51 $293. 98 $300. 60 $307. 36 $314. 28 $321. 35 $328. 58 $335. 97 $343. 53 (HVS RNAADR- Wyndham Midtown) FIXVAR WORST-CASE We can now begin our FIXVAR analysis of this property under our worst-case scenario. By pulling information straight from the RNAADR analysis, we can now begin to solve for the next ten-year cash flows netted by the property. (HVS FIXVAR- Wyndham Midtown) Base Year: 2014 Number of Rooms: 203 Days Open Per Year: 365 Occupancy 81.27% Average Rate: $281.19
- 70. Wyndham Midtown 45 65 Our room revenue is only slightly knocked down here to $16,932,000 in the base year. However we decided the best key inputs to show a worst-case scenario would be underperforming in the food and beverage category, while still maintain the 35% margin we discussed before. Although we maintained a high beverage revenue value, we dropped Food Revenue down $200,000 t $452,000. This represents a per night food revenue of 1,238. Based on the typical $100 meal for three guests in a business setting this would be 12 to 13 groups a day.
- 71. Wyndham Midtown 45 66 Base Year Inputs Base Year Outputs (At A Glance) Revenue s Amoun t in $(000) % of Revenu e $ per Avail . Room $ per Occ Room This column displays a real time view of how your inputs affect the output figures. Rooms $ 16,932 $16,932 Food $452 $452 Beverages $465 $465 Telephone $272 $272 Rentals and Other Income $136 $136 Other Operated Departments $0 $0 (HVS FIXVAR- Wyndham Midtown)
- 72. Wyndham Midtown 45 67 The decrease in occupancy will also decrease the cost of room expenses. This will be from decreased washing and drying of sheets, decreased cleaning costs, and less on- hand staff. Because the occupancy change is small, we predict a $100,000 decrease in the cost of room expenses for this period. Food and beverage expense will remain at 65% of revenues, and our telephone cost will remain the same based on the lack of variability found in this area. We will also keep rentals and other income the same due to the lack of importance it has on hotel profitability. In our undistributed operating expense analysis of the hotel, we increased our administrative and general expenses by 100,000 dollars to reach 1.04 Million. Rooms $6,981 Food & Beverages $596 Telephone $44 Rentals and Other Income $66 Other Operated Departments $0 (HVS FIXVAR- Wyndham Midtown) This represents the company missing key efficiency goals and hiring more lobby staff. Based on decreased occupancy and ADR, we expect the firm to increase spending on marketing, specifically on third party travel sites, such as jetsetter.com and Travelocity. Increases in marketing we estimated to total $599,000. Because the property maintenance and energy costs will be about the same, we did not change these values. The decreases in occupancy rates were minimal and the current values suffice for a worst-case scenario.
- 73. Wyndham Midtown 45 68 Undistributed Operating Expenses Administrative & General $1,040 $1,040 Marketing $599 $599 Franchise Fees $0 $0 Prop. Oper. & Maintenance $507 $507 Energy Costs $439 $439 Total Undistributed Operating Expenses: $2,585 (HVS FIXVAR- Midtown East)
- 74. Wyndham Midtown 45 69 Fixed Expenses Base Management Fee 2.0% $365 Incentive Management Fee 0.0% $0 Property Tax $1,462 $1,462 Insurance $129 $129 Reserve for Replacement 3.0% $548 Land Rent $0 $0 Total Fixed Expenses: $2,504 Net Income: $5,846 (HVS FIXVAR- Midtown East) The fixed expenses for the hotel remained the same. A 2.0% base management fee has already been negotiated, and property tax at this point is fairly predictable. Our insurance cost for the property has also been predetermined. In this case however, we did increase our reserve for replacement to 3%. This could come for any number of reasons, but changes in Wyndham policy would be one reason for this. The 2.8% number for our most likely case is a bit lean and would give the company some concern. These numbers bring us to our final net income for the 2014 worst-case scenario of $5,846,000. This is a decrease of $684,000 from our initial estimate of $6,533,000 that we used in our most-likely scenario. Please see Appendix K for our worst-case scenario 10 year projected net incomes. These will flow directly into our equity analysis of the property.
- 75. Wyndham Midtown 45 70 Equity Analysis Worst-Case Going into the equity analysis with our new projected cash flows, we can solve for the equity valuation of this property based on the three valuation methods we described before. Here are our key inputs for the worst-case scenario. First Projection Year: 2014 Holding Period: 10 Stabilized Year: 2015 Equity Yield: 15.00% Terminal Cap Rate: 8.00% Selling Expenses: 3.00% Mortgage Interest Rate: 6.25% Mortgage Amortization: 20 Mortgage Payments Per Year: 12 (HVS Equity- Midtown East) As discussed our starting valuation year is 2014. We will hold the property for 10 years. Our first change however is an expected equity yield of 15%, and an increase in our terminal cap rate to 8%. Although we only change our cap rate by 0.25, the property value is adversely affected by this change. We maintain a 3% selling expense and our mortgage interest rate remains at 6.25%. These are industry standards. Changing these would be erroneous. Similarly, we did not change our LTV ratio. We maintained a 60%
- 76. Wyndham Midtown 45 71 ratio because we are confident that this is what they Wyndham Group would get for a loan from anyone in the market. Fill out the matrix below with the appropriate values to complete the analysis. Loan To Value For Valuation Estimate Loan To Value Ratio: 60.00% Debt Coverage Ratio Debt Coverage Ratio (DCR): 1.50 Year NOI To Be Used: 2016 Debt Yield Debt Yield: 15.50% Year NOI To Be Used: 2016 (HVS Equity- Midtown East) Our worst-case equity valuations can be found in Appendix L (LTV output), Appendix M (DCR output), and Appendix N (Debt-Yield output). For our worst-case scenario LTV output, we have a total property value of $71,804,000. The mortgage component of this valuation is $43,082,000 and the equity position is valued at $28,772,000. This valuation implies a per room value of $353,713, a 2.86% year over year appreciation, and a stabilized going in cap rate of 7.9%. The IRR of holding this property in the worst- case scenario is 10.64%. Secondly, we deduce a valuation of $72,804,000 from our worst- case scenario DCR output. This valuation consists of a $45,589 mortgage component
- 77. Wyndham Midtown 45 72 valuation and an equity valuation of $37,215,000, implying that the value per room is $358,639. Lastly, our debt yield ratio analysis deduces a total property valuation of $70,054,000, with an equity valuation of $31,358 and a mortgage component valuation of $38,687,000. Total appreciation over the ten-year holding period is equal to 35.93%. With a per room value of $345,096, it is that purchasing this hotel at current market prices will be a poor financial decision.
- 78. Wyndham Midtown 45 73 Best-Case Scenario Valuation of Wyndham Property (In the most likely scenario, we will be solving for the valuation of the hotel using input variables such as occupancy rate, ADR, cap rate, etc. that we believe should realistically occur in a favorable Midtown market. Following this valuation, we will also perform a best and worst-case scenario analysis.)
- 79. Wyndham Midtown 45 74 In order to solve for the best-case scenario valuation of this property, we took all of the inputs we thought were critical to change in the worst-case scenario and gave them conservative, yet optimistic inputs. These inputs represent what would happen in the company reaches all of their efficiency goals and the hotel market in midtown become slightly more favorable. Again we will begin by changing key inputs in the RNAADR, which will give us new ADR and occupancy rate values. These values in turn will go directly into our FIXVAR analysis, which will give us the net incomes for the property over the next ten-years. With this information, we will be able to solve for the property value of the hotel based on three different valuation methods. The first key input we decided to change is the demand growth rate for the midtown Manhattan hotel market. By slightly changing demand from 2.9% to 3.2%, we will are increasing occupancy rates for the whole market, particularly in later years in our ten- year holding period. However we decided to keep the rate at which the market would see increases to supply the same at 2%. This outlook would represent that investors have a hard time entering this market, or that occupancy rates stay just below a point that investors think there needs to be a new hotel in the market. This can be seen in Appendix O. With these two key changes, we have new output occupancy for the property over the ten-year holding period. This can be seen in Appendix P. Here the occupancy rate climbs to 82.27% in 2014, dips down slightly with the addition of the NY YIMBY in 2015, then steadily climbs back to 83% in the last four years. Market occupancy however is able to climb into the 85% to 87% range during this time. Although we see this hotel only slightly lagging, we find it hard to believe that the hotel will be able to compete in the later years of the holding period when bedding, lobby, etc. are outdated. With occupancy rate solved for, we can now begin to analyze the best-case scenario for ADR. As we can see below, the property will benefit from a 3.25% year over year growth rate in ADR.
- 80. Wyndham Midtown 45 75 2013 2014 2015 2016 2017 2018 2019 2020 2021 2022 2023 $275. 00 $283. 94 $293. 17 $302. 69 $312. 53 $322. 69 $333. 18 $344. 00 $355. 18 $366. 73 $378. 65 (HVS RNAADR- Midtown East) This will again increase profitability for the hotel over the next ten-years. With an ADR growth rate that beats inflation, the hotel’s profitability will increase with time. With our new ADRs solved for, in conjunction to the new occupancy rates in the best-case scenario, we can now solve for the room revenue for the property over the next ten- years. Here we use room revenue for 2014 of $17,308,105: a $391,000 increase from our most likely case. Please find the expected room revenues for this scenario below, displayed in thousands. With this information, we can now begin to examine the implications of stellar performance by the hotel on the ten-year future cash flows. 2013 2014 2015 2016 2017 2018 2019 2020 2021 2022 2023 16,50 5 17,30 8 17,54 8 18,30 0 19,03 4 19,73 9 20,46 4 21,18 1 21,94 0 22,63 7 23,39 0 $275. 00 $283. 94 $293. 17 $302. 69 $312. 53 $322. 69 $333. 18 $344. 00 $355. 18 $366. 73 $378. 65 (HVS RNAADR- Midtown East)
- 81. Wyndham Midtown 45 76 FIXVAR BEST-CASE With the room revenue solved for in the preceding section, we can now begin to analyze the other revenue/cost sources of the hotel. With this information, we can begin to analyze the ten-year cash flows of the hotel in a very favorable operating market. Job Title: FIXVAR Prepared By: Wyndham Prepared For: SFT Job ID: Base Year: 2014 Number of Rooms: 203 Days Open Per Year: 365 Occupancy 82.27% Average Rate: $283.94 (HVS FIXVAR- Midtown East) Assuming that the hotel will do particularly well in food and beverage sales, still based on a 35% profit margin, we expect the following revenue for the property. Again we are using dollar amounts in total, opposed to as a percent of revenue or per available room because this is how the information has been presented to us by the property manager. With the hope of staying as consistent as possible, we decided this is the best way to display the financial information to the reader of this report. As we discussed, there is
- 82. Wyndham Midtown 45 77 an increase in food and beverage revenue, particularly in the beverage category. This is due to the potential we see for the Atrium bar. The bar is in an ideal location for after- work happy hours and dinners, as well as party goers looking for a place to meet up and grab a few drinks. We expect that the hotel bar and restaurant could be a steady source of reliable income and a source of free marketing. As we all know word of mouth can be the most powerful marketing tool. If the hotel executes its plan of outstanding food and beverage service, we expect the hotel could see outstanding results. Based on this, we decided an increase to $800,000 in beverage revenue was a fair estimate for the best-case scenario for the hotel. Rooms $17,308 Food $452 Beverages $800 Telephone $272 Rentals and Other Income $136 Other Operated Departments $0 Total Revenue: $18,968 (HVS FIXVAR- Midtown East) Our expense reports, found below, have few changes. However in order to keep the 65% assumption of costs to revenue, we had to change our food and beverage cost to $814,000.
- 83. Wyndham Midtown 45 78 Administrative & General 1,000 Marketing 299 Franchise Fees 0 Prop. Oper. & Maintenance 507 Energy Costs 439 Total Undistributed Expenses: 2,245 (HVS FIXVAR- Midtown East) In the best-case scenario, we also find that the hotel has to do little extra marketing and has one less staff for administrative and general expenses. Seen in Appendix Q. Lastly, before we are able to solve for our future cash flows, we find the fixed cost analysis in Appendix R. In this scenario, all previously negotiated costs remain the same, however, we decided to operate the hotel as leanly as possible and only account 2% of revenue as reserve for replacement. Although risky, we still find the number reasonable. This brings us to a total net income of $6,847,000 for the year of 2014 in the best-case scenario. With this information, we can now do an analysis of the ten-year cash flows seen in Appendix S. Equity Analysis Finally coming to the equity valuation software file, we can take a look at the key inputs we would change in the market was operating in a favorable manner in the midtown Manhattan hotel market. In this case we lower the equity yield to 13.5% and lower our cap rate to 7.5%. This represents a hot market that buyers are willing to pay more to get into. If adding supply to this market becomes more difficult, it is likely that this cap rate will decrease, as we have displayed below.
- 84. Wyndham Midtown 45 79 First Projection Year: 2014 Holding Period: 10 Stabilized Year: 2015 Equity Yield: 13.50% Terminal Cap Rate: 7.50% Selling Expenses: 3.00% Mortgage Interest Rate: 6.25% Mortgage Amortization: 20 Mortgage Payments Per Year: 12 (HVS HEVM- Midtown East) The revenues we solved for in our FIXVAR analysis can be seen below. These numbers, slightly inflated from our most likely case represent the hotel operating a little below the midtown Manhattan market, but above what it would be doing in the most likely case. Steady growth in ADR and occupancy, combined with a decrease in new supply are the main indicators of this newfound profitability.
- 85. Wyndham Midtown 45 80 2014: $6,848 2015: $6,783 2016: $7,137 2017: $7,469 2018: $7,764 2019: $8,066 2020: $8,352 2021: $8,661 2022: $8,907 2023: $9,189 2024: $9,467 (HVS HEVM- Midtown East) Lastly we can see the final variables necessary for completion of the equity analysis. Again we changed little, simply because changes would be erroneous. However we did change our debt yield to 13.5%.
- 86. Wyndham Midtown 45 81 Loan To Value Ratio: 0.60 Debt Coverage Ratio (DCR): 1.50 Year NOI To Be Used: 2016 Debt Yield: 0.135 Year NOI To Be Used: 2016 Appendix U, V, X will serve as the LTV valuation, DCR valuation, and Debt-Yield valuation. Through our LTV output, we come to a valuation of the property of $91,105,000, based on a PV factor of 9.86%. This valuation represents a per room valuation of $450,789. Of the $91,205,000 in total property valuation, $54,906,000 consists of the mortgage valuation; thus leaving $36,604,000 in equity valuation. This valuation represents a total appreciation of 30.04% over the 10 year term. With this valuation and the addition of an $8,950,000 net income in year 11 and a selling expense of $3580, the net sales price in year 11 is $115,753,000. Our DCR output similarly represents a $91,043,000 valuation for the hotel, with $53,570,000 representing mortgage valuation and an equity valuation of $37,473,000. This leaves us with a per room valuation of $448,485 and a total appreciation of 31.05%. This valuation based on a 9.96 PV factor also gives us a selling price of $115,753 in the 11th year based on a $3,580 selling expense. Using the debt-yield output, we come to a total property value of $90,592,000, with a mortgage component valued at $46,917,000 and an equity valuation of $43,675,000. This represents a per room value of $46,267. Based on this valuation, the owners of this property will receive a 5.43% year over year appreciation increase, or 69.68%