WS7.1.2
•Download as DOC, PDF•
0 likes•201 views
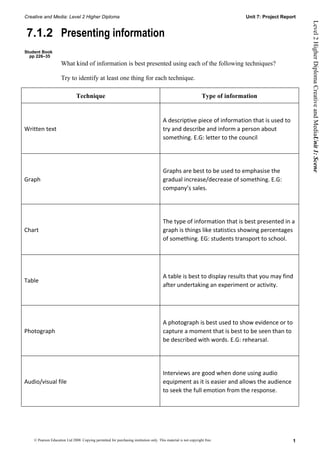
This document provides guidance for students on presenting different types of information using various techniques. It discusses that written text is best for descriptive information to inform readers, graphs are suited for showing gradual increases or decreases over time, charts are good for displaying statistics and percentages, tables are useful for organizing experimental results, photographs capture moments better seen than described, and audio files allow audiences to hear full emotions in interviews.
Report
Share
Report
Share
Recommended
Global Innovation Index 2013
The document discusses the results of the 2013 Global Innovation Index, which ranks 142 countries on their innovation performance based on 84 indicators. The top 5 innovating countries are Switzerland, Sweden, the United Kingdom, the Netherlands, and the United States. The top 3 performers per income group and region are also highlighted. Countries with the largest increases in ranking from 2012 to 2013 are Costa Rica, Uganda, and Bolivia.
Blogging Basics
Use only your first name, standard English, and appropriate language in blog posts. Think critically and focus on answering writing prompts fully. Blogs encourage critical thinking and discussion. Save blog entries in Word, with the file name identifying the topic and date, and use spell check before copying the response into the blog comments.
Technology Power and Use
This presentation is about the responsibility of technology and the power of technology. The impact depends on the speaker and the anecdotes and presentation style used.
Openmoney Ftm2009
This is a temporary early draft of the OpenMoney.org Follow the Money presentation.
Added concept and graphics - more to come
For the offical OpenMoney slides - Please go here
http://www.slideshare.net/mwlinton
My Portfolio
The document is Britney Sweeney's written portfolio applying for a merchandising position. It includes her contact information and a cover letter expressing her interest in leveraging her diverse professional experience in customer service, sales, and retail. She provides details of her relevant experience in sales, customer service, and as a merchandise marketing major. She is confident her experience and personality would be an asset to the company and looks forward to learning more about the role and company through an interview. Attached are her resume and letters of recommendation for review.
SemináRio Grh LusíAda
Suporte da intervenção no «Seminário de Gestão de Recursos Humanos 2011), da Universidade Lusíada de Lisboa; 25.05.11 -painel «Novos desafios da gestão de recursos humanos» - tema «Jornalismo em gestão de recursos humanos)
Workplace Alignment
The document discusses developing a successful workplace strategy through data-driven alignment between business needs and space requirements. It emphasizes gathering data from multiple sources to analyze how employees currently work and identify gaps between this and desired states. A three-step process is outlined: 1) tie the strategy to a real business need; 2) gather data from sources like HR directories, badge-in records, network traffic, observations, and surveys; 3) apply the data in a gap analysis and action plan to guide development of a strategy that reduces costs while improving productivity, attraction, and retention. The best strategy is not simply an alternative but true alignment with business needs and key data sources.
Poster design 1
Gemma Davey both directs and stars in an upcoming film titled "Jeté" that is set for a February 1st release in theaters. The film has received outstanding reviews from Heat Magazine and The Daily Mail who praise Davey's direction and performance. The tagline "It's not what you are, it's who you want to become" provides insight into the film's theme of personal growth and transformation.
Net(work) yourself a job? CETL student engagement and employability
Laura Jenkins & Sabine Little from CILASS and Louise Goldring from CEEBL lead a discussion session at the CETL student Network conference, University of Plymouth June 2008
Monte Carmelo setembro-outubro 2010
Informativo bimestral da OCDS (Ordem dos Carmelitas Descalços Seculares) da Província São José - Brasil, referente aos meses de setembro e outubro de 2010.
Ws7.1.9 (1)
This document provides a template for students to plan a focus group for a research project called "Performance". The template includes spaces to record the date and location of the focus group meeting, names of people to invite from different age ranges, an introduction to give at the start, questions to ask, and how to record the results. The focus group will take place on May 18th, 2011 at the David Sharpe Theatre and will invite people over age 11 to understand how audience reactions may change with age.
Gerard Valenduc: "Preventing the risk of digital exclusion among youth"
Telecentre-Europe Summit 2011 - Parallel session 2: "Joining forces at the European level: Digital skills for young people"
How can telecentres become engaged with young people, and the networks that support them?
And how can they help to support young people with employability through social media and new digital skills?
Al convertirse una molécula de glucosa en piruvato
El documento describe las etapas de la respiración celular, incluyendo la glucolisis, la descarboxilación oxidativa del piruvato y el ciclo de Krebs. La glucolisis genera dos moléculas de ATP y dos de NADH a partir de una molécula de glucosa. El piruvato resultante se convierte en acetil-CoA a través de la descarboxilación oxidativa para su entrada en el ciclo de Krebs, donde se liberan más moléculas de energía como NADH, FADH2 y ATP. El ciclo de Kre
Another Day In the Jedi Council...
The Jedi Council discusses Obi-wan being late with the Cheez-its and speculate on what he may be doing to help others. They discuss trying to improve the Jedi's public image compared to the Sith but realize making up statistics won't work. A message then states they deserve better than the Jedi and is signed by the Sith.
Improving ROI with Marketing Optimization via SAS
This document summarizes a presentation about using marketing optimization to improve return on investment. It discusses how increasing marketing efficiency, better targeting customers, and higher campaign volumes are no longer sufficient to maximize ROI. Optimization uses mathematical modeling to determine the best combination of marketing decisions, objectives, and constraints to achieve the optimal outcome. An example shows how optimization can improve ROI by 4% over prioritizing customers or campaigns alone. The presentation argues that optimization should be applied across the entire marketing process for maximum benefit.
Q7 owerpoint reneee
The document discusses the benefits of exercise for mental health. Regular physical activity can help reduce anxiety and depression and improve mood and cognitive function. Exercise causes chemical changes in the brain that may help protect against mental illness and improve symptoms for those who already suffer from conditions like anxiety and depression.
Project proposal form
Renee Bailey is proposing a project titled "Operation Education" which will be a school survival guide documentary. The objectives are to learn how children survive school in the 21st century through interviews. Renee will be responsible for all aspects of the solo project and wants to learn documentary editing and how to use a high-tech camera. The reason for choosing this project is that it is unique, challenging, and will allow Renee to develop new skills in media. Activities will include researching documentaries and production, developing and analyzing ideas, filming interviews, editing the documentary, and getting evaluations. Milestones and target dates will be set by the teacher assessor.
WS8.1.1
The document discusses a student's proposed creative project titled "Operation Education" that would involve creating a film and performance aimed at students. Some of the strengths identified are that the idea is original, engaging for the target audience, and allows the student to try something new. Potential opportunities include challenging the student and having access to good recording equipment and support. Some weaknesses identified are that it may be too time consuming and have an unrealistic scope. Threats include not achieving the expected results or target. The document provides a template to help students evaluate the strengths, weaknesses, opportunities, and threats of their project ideas.
WS8.4.3
The document provides an evaluation template for a student to assess their role and performance on a solo creative media project. The student explains that they took on all roles for the project as it was solo, including acting, directing, filming, producing and editing. They felt they adapted well to losing all their initial work and redoing it, and created something unique and creative within a tight timespan. However, they note their timing for filming didn't allow enough time for mistakes. Through completing the project, the student learned they can be productive and creative in difficult situations.
WS8.4.1
The document summarizes a student's evaluation of their creative media project titled "Operation Education". The project was originally intended to be a school survival guide but became a diary of a stereotypical geek's daily life and struggles. Strengths included its humorous and entertaining nature, as well as its creative and innovative approach. However, weaknesses were that the content was not actually relevant to the intended topic of a survival guide and could have been improved with stronger acting in the diary scenes.
Ws8.3.1
Renee recorded her skills development while working on her final project called "Operation Education". She used camera skills to successfully film her project. Her editing skills in iMovie helped produce useful techniques. Acting skills allowed her to take on a role and direct believable scenes. Directing during filming helped construct scenes that turned out well.
WS8.2.1
The document summarizes the primary research methods a student used for a project on their Level 2 Higher Diploma in Creative and Media. The student interviewed Callum Mackintosh, a professional, on March 16th 2011. No other primary research methods such as questionnaires or interviews with other students were noted as being used by the specified dates of April 7th and May 13th 2011.
8.1.5
The document records the activities and decisions made throughout a student's project to create a survival guide. It shows the initial brainstorming and planning phases in February and March, including fundraising. In April, the student bought supplies and began filming the first scenes. Additional filming took place through May. However, when attempting to edit, the camera tapes were found to be damaged, forcing re-filming. The student then re-filmed and edited the scenes, changing the format to a "day in the life" documentary instead of a survival guide.
8.1.4
The document lists the resources needed to complete a project including equipment, software, costumes, props, finances, people, and expert help. It identifies a camera, tripod, iMac, iMovie, a fatsuit, geek glasses, tie, suspenders, paper, boxes, soft ball, and books. It estimates £80-£100 will be needed which will be raised through fundraising and media budget. It notes people will be needed to play characters and a camera man which will come from friends and the drama department. It also lists needing help from the music technician Callum Mackintosh.
8.1.3
The document lists key activities needed to complete a project and estimates time required for each:
1) Generating ideas such as looking at survival guide examples would take a couple weeks.
2) Action planning through brainstorming and diagrams would take a couple days.
3) Research using the internet and primary sources would take a maximum of a week.
4) Pre-production including planning and blogging work would need a month to be prepared for production.
More Related Content
Viewers also liked
Poster design 1
Gemma Davey both directs and stars in an upcoming film titled "Jeté" that is set for a February 1st release in theaters. The film has received outstanding reviews from Heat Magazine and The Daily Mail who praise Davey's direction and performance. The tagline "It's not what you are, it's who you want to become" provides insight into the film's theme of personal growth and transformation.
Net(work) yourself a job? CETL student engagement and employability
Laura Jenkins & Sabine Little from CILASS and Louise Goldring from CEEBL lead a discussion session at the CETL student Network conference, University of Plymouth June 2008
Monte Carmelo setembro-outubro 2010
Informativo bimestral da OCDS (Ordem dos Carmelitas Descalços Seculares) da Província São José - Brasil, referente aos meses de setembro e outubro de 2010.
Ws7.1.9 (1)
This document provides a template for students to plan a focus group for a research project called "Performance". The template includes spaces to record the date and location of the focus group meeting, names of people to invite from different age ranges, an introduction to give at the start, questions to ask, and how to record the results. The focus group will take place on May 18th, 2011 at the David Sharpe Theatre and will invite people over age 11 to understand how audience reactions may change with age.
Gerard Valenduc: "Preventing the risk of digital exclusion among youth"
Telecentre-Europe Summit 2011 - Parallel session 2: "Joining forces at the European level: Digital skills for young people"
How can telecentres become engaged with young people, and the networks that support them?
And how can they help to support young people with employability through social media and new digital skills?
Al convertirse una molécula de glucosa en piruvato
El documento describe las etapas de la respiración celular, incluyendo la glucolisis, la descarboxilación oxidativa del piruvato y el ciclo de Krebs. La glucolisis genera dos moléculas de ATP y dos de NADH a partir de una molécula de glucosa. El piruvato resultante se convierte en acetil-CoA a través de la descarboxilación oxidativa para su entrada en el ciclo de Krebs, donde se liberan más moléculas de energía como NADH, FADH2 y ATP. El ciclo de Kre
Another Day In the Jedi Council...
The Jedi Council discusses Obi-wan being late with the Cheez-its and speculate on what he may be doing to help others. They discuss trying to improve the Jedi's public image compared to the Sith but realize making up statistics won't work. A message then states they deserve better than the Jedi and is signed by the Sith.
Improving ROI with Marketing Optimization via SAS
This document summarizes a presentation about using marketing optimization to improve return on investment. It discusses how increasing marketing efficiency, better targeting customers, and higher campaign volumes are no longer sufficient to maximize ROI. Optimization uses mathematical modeling to determine the best combination of marketing decisions, objectives, and constraints to achieve the optimal outcome. An example shows how optimization can improve ROI by 4% over prioritizing customers or campaigns alone. The presentation argues that optimization should be applied across the entire marketing process for maximum benefit.
Q7 owerpoint reneee
The document discusses the benefits of exercise for mental health. Regular physical activity can help reduce anxiety and depression and improve mood and cognitive function. Exercise causes chemical changes in the brain that may help protect against mental illness and improve symptoms for those who already suffer from conditions like anxiety and depression.
Viewers also liked (12)
Net(work) yourself a job? CETL student engagement and employability
Net(work) yourself a job? CETL student engagement and employability
Gerard Valenduc: "Preventing the risk of digital exclusion among youth"
Gerard Valenduc: "Preventing the risk of digital exclusion among youth"
Al convertirse una molécula de glucosa en piruvato
Al convertirse una molécula de glucosa en piruvato
More from renee
Project proposal form
Renee Bailey is proposing a project titled "Operation Education" which will be a school survival guide documentary. The objectives are to learn how children survive school in the 21st century through interviews. Renee will be responsible for all aspects of the solo project and wants to learn documentary editing and how to use a high-tech camera. The reason for choosing this project is that it is unique, challenging, and will allow Renee to develop new skills in media. Activities will include researching documentaries and production, developing and analyzing ideas, filming interviews, editing the documentary, and getting evaluations. Milestones and target dates will be set by the teacher assessor.
WS8.1.1
The document discusses a student's proposed creative project titled "Operation Education" that would involve creating a film and performance aimed at students. Some of the strengths identified are that the idea is original, engaging for the target audience, and allows the student to try something new. Potential opportunities include challenging the student and having access to good recording equipment and support. Some weaknesses identified are that it may be too time consuming and have an unrealistic scope. Threats include not achieving the expected results or target. The document provides a template to help students evaluate the strengths, weaknesses, opportunities, and threats of their project ideas.
WS8.4.3
The document provides an evaluation template for a student to assess their role and performance on a solo creative media project. The student explains that they took on all roles for the project as it was solo, including acting, directing, filming, producing and editing. They felt they adapted well to losing all their initial work and redoing it, and created something unique and creative within a tight timespan. However, they note their timing for filming didn't allow enough time for mistakes. Through completing the project, the student learned they can be productive and creative in difficult situations.
WS8.4.1
The document summarizes a student's evaluation of their creative media project titled "Operation Education". The project was originally intended to be a school survival guide but became a diary of a stereotypical geek's daily life and struggles. Strengths included its humorous and entertaining nature, as well as its creative and innovative approach. However, weaknesses were that the content was not actually relevant to the intended topic of a survival guide and could have been improved with stronger acting in the diary scenes.
Ws8.3.1
Renee recorded her skills development while working on her final project called "Operation Education". She used camera skills to successfully film her project. Her editing skills in iMovie helped produce useful techniques. Acting skills allowed her to take on a role and direct believable scenes. Directing during filming helped construct scenes that turned out well.
WS8.2.1
The document summarizes the primary research methods a student used for a project on their Level 2 Higher Diploma in Creative and Media. The student interviewed Callum Mackintosh, a professional, on March 16th 2011. No other primary research methods such as questionnaires or interviews with other students were noted as being used by the specified dates of April 7th and May 13th 2011.
8.1.5
The document records the activities and decisions made throughout a student's project to create a survival guide. It shows the initial brainstorming and planning phases in February and March, including fundraising. In April, the student bought supplies and began filming the first scenes. Additional filming took place through May. However, when attempting to edit, the camera tapes were found to be damaged, forcing re-filming. The student then re-filmed and edited the scenes, changing the format to a "day in the life" documentary instead of a survival guide.
8.1.4
The document lists the resources needed to complete a project including equipment, software, costumes, props, finances, people, and expert help. It identifies a camera, tripod, iMac, iMovie, a fatsuit, geek glasses, tie, suspenders, paper, boxes, soft ball, and books. It estimates £80-£100 will be needed which will be raised through fundraising and media budget. It notes people will be needed to play characters and a camera man which will come from friends and the drama department. It also lists needing help from the music technician Callum Mackintosh.
8.1.3
The document lists key activities needed to complete a project and estimates time required for each:
1) Generating ideas such as looking at survival guide examples would take a couple weeks.
2) Action planning through brainstorming and diagrams would take a couple days.
3) Research using the internet and primary sources would take a maximum of a week.
4) Pre-production including planning and blogging work would need a month to be prepared for production.
8.1.2
The student is planning a school survival guide project in video format. The purpose is entertainment, poking fun at school stereotypes. The target audience is secondary students aged 11-16, starting within their own school. It will be filmed and edited using the school's recording studio and equipment. Resources needed include the studio, cameras, tripods, and editing software. Risks include safety hazards in various filming locations. The student will mitigate risks by having a qualified staff member supervise equipment use and conducting safety assessments of areas. Food and drinks near electrical equipment will also be prohibited.
WS7.1.12
This document contains a tally chart template and instructions for students to use to organize responses from a questionnaire about entertainment preferences. The tally chart includes sample questions about age range, entertainment frequency, entertainment type preferences, and whether people prefer watching something new or familiar. The chart also has columns to record the number of responses for each answer and a total response count.
WS7.1.11
This document provides guidance for students on designing a questionnaire as part of a research project. It includes a template to help plan the questionnaire with sections for the title of the research project, a brief description of what the research is trying to find out, closed questions to collect basic information from respondents, a mix of open and closed questions to gather needed information and opinions, and instructions for respondents once complete. The template is intended to help students systematically design their questionnaire for a project described in their course materials.
Ws7.1.10
The document discusses designing questionnaires and provides positive and negative aspects of questionnaires based on the student's past experiences. Positives included questionnaires being straightforward, allowing immediate return, and being quick to complete. Negatives were that not all are returned, some don't allow for varied responses, and they can lack interest and appeal for participants.
WS4.1.2
The document discusses different types of recording and the methods used for each type. It describes journalists using notebooks, dictaphones, shorthand, and video cameras to record information during interviews or research for a story. Reflective recording for personal accounts or interests can involve diaries, notebooks, laptops, or blogs. Students in university lectures use laptops, notebooks, and textbooks to record information from lecturers.
Ws4.1.2 complete
The document discusses different types of recording and the methods used for each type. It describes journalists using notebooks, dictaphones, shorthand, and video cameras to record information during interviews or research for a story. Reflective recording for personal accounts or interests can involve diaries, notebooks, laptops, or blogs. Students in university lectures take notes using laptops, notebooks, or textbooks to record information from lecturers.
Ws7.1.10
The document discusses designing questionnaires and provides positive and negative aspects of questionnaires based on the student's past experiences. Positives included questionnaires being straightforward, allowing immediate return, and being quick to complete. Negatives were that not all are returned, some don't allow for varied responses, and they can lack interest and appeal for audiences.
Ws7.1.7 complete
This document provides guidance for keeping records of primary research methods used for a project report. It includes a table to log the research method, notes, and date used. Examples given are distributing questionnaires by hand and email to gather audience feedback on a performance, as well as conducting face-to-face interviews with audience members to get reviews to include as evidence in the report. The table is intended to help plan and document the primary research conducted for a project.
Evaluation of the research stage
This section discusses the research done to understand different media types for recording. The author looked at the history and development of print, film, audio, and web-based records. They analyzed how social, economic, and technological factors influenced each medium over time. The author also interviewed experts who provided advice on filmmaking, camera techniques, and animation software. Research was conducted using both primary and secondary sources from the internet, books, and other materials.
Evaluation of the planning process
The document discusses the planning process for creating a music video. It describes the many roles the author took on for their group's music video project, including creating contracts, booking locations, organizing costumes, props, and equipment, developing a production schedule, and contributing to the storyboard. The author had a large responsibility for planning the music video. They were able to book their school as the filming location and get permission, and coordinated schedules between group members. While the author felt they balanced the various roles well, creating the rehearsal schedule was difficult due to members' varying availabilities.
More from renee (20)
WS7.1.2
- 1. Creative and Media: Level 2 Higher Diploma Unit 7: Project Report Level 2 Higher Diploma Creative and MediaUnit 1: Scene 7.1.2 Presenting information Student Book pp 226–35 What kind of information is best presented using each of the following techniques? Try to identify at least one thing for each technique. Technique Type of information A descriptive piece of information that is used to Written text try and describe and inform a person about something. E.G: letter to the council Graphs are best to be used to emphasise the Graph gradual increase/decrease of something. E.G: company’s sales. The type of information that is best presented in a Chart graph is things like statistics showing percentages of something. EG: students transport to school. A table is best to display results that you may find Table after undertaking an experiment or activity. A photograph is best used to show evidence or to Photograph capture a moment that is best to be seen than to be described with words. E.G: rehearsal. Interviews are good when done using audio Audio/visual file equipment as it is easier and allows the audience to seek the full emotion from the response. © Pearson Education Ltd 2008. Copying permitted for purchasing institution only. This material is not copyright free. 1