Downloaded 13 times
![Can the U.S. Get There from Here? Summary for Policymakers 3
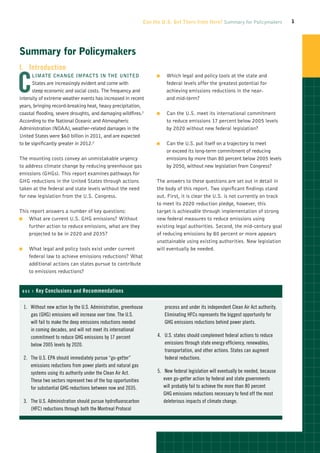
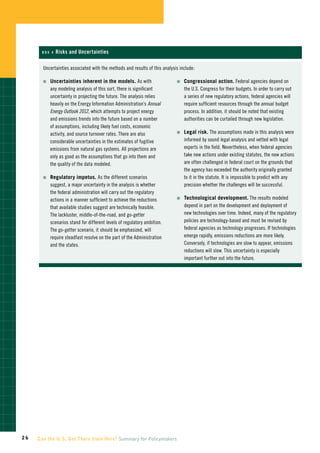
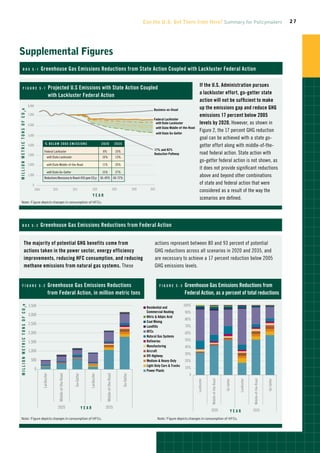
Attaining even the 17 percent reduction goal will A Federal GHG Reductions Possible
.
require new and ambitious action from the U.S. without New Legislation
Administration—ambitious action that must survive OO Only with “go-getter” ambition by the U.S.
court challenges. Real progress depends on numerous Administration can the United States achieve
actions not yet taken by the U.S. Administration— emissions reductions using current law that meet
especially for stationary emissions sources like power or exceed the Copenhagen commitment to reduce
plants, natural gas systems, and industry. U.S. states global warming pollution by at least 17 percent
may also need to take action to fill any emissions gaps below 2005 levels by 2020.6 With middle-of-
left by the federal government. Achieving the necessary the-road ambition, the United States will fall
mid-century reductions will almost certainly require the well short of its 17 percent commitment, unless
U.S. Congress to act to achieve the needed reductions. supplemented by go-getter actions by the states.
Section II summarizes the report’s key findings, OO Even with go-getter ambition, long-term emissions
including the range of reductions that are possible reductions fall short of the level of reductions
and a brief description of the analytical approach. An necessary to put the United States on pace to
examination of current emissions in the United States reach its long-term reduction goal of reducing
and projected emissions without new actions follows emissions 83 percent below 2005 levels by
in Section III. Section IV summarizes the sector-by- 2050. New congressional legislation is therefore
sector actions the federal government might take under necessary to achieve reductions in line with what
existing laws. Section V summarizes potential state the international scientific community agrees is
actions. Section VI sets out summary conclusions. necessary by mid-century in order to stabilize
Two detailed appendixes set out the assumptions and global average temperatures and avert the worst
methodologies for the federal and state analyses. impacts of climate change.
The picture revealed is one of significant potential
greenhouse gas emissions reductions, provided there OO After taking action to significantly improve motor
is sufficient political will to take strong action. vehicle fuel efficiency, the U.S. Administration should
now apply similar ambition to reducing emissions
from a wider range of sources, such as existing power
plants, if it is to achieve the needed reductions.
II. Charting a Path Forward in the U.S.:
Summary of Key Findings OO The greatest projected emissions reduction
This report identifies significant potential for GHG opportunities by 2020 and beyond come from four
emissions reductions by the U.S. Administration under federal policy measures. The Administration will
current laws and through state-level actions, as well as need to pursue these opportunities if the United
the limitations of current tools. The reductions actually States is to achieve the 17 percent reduction
achieved will depend on the level of ambition brought target. Those policies are:
to the effort by the U.S. Administration, including
executive agencies such as the U.S. Environmental OO standards to reduce carbon pollution from
Protection Agency. At the state level, outcomes existing power plants (48 percent of total
will depend on the number of states that choose to emissions gap between business-as-usual
support renewable energy, energy efficiency, and (BAU) and 2020 target);
transportation measures, and to pursue policies that
the federal government opts not to pursue or that go
beyond the minimum stringency set by the federal
government. Key findings are set out below for federal 5. or data sources and an explanation of how expected emissions trends
F
were compiled, please consult the appendixes. For the sake of clarity and
and state actions.5 brevity, sources are not provided in this summary.
6.
The U.S. commitment in Copenhagen calls for reductions in 2020 “in the
range of 17 percent [below 2005 levels], in conformity with anticipated
U.S. energy and climate legislation.” The U.S. submission notes that the
ultimate goal of legislation pending at the time was to reduce emissions
by 83 percent below 2005 levels in 2050.](https://image.slidesharecdn.com/summaryforpolicymakerscanusgettherefromhere-130206093138-phpapp01/85/WRI-Report-Can-The-U-S-Get-There-From-Here-5-320.jpg)
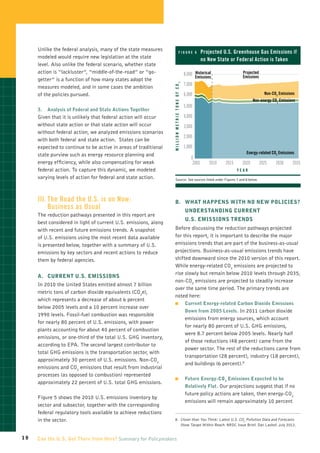

The report examines how the U.S. can reduce greenhouse gas emissions through existing federal laws and state actions without new legislation, highlighting the urgent need for a comprehensive response to climate change. Key findings reveal that while the U.S. is not on track to meet its 2020 reduction pledge of 17% below 2005 levels, achieving this target is possible with strong federal and state efforts. However, to meet longer-term goals of 80% reductions by 2050, new congressional legislation will be essential.