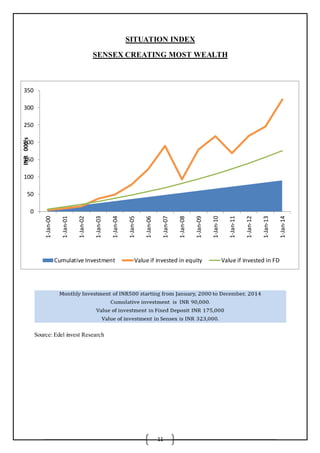
This document is a study on the relationship between currency, equity, commodity, and their movements in the market. It includes chapters on the conceptual overview, research methodology, theoretical background, data analysis, interpretation and findings. The theoretical background chapter provides information on capital markets, equity shares, commodity markets including types of commodities traded, and foreign exchange markets. It analyzes secondary data from 2009-2014 on currency, equity, and commodities to examine their correlation and relationship. The findings suggest there is a relationship between the different market components and their movements impact each other.
![20
Provision of Hedging Facilities: The other important function of the foreign exchange market is to provide
hedging facilities. Hedging refers to covering of export risk, and it provides a mechanism to exporters and
importers to guard themselves against losses from fluctuations in exchange rate.
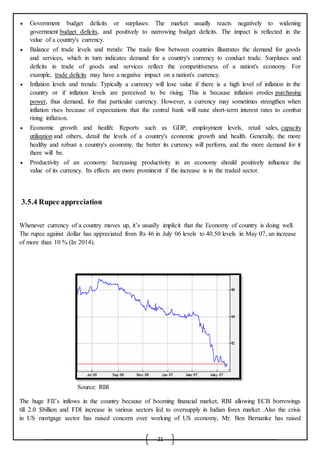
3.5.3 Determinants of exchange rate
The following theories explain the fluctuations in exchange rates in a floating exchange rate regime (In
a fixed exchange rate regime, rates are decided by its government):
1. International parity conditions: Relative Purchasing Power Parity, interest rate parity, Domestic
Fisher effect, International Fisher effect. Though to some extent the above theories provide logical
explanation for the fluctuations in exchange rates, yet these theories falter as they are based on
challengeable assumptions [e.g., free flow of goods, services and capital] which seldom hold true in
the real world.
2. Balance of payments model: This model, however, focuses largely on tradable goods and services,
ignoring the increasing role of global capital flows. It failed to provide any explanation for
continuous appreciation of dollar during 1980s and most part of 1990s in face of soaring US current
account deficit.
3. Asset market model: views currencies as an important asset class for constructing investment
portfolios. Assets prices are influenced mostly by people's willingness to hold the existing quantities
of assets, which in turn depends on their expectations on the future worth of these assets. The asset
market model of exchange rate determination states that “the exchange rate between two currencies
represents the price that just balances the relative supplies of, and demand for, assets denominated in
those currencies.”
None of the models developed so far succeed to explain exchange rates and volatility in the longer time
frames. For shorter time frames (less than a few days) algorithms can be devised to predict prices. It is
understood from the above models that many macroeconomic factors affect the exchange rates and in the
end currency prices are a result of dual forces of demand and supply. The world's currency markets can be
viewed as a huge melting pot: in a large and ever-changing mix of current events, supply and
demand factors are constantly shifting, and the price of one currency in relation to another shifts
accordingly. No other market encompasses (and distills) as much of what is going on in the world at any
given time as foreign exchange.
Supply and demand for any given currency, and thus its value, are not influenced by any single element, but
rather by several. These elements generally fall into three categories: economic factors, political conditions
and market psychology
Economic factors
These include: (a) economic policy, disseminated by government agencies and central banks, (b) economic
conditions, generally revealed through economic reports, and other economic indicators.
Economic policy comprises government fiscal policy (budget/spending practices) and monetary
policy (the means by which a government's central bank influences the supply and "cost" of money,
which is reflected by the level of interest rates).](https://image.slidesharecdn.com/98c7036e-3826-446f-a7da-487345ef2e61-150503005507-conversion-gate01/85/WP-FINAL-20-320.jpg)